Archive for the ‘Tools’ Category
Monday, December 29th, 2008
Sometimes there is a need to preserve a crashing application or a service from termination and keep it in memory without showing any GUI dialogs or message boxes. Here Crash2Hang tool comes handy. It is free and can be downloaded from here:

Download Crash2Hang
The source code is simple as possible:
// Crash2Hang

// Copyright (c) 2009 Dmitry Vostokov

// GNU GENERAL PUBLIC LICENSE

// http://www.gnu.org/licenses/gpl-3.0.txt
#include <windows.h>
int main(int argc, WCHAR* argv[])

{

 if (argc > 1)

  MessageBox(NULL, L"One of processes has called a postmortem debugger!", L"Crash2Hang", MB_OK | MB_ICONSTOP | MB_SETFOREGROUND);

 else

  Sleep(INFINITE);

 return 0;

}
The tool can be used as a postmortem debugger specified in AeDebug registry key, for example, instead of CDB. Any argument specified to Crash2Hang.exe causes it to display a message box when launched
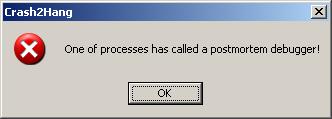
and exit process upon its dismissal. If several threads in a problem process experience an unhandled exception then Crash2Hang process is launched several times which may result in several such message boxes. Without arguments Crash2Hang process hangs infinitely causing the problem thread with an unhandled exception to hang indefinitely too (see my old post Who calls the postmortem debugger? for explanation).
- Dmitry Vostokov @ DumpAnalysis.org -
Posted in Announcements, Debugging, Software Technical Support, Tools | 2 Comments »
Wednesday, December 24th, 2008
The analogy between learning a complex tool with its own language and a foreign natural language has been developed further after the release of WinDbg Learning Cards and finally culminated in “WinDbg In Use” book series with the first book to be published during the 1st quarter of 2009:
- Title: WinDbg In Use: Debugging Exercises (Elementary and Intermediate Level)
- Author: Dmitry Vostokov
- Publisher: Opentask (15 March 2009)
- Language: English
- Product Dimensions: 23.5 x 19.1
- ISBN-13: 978-1-906717-50-6
- Paperback: 200 pages
- Book Annotation: Includes 60 programmed exercises from real life debugging and crash dump analysis scenarios and multiple-choice questions with full answers, comments and suggestions for further reading.
Some example exercises will be published on this blog from time to time. I also plan a corresponding column in the forthcoming Debugged! magazine.
- Dmitry Vostokov @ DumpAnalysis.org -
Posted in Announcements, Assembly Language, Books, Common Mistakes, Crash Dump Analysis, Crash Dump Patterns, Debugging, Education and Research, English Language, Memory Dump Analysis Jobs, Minidump Analysis, Publishing, Security, Software Technical Support, Testing, Tools, Training and Seminars, WinDbg Scripts, WinDbg Tips and Tricks, WinDbg for GDB Users | No Comments »
Tuesday, December 23rd, 2008
The following book is planned for publication during the 1st quarter of 2009:
Title: Reference Stack Traces: Windows Server® 2008 and Windows Vista™
ISBN-13: 978-1-906717-23-0
It features visual separation between kernel and user space in thread stack traces and useful footnotes for IRP and modules. Its publishing was delayed by a few months but fortunately my editing just got new breath by introducing thread stackprint images for kernel stacks (12Kb bitmaps):
Sample pages 13 and 96
Thread stackprints were generated from a complete memory dump using WinDbg scripts and Dump2Picture.
- Dmitry Vostokov @ DumpAnalysis.org -
Posted in Announcements, Books, Crash Dump Analysis, Crash Dump Patterns, Debugging, Fun with Crash Dumps, Memory Visualization, Publishing, Software Technical Support, Stack Trace Collection, Tools, Vista, Windows Server 2008 | No Comments »
Wednesday, December 3rd, 2008
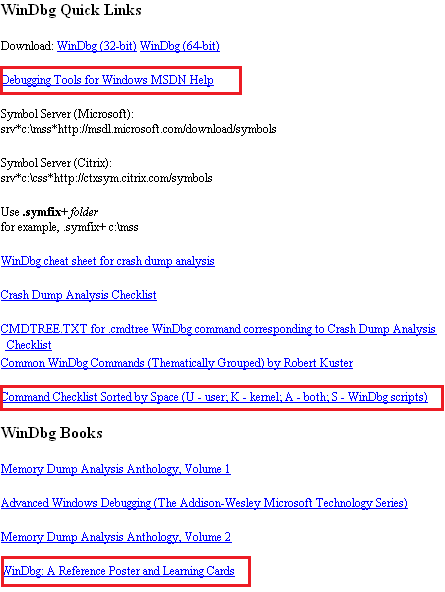
WinDbg.org has been updated to include a sorted command check list, a link to MSDN help and a link to yet another book related to WinDbg. All changes are highlighted in red on the following page screenshot:
- Dmitry Vostokov @ DumpAnalysis.org -
Posted in Announcements, Crash Dump Analysis, Debugging, Software Technical Support, Tools, WinDbg Tips and Tricks | No Comments »
Friday, November 28th, 2008
Following the release of WinDbg: A Reference Poster and Learning Cards the following book is planned for Windows (GDB), Linux and FreeBSD users:
- Title: GDB and KDB Debuggers:
A Reference Poster and Learning Cards
- Author: Gonçalo Gomes
- Publisher: Opentask (1 April 2009)
- Language: English
- Product Dimensions: 28.0 x 21.6
- ISBN-13: 978-1-906717-39-1
- Paperback: 16 pages
- Dmitry Vostokov @ DumpAnalysis.org -
Posted in Announcements, Books, Crash Dump Analysis, Debugging, GDB for WinDbg Users, Memory Analysis Forensics and Intelligence, Publishing, Security, Software Technical Support, Tools | No Comments »
Friday, November 28th, 2008
Due to some technical difficulties the release of WinDbg: A Reference Poster and Learning Cards has been delayed by 2 weeks. Now I got a proof copy and approved the book distribution on Amazon, B&N and other bookshops worldwide. Hope you will enjoy it and find it useful.
The similar book for GDB will be announced soon.
- Dmitry Vostokov @ DumpAnalysis.org -
Posted in Announcements, Books, Crash Dump Analysis, Crash Dump Patterns, Debugging, Publishing, Software Technical Support, Tools, WinDbg Tips and Tricks, WinDbg for GDB Users | No Comments »
Thursday, November 27th, 2008
I’ve been thinking through the so called First Faults after Dan Skwire, a veteran in mission-critical computer system problem resolution, problem prevention, and system recovery, organized a group on LinkedIn for first fault problem solving activity. He also has a website:
http://www.firstfaultproblemresolution.com/
From my software technical support experience first fault problem resolution is very important on Windows platforms, especially in enterprise terminal service and virtualized environments where hundreds of users can be hosted on just one server. Therefore, proper tools, processes and checklists need to be set up and established for effective and efficient troubleshooting and problem resolution from both engineering and customer relationship managing perspectives. Here crash and hang dump analysis helps immensely, especially memory analysis patterns and fault databases. More on this later with specific examples. I’m also working currently on incorporating first fault problem resolution into VERSION troubleshooting steps and PARTS troubleshooting methodology.
- Dmitry Vostokov @ DumpAnalysis.org -
Posted in Crash Dump Analysis, First Fault Problem Solving, Software Technical Support, Testing, Tools, Troubleshooting Methodology | No Comments »
Tuesday, November 25th, 2008
As one of the new initiatives for the Year of Debugging DumpAnalysis Portal will publish bimonthly full color 16 page publication called:
Debugged! MZ/PE: MagaZine for/from Practicing Engineers
The only serial publication dedicated entirely to Windows® debugging
The first issue is planned for March, 2009 and will have ISBN-13: 978-1-906717-38-4. If it goes well I’m planning to have ISSN number assigned to it too. More details will be announced soon.
- Dmitry Vostokov @ DumpAnalysis.org -
Posted in Announcements, Assembly Language, Books, Bugchecks Depicted, CDA Pattern Classification, Citrix, Common Mistakes, Crash Dump Analysis, Crash Dump Patterns, Crash Dumps for Dummies, Data Recovery, Debugged! MZ/PE, Debugging, IDA for WinDbg Users, Kernel Development, Memory Analysis Forensics and Intelligence, Memory Visualization, Minidump Analysis, Philosophy, Publishing, Security, Software Technical Support, Testing, Tools, Training and Seminars, Troubleshooting Methodology, Vista, WinDbg Scripts, WinDbg Tips and Tricks, WinDbg for GDB Users, Windows Server 2008 | 4 Comments »
Monday, November 24th, 2008
Thanks to shellexecute I got the news of this release. Remember, you can always access quick download links from www.windbg.org.
Dmitry Vostokov @ DumpAnalysis.org -
Posted in Announcements, Crash Dump Analysis, Debugging, Software Technical Support, Tools, WinDbg Tips and Tricks | 4 Comments »
Tuesday, November 18th, 2008
“… the” debugger “(my almighty” application ”) …”
Thomas Jefferson, TO JAMES MONROE, Paris Mar. 18. 1785
- Dmitry Vostokov @ DumpAnalysis.org -
Posted in Bugtations, Crash Dump Analysis, Debugging, Tools | No Comments »
Monday, November 10th, 2008
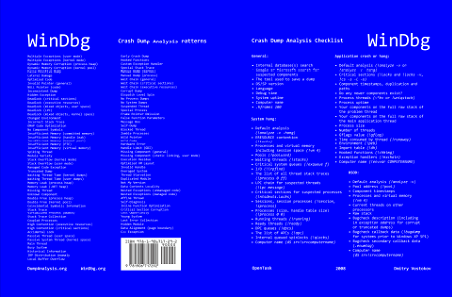
Suddenly the course of my publishing activities bended a little to produce a DIY poster and learning cards to be published soon. Here are the product details:
Annotation:
WinDbg is a powerful debugger from Microsoft Debugging Tools for Windows. It has more than 350 commands that can be used in different debugging scenarios. The cover of this book is a poster featuring crash dump analysis checklist and common patterns seen in memory dumps and live debugging sessions. Inside the book you can find ready to cut learning cards with commands and their descriptions coloured according to their use for crash dump or live debugging sessions and user, kernel or complete memory dumps. Tossing cards can create unexpected connections between commands and help to learn them more quickly. Uncut pages can also serve as birds eye view to WinDbg debugging capabilities. More than 350 WinDbg commands including meta-commands and extensions are included.
- Title: WinDbg: A Reference Poster and Learning Cards
- Authors: Dmitry Vostokov
- Publisher: Opentask (20 November 2008)
- Language: English
- Product Dimensions: 28.0 x 21.6
- ISBN-13: 978-1-906717-29-2
- Paperback: 20 pages
Book Excerpt
Front cover:
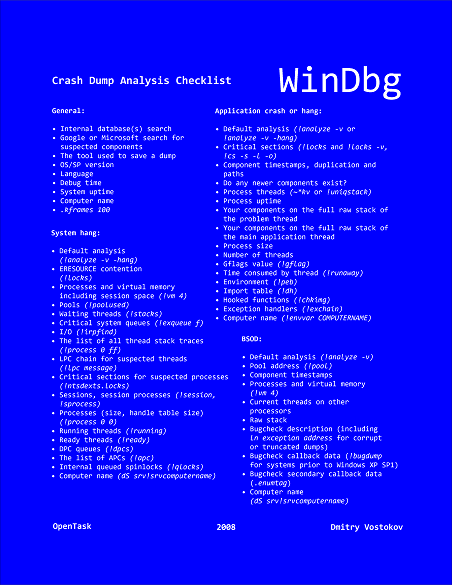
Back cover:
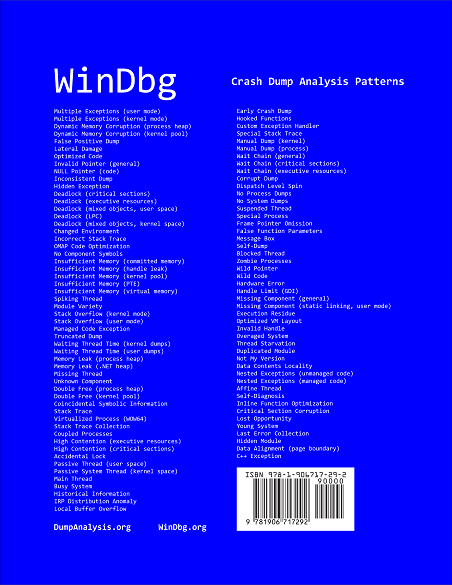
After you take inside pages out you are left with a cover that you can use as a crash dump analysis checklist and patterns poster:
I also plan to update this book on a yearly basis.
- Dmitry Vostokov @ DumpAnalysis.org -
Posted in Announcements, Books, Crash Dump Analysis, Crash Dump Patterns, Debugging, Publishing, Software Technical Support, Tools, Training and Seminars, WinDbg Scripts, WinDbg Tips and Tricks, WinDbg for GDB Users | 3 Comments »
Wednesday, November 5th, 2008
Matthieu Suiche has released the new version of win32dd tool with the ability to save physical memory in a WinDbg-compliant memory dump file including pages that normally are not saved in a complete memory dump.
- Dmitry Vostokov @ DumpAnalysis.org -
Posted in Announcements, Crash Dump Analysis, Data Recovery, Debugging, Memory Analysis Forensics and Intelligence, Security, Software Technical Support, Tools, Vista, Windows Server 2008 | No Comments »
Friday, October 31st, 2008
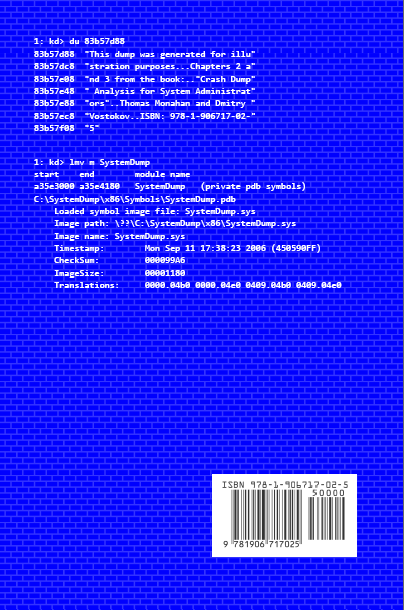
Previously announced book Crash Dump Analysis for System Administrators and Support Engineers (Windows Edition) has got its draft cover featuring WinDbg output from a kernel memory dump forced by Citrix SystemDump tool.
Front:
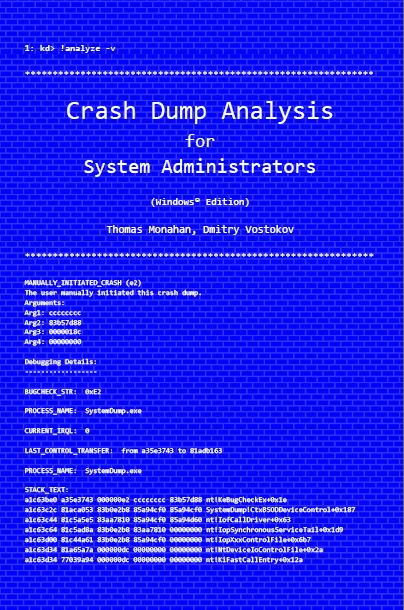
Back:
- Dmitry Vostokov @ DumpAnalysis.org -
Posted in Announcements, Books, Citrix, Crash Dump Analysis, Crash Dumps for Dummies, Minidump Analysis, Publishing, Security, Software Technical Support, Testing, Tools, Training and Seminars, Vista, WinDbg Tips and Tricks, Windows Server 2008 | No Comments »
Saturday, October 18th, 2008
Paperback edition of Memory Dump Analysis Anthology, Volume 2 is finally available on Amazon and Barnes & Noble. Search Inside is also available on Amazon. In addition, I updated the list of recommended books:
Listmania! Crash Dump Analysis and Debugging
Hardcover edition will be available on Amazon and B&N in 2-3 weeks.
- Dmitry Vostokov @ DumpAnalysis.org -
Posted in Announcements, Assembly Language, Books, Bugchecks Depicted, CDF Analysis Tips and Tricks, Certification, Citrix, Common Mistakes, Crash Dump Analysis, Crash Dump Patterns, Crash Dumps for Dummies, Data Recovery, DebugWare Patterns, Debugging, Fun with Crash Dumps, Hardware, Kernel Development, Memory Analysis Forensics and Intelligence, Memory Dump Analysis Jobs, Memory Visualization, Minidump Analysis, Music for Debugging, New Words, Philosophy, Publishing, Science of Memory Dump Analysis, Security, Software Architecture, Software Technical Support, Stack Trace Collection, Testing, Tools, Training and Seminars, Troubleshooting Methodology, Virtualization, Vista, WinDbg Scripts, WinDbg Tips and Tricks, WinDbg for GDB Users, Windows Server 2008 | No Comments »
Saturday, October 11th, 2008
Seems railroad to it was a success: just got this message in my e-mail:
“Congratulations on passing your recent Microsoft Certification exam, inspiring confidence for your employer, your peers, and yourself with a widely-recognized validation of your skills on Microsoft technology.“
Because I haven’t done any exam since Windows Internals beta I assumed that I passed it and I was right! After registering at Microsoft certification site as MCP I was able to build my logo:
_1125.png)
Here is the link to Exam 70-660 information and required skills:
http://www.microsoft.com/learning/en/us/Exams/70-660.aspx
- Dmitry Vostokov @ DumpAnalysis.org -
Posted in Announcements, Assembly Language, Bugchecks Depicted, Certification, Citrix, Crash Dump Analysis, Debugging, Hardware, Kernel Development, Memory Analysis Forensics and Intelligence, Minidump Analysis, Software Technical Support, Tools, Training and Seminars, WinDbg Tips and Tricks | 6 Comments »
Tuesday, October 7th, 2008
Over the time I noticed that some troubleshooting and debugging tools show numbers in hex and some in decimal even for things that are traditionally hex, for example PID and TID. Then when getting data from one program I need to convert it to a different base for another tool. So over some time I was able to get the idea of what hex numbers usually are even if they don’t have hexadecimal ‘A’-'F’ in their digits. For example, in one log I got this output:
Parent changed to 393954
Although this number is valid hex number as well as decimal I had intuitive feeling that it was decimal… Checking source code of the tool revealed that it was output as decimal indeed.
I guess this feeling arouse because I just checked that most window handles that I have seen have the 4th zero digit:
Handle: 2801E6Handle: 110044Handle: 10052Handle: E01B6Handle: 602E2
- Dmitry Vostokov @ DumpAnalysis.org -
Posted in Software Technical Support, Tools | No Comments »
Friday, October 3rd, 2008
“Everything is memory dump.”
I’m very excited to announce that Volume 2 is available in paperback, hardcover and digital editions:
Memory Dump Analysis Anthology, Volume 2
In one or two weeks paperback edition should also appear on Amazon and other bookstores. Amazon hardcover edition is planned to be available by the end of October.
I’m often asked when Volume 3 is available and I currently plan to release it in October - November, 2009. In the mean time I’m planning to concentrate on other publishing projects.
- Dmitry Vostokov @ DumpAnalysis.org -
Posted in Announcements, Assembly Language, Books, Bugchecks Depicted, CDF Analysis Tips and Tricks, Citrix, Common Mistakes, Crash Dump Analysis, Crash Dump Patterns, Crash Dumps for Dummies, Data Recovery, DebugWare Patterns, Debugging, Fun with Crash Dumps, Kernel Development, Memory Analysis Forensics and Intelligence, Memory Dump Analysis Jobs, Memory Visualization, Minidump Analysis, Music for Debugging, New Words, Philosophy, Publishing, Science of Memory Dump Analysis, Security, Software Architecture, Software Technical Support, Stack Trace Collection, Testing, Tools, Training and Seminars, Troubleshooting Methodology, Virtualization, Vista, WinDbg Scripts, WinDbg Tips and Tricks, WinDbg for GDB Users, Windows Server 2008 | No Comments »
Wednesday, October 1st, 2008
The book is nearly finished and here is the final TOC:
Memory Dump Analysis Anthology, Volume 2: Table of Contents
- Dmitry Vostokov @ DumpAnalysis.org -
Posted in Announcements, Assembly Language, Books, Bugchecks Depicted, CDF Analysis Tips and Tricks, Citrix, Common Mistakes, Crash Dump Analysis, Crash Dump Patterns, Crash Dumps for Dummies, Data Recovery, DebugWare Patterns, Debugging, Fun with Crash Dumps, Kernel Development, Memory Dump Analysis Jobs, Memory Visualization, Minidump Analysis, Music for Debugging, Publishing, Science of Memory Dump Analysis, Security, Software Technical Support, Stack Trace Collection, Tools, Troubleshooting Methodology, Virtualization, Vista, WinDbg Scripts, WinDbg Tips and Tricks, WinDbg for GDB Users, Windows Server 2008 | No Comments »
Tuesday, September 30th, 2008
Today Citrix officially joined the club of public symbol server companies! Please refer to the following article for details:
How to Use the Citrix Symbol Server to Obtain Debug Symbols
- Dmitry Vostokov @ DumpAnalysis.org -
Posted in Announcements, Citrix, Crash Dump Analysis, Crash Dumps for Dummies, Debugging, Minidump Analysis, Software Technical Support, Stack Trace Collection, Tools, Vista, WinDbg Tips and Tricks, Windows Server 2008 | 4 Comments »