Archive for the ‘Tools’ Category

RADII and SDSD

Saturday, July 4th, 2009

Supportability is similar to serviceability and while working on DebugWare book I realized that writing support tools needs its own buzz word like model-driven software design. Hence SDSD acronym was born a few days ago:

SDSD

Supportability-Driven Software Design

or

Support-Driven Software Design

or

Serviceability-Driven Software Design

Thinking about where to insert requirements, architecture and design led me to another acronym:

RADII

Requirements, Architecture, Design, Implementation and Improvement

The plural form of radius signifies the fact that there is a plurality of ways how SDLC can be implemented. Improvement is similar to Maintenance.

- Dmitry Vostokov @ DumpAnalysis.org -

Trace Analysis Patterns (Part 4)

Tuesday, June 16th, 2009

Sometimes we see a functional activity in a trace and / or see basic facts. Then we might want to find a correlation between that activity or facts in another part of the trace. If that intra-correlation fits into our problem description we may claim a possible explanation or, if we are lucky, we have just found, an inference to the best explanation, as philosophers of science like to say. Here is an example, but this time using Citrix WindowHistory tracing tool. A third-party application was frequently loosing the focus and the suspicion was on a terminal services client process. It was found that the following WindowHistory trace fragment corresponds to that application:

Handle: 00050586 Class: "Application A Class" Title: ""
     Title changed at 15:52:4:3 to "Application A"
     Title changed at 15:52:10:212 to "Application A - File1"
[...]
   Process ID: 89c
   Thread ID: d6c
[...]
   Visible: true
   Window placement command: SW_SHOWNORMAL
        Placement changed at 15:54:57:506 to SW_SHOWMINIMIZED
        Placement changed at 15:55:2:139 to SW_SHOWNORMAL
   Foreground: false
        Foreground changed at 15:52:4:3 to true
        Foreground changed at 15:53:4:625 to false
        Foreground changed at 15:53:42:564 to true
        Foreground changed at 15:53:44:498 to false
        Foreground changed at 15:53:44:498 to true
        Foreground changed at 15:53:44:592 to false
        Foreground changed at 15:53:45:887 to true
        Foreground changed at 15:53:47:244 to false
        Foreground changed at 15:53:47:244 to true
        Foreground changed at 15:53:47:353 to false
        Foreground changed at 15:54:26:416 to true
        Foreground changed at 15:54:27:55 to false
        Foreground changed at 15:54:27:55 to true
        Foreground changed at 15:54:27:180 to false
        Foreground changed at 15:54:28:428 to true
        Foreground changed at 15:54:28:771 to false
        Foreground changed at 15:54:28:865 to true
        Foreground changed at 15:54:29:99 to false
        Foreground changed at 15:54:30:877 to true
        Foreground changed at 15:54:57:521 to false
        Foreground changed at 15:55:2:76 to true
        Foreground changed at 15:57:3:378 to false
        Foreground changed at 15:57:11:396 to true
        Foreground changed at 15:57:29:601 to false
        Foreground changed at 15:57:39:803 to true
        Foreground changed at 15:58:54:41 to false
        Foreground changed at 15:59:8:96 to true
        Foreground changed at 16:1:19:478 to false
        Foreground changed at 16:1:27:527 to true
        Foreground changed at 16:1:39:914 to false
        Foreground changed at 16:2:0:515 to true
        Foreground changed at 16:7:14:628 to false
        Foreground changed at 16:7:24:246 to true
        Foreground changed at 16:9:53:523 to false
        Foreground changed at 16:10:15:919 to true
        Foreground changed at 16:10:31:426 to false
        Foreground changed at 16:11:12:818 to true
        Foreground changed at 16:11:59:538 to false
        Foreground changed at 16:12:39:456 to true
        Foreground changed at 16:13:6:364 to false

Corresponding terminal services client window trace fragment doesn’t have any foreground changes but another application main window has lots of them:

Handle: 000D0540 Class: "Application B Class" Title: "Application B"
[...]
   Process ID: 3ac
   Thread ID: bd4
[...]
   Foreground: false
        Foreground changed at 15:50:36:972 to true
        Foreground changed at 15:50:53:732 to false
        Foreground changed at 15:50:53:732 to true
        Foreground changed at 15:50:53:826 to false
        Foreground changed at 15:51:51:352 to true
        Foreground changed at 15:51:53:941 to false
        Foreground changed at 15:53:8:135 to true
        Foreground changed at 15:53:8:182 to false
        Foreground changed at 15:53:10:178 to true
        Foreground changed at 15:53:13:938 to false
        Foreground changed at 15:53:30:443 to true
        Foreground changed at 15:53:31:20 to false
        Foreground changed at 15:53:31:20 to true
        Foreground changed at 15:53:31:129 to false
        Foreground changed at 15:53:34:78 to true
        Foreground changed at 15:53:34:795 to false
        Foreground changed at 15:53:34:795 to true
        Foreground changed at 15:53:34:873 to false
        Foreground changed at 15:53:36:901 to true
        Foreground changed at 15:53:42:502 to false
        Foreground changed at 15:53:42:502 to true
        Foreground changed at 15:53:42:564 to false
        Foreground changed at 15:57:3:425 to true
        Foreground changed at 15:57:4:595 to false
        Foreground changed at 15:57:10:507 to true
        Foreground changed at 15:57:11:318 to false
        Foreground changed at 15:57:29:632 to true
        Foreground changed at 15:57:31:67 to false
        Foreground changed at 15:57:32:721 to true
        Foreground changed at 15:57:33:844 to false
        Foreground changed at 15:58:54:88 to true
        Foreground changed at 15:58:56:178 to false
        Foreground changed at 15:59:6:505 to true
        Foreground changed at 15:59:7:987 to false
        Foreground changed at 16:1:19:525 to true
        Foreground changed at 16:1:19:961 to false
        Foreground changed at 16:1:26:607 to true
        Foreground changed at 16:1:27:434 to false
        Foreground changed at 16:1:39:914 to true
        Foreground changed at 16:1:39:992 to false
        Foreground changed at 16:1:49:798 to true
        Foreground changed at 16:2:0:437 to false
        Foreground changed at 16:7:14:628 to true
        Foreground changed at 16:7:14:847 to false
        Foreground changed at 16:7:18:76 to true
        Foreground changed at 16:7:24:106 to false
        Foreground changed at 16:9:58:790 to true
        Foreground changed at 16:10:4:16 to false
        Foreground changed at 16:10:4:874 to true
        Foreground changed at 16:10:4:890 to false
        Foreground changed at 16:10:8:634 to true
        Foreground changed at 16:10:15:779 to false
        Foreground changed at 16:10:56:766 to true
        Foreground changed at 16:10:59:402 to false
        Foreground changed at 16:10:59:652 to true
        Foreground changed at 16:10:59:667 to false
        Foreground changed at 16:12:9:397 to true
        Foreground changed at 16:12:39:347 to false
        Foreground changed at 16:13:18:375 to true
        Foreground changed at 16:14:33:656 to false

We can see that most of the time when Application A window looses focus Application B window gets it.

- Dmitry Vostokov @ TraceAnalysis.org -

Software Defect Construction

Tuesday, June 16th, 2009

This is the main topic of the forthcoming next issue of Debugged MZ/PE magazine. The most close term is called “fault injection” but I rediscovered it as a “software defect construction”, “software defect simulation” or “software defect modeling”. The latter term is also used to refer to construction of mathematical models related to software product quality and corresponding statistics but “modeling software defects” seems appropriate subtitle for the magazine front cover picture… Software defect construction is more general term than fault injection. The latter is used for testing but we want to simulate bugs and abnormal system conditions to study debugging and memory dump analysis techniques or to build reproduction environments. I actually recently found and bought the used copy of this book:

Software Fault Injection: Inoculating Programs Against Errors

Buy from Amazon

and plan to write my own book with the following working title later:

Software Defect Construction: Simulation and Modeling of Software Bugs (ISBN: 978-1906717759)

- Dmitry Vostokov @ DumpAnalysis.org -

Welcome to TraceAnalysis.org!

Wednesday, June 3rd, 2009

DumpAnalysis.org acquires TraceAnalysis.org to complete computer DATA artifact analysis. The domain currently points to Dump Analysis Portal page but this might change in the future.

- Dmitry Vostokov @ DumpAnalysis.org -

Graphical Notation for Memory Dumps (Part 1)

Saturday, May 23rd, 2009

Inspired by Penrose tensor notation encountered in The Road to Reality book and Feynman diagrams I’d like to introduce Visual Dump Objects (VDO) graphical notation to depict and communicate memory dump analysis patterns, their combinations and analysis results. Let’s look at some basic visual objects (shown in handwriting).

1. A thread:

   or   

2. A function:

3. A module:

4. A thread running through functions, modules or both (stack trace). Optional arrowhead can indicate stack trace direction:

  or    or  

Threads running through modules depict collapsed stack traces.

5. A blocked thread:

An example of 3 threads blocked by another thread (an arrowhead can disambiguate the direction of the waiting chain):

6. A spiking thread (colors are encouraged in VDO notation):

   or   

7. Space boundary between user land and kernel land:


Here is an example of the thread spiking in kernel space:

or with modules from stack trace:

More notation to come very soon.

- Dmitry Vostokov @ DumpAnalysis.org -

Software Tracing and Logging

Monday, May 18th, 2009

This is a forthcoming book to be released next year after we finally publish DebugWare book by the end of this summer:

Software Tracing and Logging: Architecture, Design, Implementation and Analysis Patterns (ISBN: 978-1906717728)

I have already begun working on it in the background. The scope of DebugWare book is too wide to cover tracing and logging in great detail not to mention the very important subject of software trace analysis.

- Dmitry Vostokov @ TraceAnalysis.org -

Dining Chicken

Wednesday, April 29th, 2009

To illustrate preemptive multitasking orchestrated by a central processor I use a Russian toy that reminds me of the dining philosophers problem that usually opens any textbook on concurrency:

Here is the video (you need to download and install Xvid MP4 codec if your computer doesn’t play it):

Download DiningChicken.avi (1.2 Mb)

- Dmitry Vostokov @ DumpAnalysis.org -

New Memory Dump Type in Windows 7!

Wednesday, April 1st, 2009

Microsoft to add 5th memory dump type to the final version of Windows 7. In addition to kernel, complete, mini and user dump file types new memory dumps will include all open files to allow full data recovery and postmortem process resurrection on another computer. The new coming soon version of WinDbg includes specialized extensions for process instantiation and recursive data recovery near the point of failure:

blogs.technet.com/5thcolumn

- Dmitry Vostokov @ DumpAnalysis.org -

March issue of Debugged! MZ/PE is available!

Sunday, March 29th, 2009

Finally it has been published and available for orders from Amazon and other bookstores:

http://www.dumpanalysis.org/Debugged+Magazine

I had to increase the number of pages for the first issue from 16, planned originally, to 28 and this is reflected in the retail price of $10 (originally planned $8) but bookstores should sell it with a discount between 0% and 55%.

More information about the next issue should be ready by the end of the next week.

- Dmitry Vostokov @ DumpAnalysis.org

Exploitable Crash Analyzer WinDbg Extension

Tuesday, March 24th, 2009

Just recently got news about a Microsoft security WinDbg extension released as open source:

http://www.microsoft.com/security/msec/default.mspx

http://www.codeplex.com/msecdbg 

- Dmitry Vostokov @ DumpAnalysis.org -

Debugged! MZ/PE soon to be available!

Wednesday, March 18th, 2009

Yesterday I submitted the magazine to print and distribution world-wide. If everything is right it should be available by the end of this month. This first issue features 12 page WinDbg command supplement to pattern-driven memory dump analysis methodology, an overview of Win32dd complete memory dumper and PowerDbg enhancements to debug ASP.NET code. The magazine will only be available in print.

- Dmitry Vostokov @ DumpAnalysis.org -

Book: Crash Dump Analysis for SA and SE (2nd update)

Saturday, March 7th, 2009

I’m sorry to announce that the book has been delayed and the publication date has been changed to 30th of November, 2009. I promise this delay is the last one and kindly ask you to be patient. As a bonus or compensation for it, the book will also cover Windows 7.

- Dmitry Vostokov @ DumpAnalysis.org -

Sysinternals Reference Book

Thursday, March 5th, 2009

Just found on Amazon this forthcoming book:

Windows® Sysinternals Administrator’s Reference (Inside Out)

Buy from Amazon

- Dmitry Vostokov @ DumpAnalysis.org -

Debugger Log Reading Techniques (Part 1)

Thursday, February 26th, 2009

Debugger logs (textual output) from commands like !process 0 ff and various scripts can be very long and consist of thousands of pages. I found the following reading technique useful for my daily memory dump analysis activities:

CSA-QSA

Checklists-Skim-Analyze—Questions-Survey-Analyze   

1. First, have a checklist

2. Skim through the log several times

3. Write analysis notes

4. Have a list of questions based on problem description and steps 1-3

5. Survey the log

6. Write analysis notes

Repeat steps 2,3 and 5,6 if necessary.

This technique can also be applied to reading any large logs, for example, voluminous CDF or ETW traces.

- Dmitry Vostokov @ DumpAnalysis.org -

OSMOSIS Memory Dumps

Monday, February 23rd, 2009

The main problem of memory dump analysis is the lack of consistent kernel virtual memory dumps saved on demand without system halt. LiveKd and Win32DD tools are physical memory dumpers only and do not save kernel memory dump files. These dumps are known to be inconsistent and I elaborated on different schemes to save memory consistently, for example, 1) to partition physical memory into 2 parts from OS boot time, 2) when memory snapshot is needed raise IRQL on all processors, 3) pump memory contents from one part to another (with compression if necessary, in such partition the reserved part of physical memory could be smaller), 4) lower IRQL on all processors to resume normal OS functions and 5) save consistent memory snapshot from reserved part of physical memory to a dump file in the background. The crucial feature of osmosis is its bipartite division and membrane. Hence the name of the project: 

OSMOSIS

Optimally Saved Memory of System Internal State

Optimally Saved Memory (of) Operating System Internal State


This is, of course, for OS running on physical machines, virtual machine case is much simpler in theory because we can freeze the whole VM or save its snapshot and later run an external tool or file converter on it.

- Dmitry Vostokov @ DumpAnalysis.org -

Book Update: Crash Dump Analysis for SA

Friday, February 20th, 2009

One of the good outcomes of the previously announced restructuring: the book Crash Dump Analysis for System Administrators (Windows edition) has been prioritized to be published on 30th of November, 2009 due to the overwhelming demand. The book will soon be available for pre-orders.

- Dmitry Vostokov @ DumpAnalysis.org -

Windows Debugging book has been published!

Monday, February 2nd, 2009

I very proud to announce that after 3 weeks of final work the book has been released in both paperback and PDF format. In a week or so it should also appear on Amazon and other booksellers around the world. The book information and how to buy it can be found on the portal:

Windows Debugging: Practical Foundations

- Dmitry Vostokov @ DumpAnalysis.org -

How to simulate a process hang?

Monday, January 26th, 2009

One question that people often ask is to how to simulate a process hang. One method that I found is to attach WinDbg noninvasively, freeze all threads by executing the following command:

~*n

and then quit by using q command. This leaves an application or a service process in a total hang state.

- Dmitry Vostokov @ DumpAnalysis.org -

Front Cover for DebugWare Book

Saturday, January 10th, 2009

Finally designed a conceptual cover for DebugWare book using command-line theme:

- Dmitry Vostokov @ DumpAnalysis.org -

MTCrash

Wednesday, December 31st, 2008

To test various postmortem debuggers and WER to their fullest potential and especially Crash2Hang I wrote another small program that models multiple exceptions in several threads. It is free and can be downloaded with full PDB and source code from here:

Download MTCrash

The source code is simple as possible:

// MTCrash (Multithreaded crash)
// Copyright (c) 2009 Dmitry Vostokov
// GNU GENERAL PUBLIC LICENSE
// http://www.gnu.org/licenses/gpl-3.0.txt

#include <windows.h>
#include <process.h>
#include <iostream>

bool twice = false;

void thread_one(void *)
{
 Sleep(1000);
 std::cout << "Thread 1 is about to experience an AV exception..." << std::endl;
 *(int *)NULL = 0;
}

void thread_two(void *)
{
 Sleep(2000);
 if (twice)
 {
  std::cout << "Thread 2 is about to experience an AV exception..." << std::endl;
  *(int *)NULL = 0;
 }

 while (true)
 {
  std::cout << "Thread 2 is still running..." << std::endl;
  Sleep(1000);
 }
}

int main(int argc, WCHAR* argv[])
{
 if (argc > 1) twice = true;

 _beginthread(thread_two, 0, NULL);
 _beginthread(thread_one, 0, NULL);

 while(true)
 {
  std::cout << "Main Thread is still running..." << std::endl;
  Sleep(1000);
 }

 return 0;
}

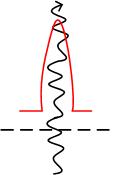
It creates 2 additional threads and the first of them tries to access a NULL pointer:

This dump file has an exception of interest stored in it.
The stored exception information can be accessed via .ecxr.
(d3c.e94): Access violation - code c0000005 (first/second chance not available)
eax=00000000 ebx=005a4660 ecx=0041948c edx=00419ef0 esi=00419488 edi=00000000
eip=004013bd esp=007eff7c ebp=007effb4 iopl=0 nv up ei pl zr na pe nc
cs=0023  ss=002b  ds=002b  es=002b  fs=0053  gs=002b  efl=00010246
MTCrash!thread_one+0×6d:
004013bd c7050000000000000000 mov dword ptr ds:[0],0  ds:002b:00000000=????????

0:002> ~*kL

   0  Id: d3c.eb4 Suspend: 1 Teb: 7efdd000 Unfrozen
ChildEBP RetAddr 
002dfee4 7d4d0ec5 ntdll!ZwDelayExecution+0x15
002dff4c 7d4d14ef kernel32!SleepEx+0x68
002dff5c 0040157a kernel32!Sleep+0xf
002dff70 004046ac MTCrash!main+0xaa
002dffc0 7d4e7d2a MTCrash!__tmainCRTStartup+0x15f
002dfff0 00000000 kernel32!BaseProcessStart+0x28

   1  Id: d3c.ebc Suspend: 1 Teb: 7efda000 Unfrozen
ChildEBP RetAddr  
006afee4 7d4d0ec5 ntdll!ZwDelayExecution+0x15
006aff4c 7d4d14ef kernel32!SleepEx+0x68
006aff5c 004014c5 kernel32!Sleep+0xf
006aff7c 00404352 MTCrash!thread_two+0xf5
006affb4 004043eb MTCrash!_callthreadstart+0x1b
006affb8 7d4dfe21 MTCrash!_threadstart+0x73
006affec 00000000 kernel32!BaseThreadStart+0x34

#  2  Id: d3c.e94 Suspend: 1 Teb: 7efd7000 Unfrozen
ChildEBP RetAddr 
007effb8 7d4dfe21 MTCrash!thread_one+0×6d
007effe4 00000000 kernel32!BaseThreadStart+0×34

   3  Id: d3c.f0c Suspend: 1 Teb: 7efaf000 Unfrozen
ChildEBP RetAddr 
0083ffc8 7d665081 ntdll!DbgBreakPoint+0x1
0083fff4 00000000 ntdll!DbgUiRemoteBreakin+0x2d

The second thread and main thread continue to run:

C:\Crash2Hang>MTCrash.exe
Main Thread is still running...
Thread 1 is about to experience an AV exception...
Main Thread is still running...
Thread 2 is still running...
Main Thread is still running...
Thread 2 is still running...
Main Thread is still running...
Thread 2 is still running...
[...]

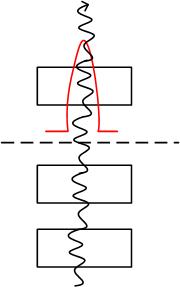
If launched with any parameter the second thread also experiences an unhandled exception (in red) while the first one is suspended by an unhandled exception filter (in blue):

This dump file has an exception of interest stored in it.
The stored exception information can be accessed via .ecxr.
(ca4.cb0): Access violation - code c0000005 (first/second chance not available)
eax=00000000 ebx=005a4668 ecx=0041948c edx=00419ef0 esi=00419488 edi=00000000
eip=004013bd esp=007eff7c ebp=007effb4 iopl=0 nv up ei pl zr na pe nc
cs=0023  ss=002b  ds=002b  es=002b  fs=0053  gs=002b  efl=00010246
MTCrash!thread_one+0×6d:
004013bd c7050000000000000000 mov dword ptr ds:[0],0  ds:002b:00000000=????????

0:002> ~*kL

   0  Id: ca4.ca0 Suspend: 1 Teb: 7efdd000 Unfrozen
ChildEBP RetAddr 
002dfee4 7d4d0ec5 ntdll!ZwDelayExecution+0x15
002dff4c 7d4d14ef kernel32!SleepEx+0x68
002dff5c 0040157a kernel32!Sleep+0xf
002dff70 004046ac MTCrash!main+0xaa
002dffc0 7d4e7d2a MTCrash!__tmainCRTStartup+0x15f
002dfff0 00000000 kernel32!BaseProcessStart+0x28

   1  Id: ca4.ca8 Suspend: 1 Teb: 7efda000 Unfrozen
ChildEBP RetAddr  
006af8cc 7d5357f3 ntdll!ZwRaiseHardError+0×12
006afb38 7d508f4e kernel32!UnhandledExceptionFilter+0×519
006afb40 7d4d8a25 kernel32!BaseThreadStart+0×4a (FPO: [SEH])
006afb68 7d61ec2a kernel32!_except_handler3+0×61
006afb8c 7d61ebfb ntdll!ExecuteHandler2+0×26
006afc34 7d61ea36 ntdll!ExecuteHandler+0×24
006afc34 0040144f ntdll!KiUserExceptionDispatcher+0xe (CONTEXT @ 006afc9c)
006aff7c 00404352 MTCrash!thread_two+0×7f
006affb4 004043eb MTCrash!_callthreadstart+0×1b
006affb8 7d4dfe21 MTCrash!_threadstart+0×73
006affec 00000000 kernel32!BaseThreadStart+0×34

#  2  Id: ca4.cb0 Suspend: 1 Teb: 7efd7000 Unfrozen
ChildEBP RetAddr 
007effb8 7d4dfe21 MTCrash!thread_one+0×6d
007effe4 00000000 kernel32!BaseThreadStart+0×34

0:002> .cxr 006afc9c
eax=00000000 ebx=005a4448 ecx=0041948c edx=00419ef0 esi=00419488 edi=00000000
eip=0040144f esp=006aff68 ebp=7d4d14e0 iopl=0  nv up ei pl zr na pe nc
cs=0023  ss=002b  ds=002b  es=002b  fs=0053  gs=002b  efl=00010246
MTCrash!thread_two+0×7f:
0040144f c7050000000000000000 mov dword ptr ds:[0],0  ds:002b:00000000=????????

However as soon as we dismiss the first error message box or if Auto is set to 1 in AeDebug registry key MTCrash terminates. If Crash2Hang is set as a default postmortem debugger then we get two instances of it running and MTCrash hangs even if we dismiss the first message. The main thread continues to run:

C:\Crash2Hang>MTCrash.exe 1
Main Thread is still running...
Thread 1 is about to experience an AV exception...
Main Thread is still running...
Thread 2 is about to experience an AV exception...
Main Thread is still running...
[...]

- Dmitry Vostokov @ DumpAnalysis.org -