Archive for the ‘Tools’ Category
Saturday, October 23rd, 2010
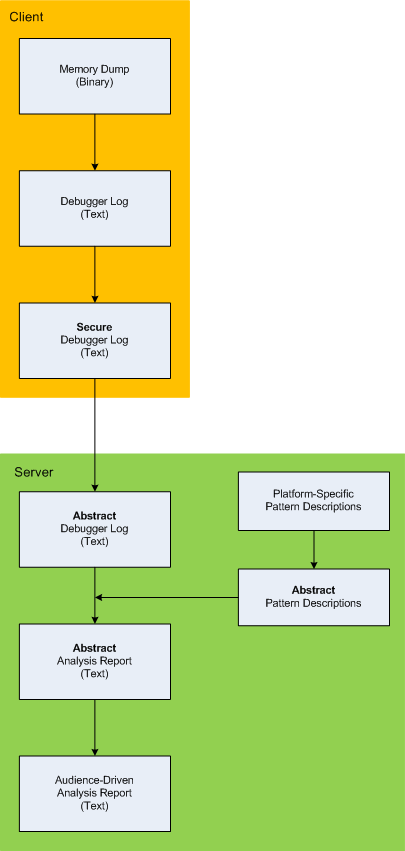
Here is the description of a high-level architecture of the previously announced project CARE (Crash Analysis Report Environment). To remind, the main idea of the project is to process memory dumps on a client to save debugger logs. They can be sent to a server for pattern-driven analysis of software behaviour. Textual logs can also be inspected by a client security team before sending. Certain sensitive information can be excluded or modified to have generic meaning according to the built-in processing rules like renaming (for example, server names and folders). Before processing, verified secured logs are converted to abstract debugger logs. Abstracting platform-specific debugger log format allows reuse of the same architecture for different computer platforms. We call it CIA (Computer Independent Architecture). Do not confuse it with ICA (Independent Computer Architecture) and CIA acronym is more appropriate for memory analysis (like similar MAFIA acronym, Memory Analysis Forensics and Intelligence Architecture). These abstract logs are checked for various patterns (in abstracted form) using abstract debugger commands and an abstract report is generated according to various checklists. Abstract reports are then converted to structured reports for the required audience level. Abstract memory analysis pattern descriptions are prepared from platform-specific pattern descriptions. In certain architectural component deployment configurations both client and server parts can reside on the same machine. Here’s the simple diagram depicting the flow of processing:
- Dmitry Vostokov @ DumpAnalysis.org + TraceAnalysis.org -
Posted in Announcements, Crash Analysis Report Environment (CARE), Crash Dump Analysis, Crash Dump Patterns, Debugging, Memory Analysis Forensics and Intelligence, New Acronyms, Security, Software Architecture, Software Behavior Patterns, Software Technical Support, Structural Memory Patterns, Tools | No Comments »
Friday, October 22nd, 2010
I detour for MARS expedition. You may also call it Memory Analysis Report System as malware analysis is always exploration of memory (in general). Why is this sudden change of course? After reading Gilles Deleuze I want to broaden the concept of “malware” and give it new orientation and direction of thinking. Beside that I also want new challenges after many years of research in pattern-driven memory dump and software trace analysis of abnormal software behaviour.
You may have also noticed small restructuring (rebranding) of this blog and DumpAnalysis.org headers.
See you there 
- Dmitry Vostokov @ DumpAnalysis.org + TraceAnalysis.org -
Posted in Announcements, Archaeology of Computer Memory, Assembly Language, Computer Science, Education and Research, General Memory Analysis, Malware Analysis, Malware Patterns, Memiotics (Memory Semiotics), Memoretics, Memory Analysis Forensics and Intelligence, Memory Analysis Report System, Memory Dump Analysis Services, New Acronyms, Philosophy, Science of Memory Dump Analysis, Science of Software Tracing, Security, Software Trace Analysis, Software Victimology, Structural Memory Patterns, Systems Thinking, Tools, Trace Analysis Patterns, Victimware, Windows System Administration | No Comments »
Wednesday, October 13th, 2010
I now transition to 8 similar to 7-to-8 transition from user to kernel space (new dialectical quality):
switch(years_at_citrix)

{

  case 5:

  write_blog_post(”I’ve just passed 5 year mark … “);

  wait_for_certificate();

  write_blog_post(”Shortly after celebrating 5 years … “);

  break;

  case 6:

  write_blog_post(”Threads in my process run very fast. Not long ago … “);

  break;

  case 7:

  write_blog_post(”Transition to kernel mode and space … “);

  break;

  case 8:

  // … TBD
}
I also abandoned monthly counting started earlier because in kernel space time is counted in clock cycles per quantum unit where the latter is 1/3 of a clock tick (Windows Internals, 5th edition, pp. 406 - 408) :-)
- Dmitry Vostokov @ DumpAnalysis.org + TraceAnalysis.org -
Posted in Announcements, Citrix, Crash Dump Analysis, Debugging, Escalation Engineering, History, Software Architecture, Software Engineering, Software Technical Support, Software Trace Analysis, Tools | No Comments »
Monday, October 11th, 2010
Tool Objects name was motivated by the title of the book Tool and Object: A History and Philosophy of Category Theory that I’m reading:

I realized that troubleshooting can be represented as a category of memory states (or collections of proximate states) as objects and troubleshooting tools as arrows.
We can also consider tools as categories with arrows as troubleshooting actions. In the latter case we can model a collection of tools and transformations (morphisms) between them as a functor.
- Dmitry Vostokov @ DumpAnalysis.org + TraceAnalysis.org -
Posted in Books, Categorical Debugging, History, Mathematics of Debugging, Tool Objects, Tools | No Comments »
Friday, October 8th, 2010
I aim to release a beta version of that unified troubleshooting system together with EasyDbg (as WinDbg add-on) in a few months after finishing porting it to x64 platform. The system is very customizable and similar buttons can be created to launch troubleshooting tools and execute troubleshooting units of work for any client and server applications. It will also be covered in the forthcoming Software Troubleshooting and Debugging Tools presentation.
- Dmitry Vostokov @ DumpAnalysis.org + TraceAnalysis.org -
Posted in Announcements, Debugging, Debugging Methodology, EasyDbg, Escalation Engineering, Memory Dump Analysis Services, Software Technical Support, Tool Objects, Tools, Troubleshooting Methodology | No Comments »
Tuesday, October 5th, 2010
The choice of webinars below mostly reflects my personal preferences and long time desire to speak on topics like systems thinking, troubleshooting tool design and development. The other topic about BSOD minidump analysis was requested by participants in an ongoing survey. There will be more topics in 2011. All forthcoming webinars will be hosted by Memory Dump Analysis Services. The planning list includes:
Systems Thinking in Memory Dump and Software Trace Analysis
Software Troubleshooting and Debugging Tools: Objects, Components, Patterns and Frameworks with UML
- UML basics
- DebugWare patterns
- Unified Troubleshooting Framework
- RADII software development process
- Hands-on exercise: designing and building a tool
Blue Screen Of Death Analysis Done Right: Minidump Investigation for System Administrators
- Making sense of !analyze –v output
- Get extra troubleshooting information with additional WinDbg commands
- Guessing culprits with raw stack analysis
- Who’s responsible: hardware or software?
- Checklist and patterns
- Including hands-on exercises: send your own minidumps
More detailed information will be available soon.
- Dmitry Vostokov @ DumpAnalysis.org + TraceAnalysis.org -
Posted in Announcements, CDF Analysis Tips and Tricks, Common Mistakes, Common Questions, Crash Analysis Report Environment (CARE), Crash Dump Analysis, Crash Dump De-analysis, Crash Dump Patterns, Crash Dumps for Dummies, DebugWare Patterns, Debugging, Debugging Industry, Debugging Methodology, Escalation Engineering, General Memory Analysis, Hermeneutics of Memory Dumps and Traces, Memory Systems Language, Minidump Analysis, Software Architecture, Software Behavior Patterns, Software Engineering, Software Technical Support, Software Trace Analysis, Software Tracing for Dummies, Structural Memory Patterns, Systems Thinking, Tools, Trace Analysis Patterns, Training and Seminars, Troubleshooting Methodology, Vista, Webinars, WinDbg Tips and Tricks, Windows 7, Windows Server 2008, Windows System Administration, x64 Windows | No Comments »
Thursday, September 30th, 2010
Another tool that supports adjoint threading in addition to Citrix CDFAnalyzer (see also Debugging Experts magazine article for pictorial description of this concept) is Process Monitor. We can view adjoint threads having common attributes like TID (ordinary threads), PID, operation (function), process name, etc. by using this right click context menu:
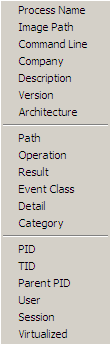
For example, this adjoint thread having RegOpenKey as its ATID (Adjoint Thread ID) where we excluded Path, Result and Detail fields for viewing clarity (together these fields can constitute an analogous Message field in TMF traces):
Time of Day      Process Name PID  TID  Operation

[…]

09:33:25.9545410 Explorer.EXE 1292 1032 RegOpenKey

09:33:25.9548650 Explorer.EXE 1292 1032 RegOpenKey

09:33:25.9550234 Explorer.EXE 1292 1032 RegOpenKey

09:33:25.9551656 Explorer.EXE 1292 1032 RegOpenKey

09:33:25.9692456 WFICA32.EXE  3588 3496 RegOpenKey

09:33:25.9761325 wfcrun32.exe 852  1148 RegOpenKey

09:33:25.9761912 wfcrun32.exe 852  1148 RegOpenKey

09:33:25.9762295 wfcrun32.exe 852  1148 RegOpenKey

09:33:25.9984547 wfcrun32.exe 852  1148 RegOpenKey

09:33:26.0023831 wfcrun32.exe 852  1148 RegOpenKey

09:33:26.0074675 wfcrun32.exe 852  1148 RegOpenKey

09:33:26.0087191 Explorer.EXE 1292 1032 RegOpenKey

09:33:26.1618595 iexplore.exe 1348 2228 RegOpenKey

09:33:26.1625697 iexplore.exe 1348 2228 RegOpenKey

09:33:26.1632745 iexplore.exe 1348 2228 RegOpenKey

09:33:26.1633924 iexplore.exe 1348 2228 RegOpenKey

09:33:26.1639209 iexplore.exe 1348 2228 RegOpenKey

[…]
So if someone writes a converter from TMF to PML format…
- Dmitry Vostokov @ DumpAnalysis.org + TraceAnalysis.org -
Posted in Debugging, Multithreading, New Acronyms, Software Trace Analysis, Software Trace Reading, Tools, Trace Analysis Patterns | No Comments »
Sunday, September 19th, 2010
Finally, after the delay, the issue is available in print on Amazon and through other sellers:
Debugged! MZ/PE: Multithreading

- Dmitry Vostokov @ DumpAnalysis.org + TraceAnalysis.org -
Posted in .NET Debugging, Announcements, CDF Analysis Tips and Tricks, Citrix, Computer Science, Debugged! MZ/PE, Debugging, Memory Dump Analysis Services, Multithreading, Publishing, Science of Software Tracing, Software Trace Analysis, Software Trace Visualization, Tools, Trace Analysis Patterns, WinDbg Tips and Tricks | No Comments »
Friday, September 3rd, 2010
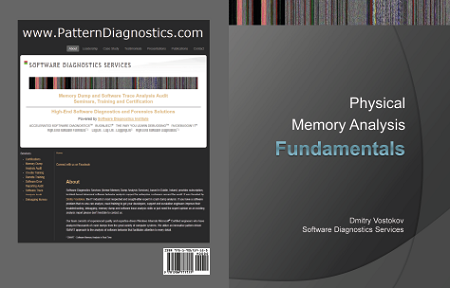
This forthcoming full color book is the complete transcript of a Webinar organized by Memory Dump Analysis Services (www.DumpAnalysis.com).
It discusses user vs. kernel vs. physical (complete) memory space, challenges of complete memory dump analysis, common WinDbg commands, patterns and pattern-driven analysis methodology, common mistakes, fiber bundles, DumpAnalysis.org case studies and illustrates step by step a hands-on exercise in a complete memory dump analysis.
- Title: Fundamentals of Complete Crash and Hang Memory Dump Analysis
- Author: Dmitry Vostokov
- Publisher: OpenTask (October 2010)
- Language: English
- Product Dimensions: 28.0 x 21.6
- Paperback: 48 pages
- ISBN-13: 978-1906717155
- Dmitry Vostokov @ DumpAnalysis.org + TraceAnalysis.org -
Posted in Announcements, Assembly Language, Books, Common Mistakes, Complete Memory Dump Analysis, Crash Analysis Report Environment (CARE), Crash Dump Analysis, Crash Dump Patterns, Debugging, Escalation Engineering, Software Technical Support, Stack Trace Collection, Tools, Training and Seminars, Webinars, WinDbg Tips and Tricks, Windows 7, Windows Server 2008, x64 Windows | No Comments »
Sunday, July 18th, 2010

Memory Dump Analysis Services (DumpAnalysis.com) organizes a free webinar
Date: 18th of August 2010
Time: 21:00 (BST) 16:00 (Eastern) 13:00 (Pacific)
Duration: 90 minutes
Topics include:
- User vs. kernel vs. physical (complete) memory space
- Challenges of complete memory dump analysis
- Common WinDbg commands
- Patterns
- Common mistakes
- Fiber bundles
- Hands-on exercise: a complete memory dump analysis
- A guide to DumpAnalysis.org case studies
Prerequisites: working knowledge of basic user process and kernel memory dump analysis or live debugging using WinDbg
The webinar link will be posted before 18th of August on DumpAnalysis.com
- Dmitry Vostokov @ DumpAnalysis.org + TraceAnalysis.org -
Posted in Announcements, Common Mistakes, Common Questions, Complete Memory Dump Analysis, Crash Dump Analysis, Crash Dump Patterns, Debugging, Escalation Engineering, Memory Dump Analysis Services, Pattern Models, Security, Software Architecture, Software Behavior Patterns, Software Defect Construction, Software Engineering, Software Technical Support, Stack Trace Collection, Testing, Tools, Training and Seminars, Troubleshooting Methodology, Virtualization, Vista, Webinars, WinDbg Scripts, WinDbg Tips and Tricks, Windows 7, Windows Server 2008, Windows System Administration, x64 Windows | 1 Comment »
Sunday, July 11th, 2010
Our future sponsor has been registered in Ireland and has its own independent website and logo: DumpAnalysis.com

More information will be available later this month.
- Dmitry Vostokov @ DumpAnalysis.org + TraceAnalysis.org -
Posted in Announcements, Crash Analysis Report Environment (CARE), Crash Dump Analysis, Crash Dump De-analysis, Debugging, Education and Research, Escalation Engineering, Hardware, Kernel Development, Linux Crash Corner, Mac Crash Corner, Memory Analysis Forensics and Intelligence, Memory Dump Analysis Services, Minidump Analysis, Security, Software Engineering, Software Technical Support, Software Trace Analysis, Testing, Tools, Training and Seminars, Vista, Windows 7, Windows Server 2008, Windows System Administration, x64 Windows | No Comments »
Monday, June 21st, 2010
I was looking for Wordpress plugins to display past year (two-, three-, etc.) old posts and after a few tries decided to create such posts manually to add fresh perspective and new comments on them (in italics). Today we start with June 21st.
2009:
• Debugalov has been burnt! - The book still sells every month and I’m now thinking about a hardcover gift edition. The cover fascinates many people, see for example this review: Book Review - The Adventures of Dr Debugalov. Now we also have Dr. DebugLove. Who is a good and who is a bad guy? Or is it a personality split?
2008:
No dumps on that day
2007:
Looks like the very prolific day. There were 3 blog posts:
• Crash Dump Analysis Patterns (Part 16a) - Stack overflow in kernel. Generated some comments and can also be seen in the following pattern case study: Lateral damage, stack overflow and execution residue
• Repair Clipboard Chain 2.0.1 - One of the most popular Citrix tool in the past
• Guessing stack trace - This old command still works for x86 WinDbg and x86 memory dumps
- Dmitry Vostokov @ DumpAnalysis.org + TraceAnalysis.org -
Posted in Art, Books, Cartoons, Crash Dump Analysis, Crash Dump Patterns, Debugging, Old Mental Dumps, Tools, WinDbg Tips and Tricks | No Comments »
Wednesday, June 16th, 2010
Adding AI. Analysis Improvement.
After reading earlier today Windows Internals pages about system audit an idea came to my mind in the evening to provide audit services for memory dump and software trace analysis. One mind is good but two are better, especially if the second is a pattern-driven AI. Here are possible problem scenarios:
Problem: You are not satisfied with a crash report.
Problem: Your critical issue is escalated to the VP level. Engineers analyze memory dumps and software traces. No definite conclusion so far. You want to be sure that nothing has been omitted from the analysis.
Problem: You analyze a system dump or a software trace. You need a second pair of eyes but don’t want to send your memory dump due to your company security policies.
Other scenarios (use cases) will be added as soon as I see the service fit to the realities of software technical support.
I plan to make this service operational in July - August, 2010. Prices to be announced soon.
- Dmitry Vostokov @ DumpAnalysis.org + TraceAnalysis.org -
Posted in .NET Debugging, Announcements, Common Mistakes, Complete Memory Dump Analysis, Crash Analysis Report Environment (CARE), Crash Dump Analysis, Crash Dump De-analysis, Crash Dump Patterns, Debugging, Escalation Engineering, Minidump Analysis, Software Behavior Patterns, Software Engineering, Software Technical Support, Software Trace Analysis, Software Troubleshooting Patterns, Tools, Trace Analysis Patterns | 1 Comment »
Wednesday, June 2nd, 2010
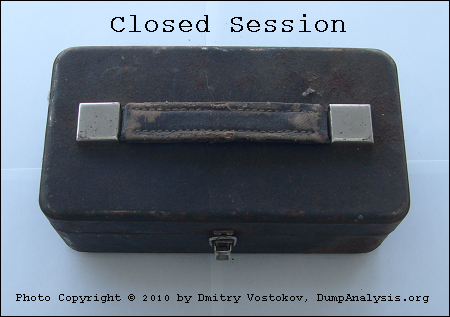
This paleodebugging tool was excavated from Central Russia (thanks to Mr. Kutuzov) and generously provided for a photo session by its owner Mr. Mansour:
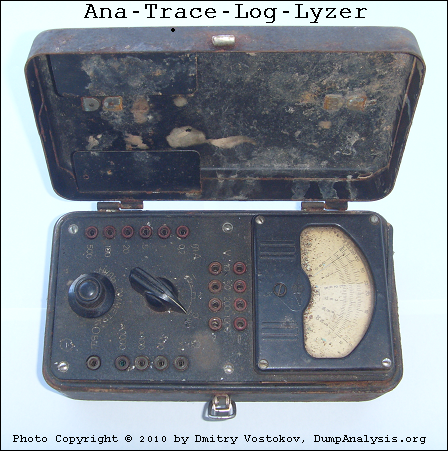
It also inspired this sequence of strcat: Analog -> Anatrace -> Analyzer -> Tracelyzer -> Loglyzer.
… enough tracing. It’s time to close our session:
… what is left? If you are curious, look at this conceptual picture:
Component Trace
If you wonder what electricity has to do with tracing (at a metaphorical level) look at this trace analysis pattern:
Statement Density and Current
- Dmitry Vostokov @ DumpAnalysis.org + TraceAnalysis.org -
Posted in Archaeology of Computer Memory, Art, Debugging, Fun with Software Traces, History, New Words, Paleo-debugging, Physicalist Art, Software Trace Analysis, Testing, Tools, Trace Analysis Patterns | No Comments »
Sunday, May 30th, 2010
Finally, after careful consideration, I’ve come up with the topic that has been neglected so far but at the same time important for both camps (kernel space and user space, including managed space): complete memory dump and software trace analysis. I plan to publish the first webinar agenda early in July and deliver the webinar in August (the date should be finalized by mid July).
PS. Sailing memory spaces under an RGB flag

- Dmitry Vostokov @ DumpAnalysis.org + TraceAnalysis.org -
Posted in Announcements, CDF Analysis Tips and Tricks, Crash Analysis Report Environment (CARE), Crash Dump Analysis, Crash Dump Patterns, Debugging, DumpAnalysis and TraceAnalysis Logos, Escalation Engineering, Software Behavior Patterns, Software Technical Support, Software Trace Analysis, Software Troubleshooting Patterns, Tools, Trace Analysis Patterns, Training and Seminars, WinDbg Scripts, WinDbg Tips and Tricks | 2 Comments »
Tuesday, May 25th, 2010
Finally Citrix has published a tool (written by my colleague Colm Naish, lead escalation engineer) that allows controlled injection of events into CDF (ETW) trace message stream. This is useful in many troubleshooting scenarios where we need to rely on Significant Event and Anchor Message analysis patterns to partition traces into artificial Activity Regions to start our analysis with. This is also analogous for the imposition of the external time on the stream of tracing events from software narratology perspective:
CDFMarker On Demand - For XenApp and XenDesktop
- Dmitry Vostokov @ DumpAnalysis.org + TraceAnalysis.org -
Posted in Announcements, CDF Analysis Tips and Tricks, Citrix, Debugging, Escalation Engineering, Software Engineering, Software Narratology, Software Technical Support, Software Trace Analysis, Software Trace Reading, Tools, Trace Analysis Patterns | 1 Comment »
Thursday, May 6th, 2010
Some recent news about StressPrinters tool designed according to Tool Façade DebugWare pattern:
“HP tests its print drivers with the StressPrinters tool provided by Citrix to simulate a user logon where multiple printers are autocreated concurrently.”
Source
- Dmitry Vostokov @ DumpAnalysis.org + TraceAnalysis.org -
Posted in Citrix, DebugWare Patterns, Debugging, Testing, Tools | No Comments »
Monday, May 3rd, 2010
Modern pattern-driven software trace analysis on Microsoft and Citrix platforms urgently requires a practical guide and OpenTask plans to publish this summer the following book in both Practical Foundations and Systematic Software Fault Analysis series:
- Title: Citrix Common Diagnostic Facility (CDF) and Microsoft Event Tracing for Windows (ETW) Software Trace Analysis: Practical Foundations
- Author: Dmitry Vostokov
- Publisher: Opentask (August 2010)
- Language: English
- Product Dimensions: 22.86 x 15.24
- ISBN: 1906717176
- ISBN-13: 978-1906717179
- Paperback: 200 pages
- Dmitry Vostokov @ DumpAnalysis.org + TraceAnalysis.org -
Posted in Announcements, Books, Citrix, Escalation Engineering, Publishing, Software Engineering, Software Technical Support, Software Trace Analysis, Software Tracing for Dummies, Testing, Tools, Trace Analysis Patterns, Training and Seminars, Windows System Administration | No Comments »
Sunday, May 2nd, 2010
It is time to start being systematic. In addition to all-encompassing multi-volume Memory Dump Analysis Anthology OpenTask starts Systematic Software Fault Analysis series with Crash Dump Analysis: Practical Foundations as the first book. It introduces basic definitions, tools, memory dump collection and preliminary analysis methods for Windows platforms including legacy versions. This practical reference guide is a must have for system administrators of Windows server platforms and client workstations, technical support engineers and general Windows users. It builds foundation for the second book Crash Dump Analysis for System Administrators and Support Engineers and the remaining tetralogy books Windows Crash Dump Analysis and Advanced Windows Crash Dump Analysis.
Product information:
- Title: Crash Dump Analysis: Practical Foundations (Windows Edition, Systematic Software Fault Analysis Series)
- Authors: Dmitry Vostokov
- Publisher: Opentask (May 2010)
- Language: English
- Product Dimensions: 22.86 x 15.24
- ISBN-13: 978-1-906717-98-8
- Paperback: 100 pages
Fromt cover:
Table of Contents to be published soon.
- Dmitry Vostokov @ DumpAnalysis.org + TraceAnalysis.org -
Posted in Announcements, Books, Crash Dump Analysis, Crash Dumps for Dummies, Escalation Engineering, Publishing, Software Technical Support, Tools, Windows System Administration | No Comments »
Thursday, April 29th, 2010
Yesterday I discovered the blog j00ru//vx where I was pleased to see another memory visualization approach which I classify as synthetic:
x86 Kernel Memory Space Visualization (KernelMAP v0.0.1)
So far now I put a bit more extended (but in no way complete) classification with links (based on my previous blog post where every category is presented in chronological order of my encounter with links):
1. Synthetic
2. Natural
a. Static
b. Semi-dynamic
c. Dynamic
Please let me know any other approaches or links you know.
PS. I’m currently a big fan of artificial evolution and recommend this fantastic full-color book that has good ideas about expression-based visualization:
The Art of Artificial Evolution: A Handbook on Evolutionary Art and Music (Natural Computing Series)

- Dmitry Vostokov @ DumpAnalysis.org + TraceAnalysis.org -
Posted in Books, Computer Science, Evolution, Memory Space Art, Memory Visualization, Tools | 2 Comments »