DebugWare Patterns (Part 2)
Sponsored link: Memory Dump Analysis Services
Debugging Experts Magazine Online
Next pattern is called
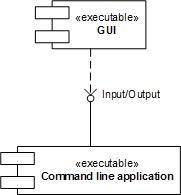
Tool Façade (or Tool Facade)
It is used when there is a tool with a cumbersome interface like command line with many options and there is a need for a better and easier to use interface, for example, GUI. This can be illustrated on the following UML component diagram:

Excellent example of this pattern is:
designed as a GUI wrapper around command line tool AddPrinter. Adding the powerful GUI interface allowed to extend its functionality and even find new domains, like testing, where the tool can be used. Excellent information about this tool can be found in the article:
Understanding and using Citrix StressPrinters
- Dmitry Vostokov @ DumpAnalysis.org -
_1125.png)
Museum of Debugging and Memory Dumps
7/7/2010 - 8/8/2010 Annual Competition: Tell Your Windows Debugging Story
Crash and Hang Analysis Audit Service
CARE: Crash Analysis Report Environment
Crash Dump and Software Trace Analysis Training and Seminars
Access OpenTask Titles on Safari Books Online
DATA (Dump Analysis + Trace Analysis) Facebook group
Please join the community of memory (dump) and trace analysis engineers. This group promotes scientific methods and memory dump-based worldview.
Twitter @ DumpAnalysis You can now follow portal and blog news at DumpAnalysis on Twitter
LinkedIn Group Dr. Watson Enthusiasts All about Dr. Watson errors and more. Get news, excerpts and progress reports about the forthcoming book The Science of Dr. Watson: An Illustrated History of Debugging (ISBN 978-1906717070)
2010 (0x7DA) - The Year of Dump Analysis 2011 (0x7DB) - 2020 (0x7E4) The Debugging Decade
International Memory Analysts and Debuggers Day: 07.07 and/or 08.08 starting from The Year of Dump Analysis, 2010, 7DA
AnnouncementsComing Soon:
Management Bits: An Anthology from Reductionist Manager
Debugging Notebook: Essential Concepts, WinDbg Commands and Tools
Crash Dump Analysis for System Administrators and Support Engineers
New Magazines:
Debugged! MZ/PE: MagaZine for/from Practicing Engineers
New Books:
Memory Dump Analysis Anthology: Color Supplement for Volumes 1-3
Memory Dump Analysis Anthology, Volume 3
First Fault Software Problem Solving: A Guide for Engineers, Managers and Users
x64 Windows Debugging: Practical Foundations
Also available:
Windows Debugging: Practical Foundations
DLL List Landscape: The Art from Computer Memory Space
Dumps, Bugs and Debugging Forensics: The Adventures of Dr. Debugalov
WinDbg: A Reference Poster and Learning Cards
Memory Dump Analysis Anthology, Volume 2
Memory Dump Analysis Anthology, Volume 1
New Children's Book:


July 30th, 2008 at 6:34 pm
New version of StressPrinters tool is available:
StressPrinters 1.3.2
August 10th, 2008 at 3:47 pm
[…] or when CUI interface was developed earlier and we don’t want to touch tool code (see Tool Façade pattern). Therefore this common pattern is called Dual Interface. Some tool […]
October 30th, 2009 at 4:23 pm
[…] problem. Would we start with GUI? Most tools are command line tools and we therefore choose Tool Façade pattern to decouple GUI from […]
May 6th, 2010 at 5:09 pm
[…] recent news about StressPrinters tool designed according to Tool Façade DebugWare […]