Archive for the ‘Tools’ Category
Tuesday, April 20th, 2010
The following tool published by Citrix follows DebugWare patterns in its overall architecture and design and was implemented by a team of engineers using RADII process:
SsOnExpert - Single Sign-On XenApp Plug-in Troubleshooting Tool
- Dmitry Vostokov @ DumpAnalysis.org + TraceAnalysis.org -
Posted in Announcements, Citrix, DebugWare Patterns, Debugging, Debugging Methodology, Escalation Engineering, Software Architecture, Software Engineering, Software Maintenance Institute, Software Technical Support, Tools, Troubleshooting Methodology | No Comments »
Sunday, April 18th, 2010
OpenTask to offer first 3 volumes of Memory Dump Analysis Anthology in one set:


The set is available exclusively from OpenTask e-Commerce web site starting from June. Individual volumes are also available from Amazon, Barnes & Noble and other bookstores worldwide.
Product information:
- Title: Modern Memory Dump and Software Trace Analysis: Volumes 1-3
- Author: Dmitry Vostokov
- Language: English
- Product Dimensions: 22.86 x 15.24
- Paperback: 1600 pages
- Publisher: Opentask (31 May 2010)
- ISBN-13: 978-1-906717-99-5
Information about individual volumes:
- Dmitry Vostokov @ DumpAnalysis.org + TraceAnalysis.org -
Posted in .NET Debugging, Aesthetics of Memory Dumps, Announcements, AntiPatterns, Art, Assembly Language, Books, Bugchecks Depicted, C and C++, CDA Pattern Classification, CDF Analysis Tips and Tricks, Categorical Debugging, Certification, Citrix, Code Reading, Common Mistakes, Computational Ghosts and Bug Hauntings, Computer Science, Countefactual Debugging, Crash Analysis Report Environment (CARE), Crash Dump Analysis, Crash Dump Patterns, Crash Dumps for Dummies, Data Recovery, DebugWare Patterns, Debugging, Debugging Methodology, Debugging Slang, Deep Down C++, Dictionary of Debugging, Dr. Watson, Education and Research, Escalation Engineering, Fun with Crash Dumps, Futuristic Memory Dump Analysis, GDB for WinDbg Users, Hardware, History, Horrors of Computation, Hyper-V, Intelligent Memory Movement, Kernel Development, Laws of Troubleshooting and Debugging, Mathematics of Debugging, Memiotics (Memory Semiotics), Memoidealism, Memoretics, Memory Analysis Culture, Memory Analysis Forensics and Intelligence, Memory Auralization, Memory Dump Analysis Jobs, Memory Religion (Memorianity), Memory Space Art, Memory Space Music, Memory Systems Language, Memory Visualization, Memuonics, Minidump Analysis, Multithreading, Music for Debugging, Music of Computation, New Acronyms, New Words, Occult Debugging, Philosophy, Psi-computation, Publishing, Science of Memory Dump Analysis, Science of Software Tracing, Security, Software Architecture, Software Defect Construction, Software Engineering, Software Generalist, Software Maintenance Institute, Software Narratology, Software Technical Support, Software Trace Analysis, Software Trace Visualization, Software Tracing for Dummies, Software Victimology, Stack Trace Collection, Testing, Tools, Trace Analysis Patterns, Training and Seminars, Troubleshooting Methodology, Victimware, Virtualization, Vista, Visual Dump Analysis, WinDbg Scripts, WinDbg Tips and Tricks, WinDbg for GDB Users, Windows 7, Windows Server 2008, Windows System Administration | No Comments »
Tuesday, April 13th, 2010
Do you see my thread of thought? Tender ≈ easily crushed, so a tender button can easily crash or can be easily cr(a)ushed. When I saw the title of a book “Tender Buttons” I immediately recalled TestDefaultDebugger and similar programs. Apartment is from COM lexicon.
Tender buttons that crash: objects, messages, apartments.
Gertrude Stein, The Tender buttons: objects, food, rooms
- Dmitry Vostokov @ DumpAnalysis.org + TraceAnalysis.org -
Posted in Bugtations, Crash Dump Analysis, Debugging, Fun with Crash Dumps, Tools | No Comments »
Tuesday, April 13th, 2010
.SYS - Sponsor YourSelf or Sponsor YourSelves.
Examples: I’m developing a fantastic project.SYS
- Dmitry Vostokov @ DumpAnalysis.org + TraceAnalysis.org -
Posted in Debugging Slang, Escalation Engineering, Software Engineering, Software Technical Support, Tools | No Comments »
Friday, April 9th, 2010
Plan to start providing training and seminars in my free time. If you are interested please answer these questions (you can either respond here in comments or use this form for private communication http://www.dumpanalysis.org/contact):
- Are you interested in on-site training, prefer traveling or attending webinars?
- Are you interested in software trace analysis as well?
- What specific topics are you interested in?
- What training level (beginner, intermediate, advanced) are you interested in? (please provide an example, if possible)
Additional topics of expertise that can be integrated into training include Source Code Reading and Analysis, Debugging, Windows Architecture, Device Drivers, Troubleshooting Tools Design and Implementation, Multithreading, Deep Down C and C++, x86 and x64 Assembly Language Reading.
Looking forward to your responses. Any suggestions are welcome.
- Dmitry Vostokov @ DumpAnalysis.org + TraceAnalysis.org -
Posted in .NET Debugging, Announcements, AntiPatterns, Assembly Language, Bugchecks Depicted, C and C++, CDA Pattern Classification, CDF Analysis Tips and Tricks, Certification, Code Reading, Common Mistakes, Crash Analysis Report Environment (CARE), Crash Dump Analysis, Crash Dump Patterns, Crash Dumps for Dummies, Data Recovery, DebugWare Patterns, Debugging, Debugging Methodology, Deep Down C++, Education and Research, Escalation Engineering, FreeBSD Crash Corner, GDB for WinDbg Users, Hardware, Hyper-V, Java Debugging, Kernel Development, Laws of Troubleshooting and Debugging, Linux Crash Corner, Mac Crash Corner, Memory Analysis Forensics and Intelligence, Memory Visualization, Minidump Analysis, Multithreading, Security, Software Architecture, Software Defect Construction, Software Engineering, Software Generalist, Software Maintenance Institute, Software Narratology, Software Technical Support, Software Trace Analysis, Software Trace Visualization, Software Tracing for Dummies, Software Victimology, Stack Trace Collection, Testing, Tools, Trace Analysis Patterns, Training and Seminars, Troubleshooting Methodology, Victimware, Virtualization, Vista, Visual Dump Analysis, WinDbg Scripts, WinDbg Tips and Tricks, WinDbg for GDB Users, Windows 7, Windows Server 2008, Windows System Administration, Workaround Patterns | No Comments »
Thursday, April 8th, 2010
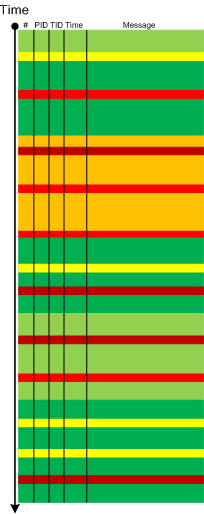
Metaphorical bijection from literary narratology to software narratology provides a pattern of Background and Foreground Components. This can be easily illustrated on pseudo-trace color diagrams. Suppose we troubleshoot a graphical issue using an ETW trace containing the output from all components of the problem system. Graphic components and their messages are foreground for a trace viewer (a person) against numerous background components (for example, database, file and registry access, shown in shades of green):
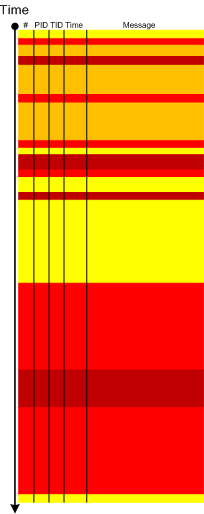
Trace viewers (for example, CDFAnalyzer) can filter out background component messages and present only foreground components (that I propose to call component foregrounding):
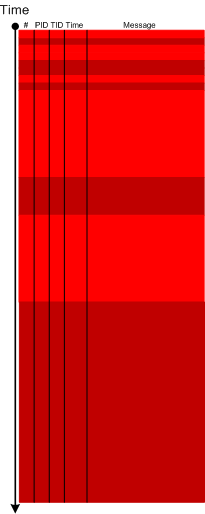
Of course, this process is iterative and parts of what once was foreground become background and candidates for further filtering:
- Dmitry Vostokov @ DumpAnalysis.org + TraceAnalysis.org -
Posted in CDF Analysis Tips and Tricks, Citrix, Debugging, Software Narratology, Software Trace Analysis, Software Trace Visualization, Tools, Trace Analysis Patterns | 2 Comments »
Thursday, April 8th, 2010
This is a new open source tool similar to PDBFinder in functionality but with much simpler interface and internal implementation (based on the file name structure of the certain classes of TMF files for ETW). To be released this month on TraceAnalysis.org.
- Dmitry Vostokov @ DumpAnalysis.org + TraceAnalysis.org -
Posted in CDF Analysis Tips and Tricks, Citrix, Debugging, Escalation Engineering, Software Technical Support, Software Trace Analysis, Tools | No Comments »
Monday, April 5th, 2010
I’m very pleased to announce that the Korean edition is available:

The book can be found on:
- Dmitry Vostokov @ DumpAnalysis.org + TraceAnalysis.org -
Posted in Announcements, AntiPatterns, Assembly Language, Books, Books (Korean), C and C++, Computer Science, Crash Dump Analysis, Crash Dump Patterns, Crash Dumps for Dummies, Debugging, Dr. Watson, Escalation Engineering, Fun with Crash Dumps, GDB for WinDbg Users, Hardware, Kernel Development, Mathematics of Debugging, Memiotics (Memory Semiotics), Memoretics, Memory Space Music, Memory Visualization, Minidump Analysis, Multithreading, Publishing, Science of Memory Dump Analysis, Security, Software Architecture, Software Engineering, Software Technical Support, Testing, Tools, Troubleshooting Methodology, Virtualization, Vista, WinDbg Scripts, WinDbg Tips and Tricks, WinDbg for GDB Users, Windows Server 2008, Windows System Administration | No Comments »
Saturday, February 27th, 2010
This post was motivated during my work on a memory dump differing tool called DumpLogic that can do logical and arithmetic operations between memory snapshots, for example, take a difference between them for further visualization. This tool is forthcoming next week and it resulted in another simple tool called DumpFilter. The latter allows to filter certain unsigned integer (DWORD) values from a memory dump (or any binary file) by replacing them with 0xFFFFFFFF and all other values with 0×00000000. The resultant binary file can be visualized by any data visualization package or transformed to a bitmap file using Dump2Picture to see distribution of filtered values.
As a filtering example I used TestDefaultDebugger64 to generate a process user memory dump. It was converted to a BMP file by Dump2Picture:

Then I filtered only AV exception code 0xc0000005:
C:\>DumpFilter tdd64.dmp tdd64.bin <dwords.txt
dwords.txt just contained one line
c0000005
It is possible to filter many values. Just put more lines to dwords.txt file. tdd64.bin was converted to tdd64.bmp by Dump2Picture:
C:\>Dump2Picture tdd64.bin tdd64.bmp
Because the image had only black and while RGBA colors I saved it as a B/W bitmap (click to enlarge, it is a 3236×3236 1.3Mb bitmap):

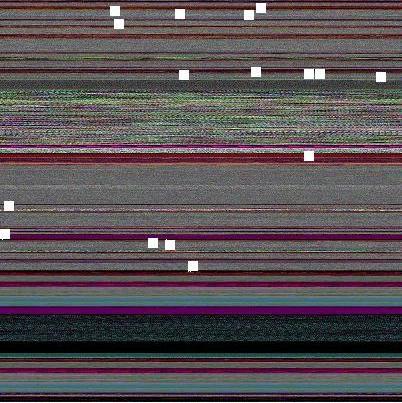
Every EV exception code is a white dot there but it is difficult to see them unless magnified. So I enlarged them manually on the following map:

I put them on the original image too. We can see that exception processing spans many areas:
The tool and the sample dwords.txt file (for c0000005 and 80000003) can be downloaded from this location:
Download DumpFilter
Another example: Night Sky memory space art image is just a fragment after filtering all 1 values from another process memory dump.
- Dmitry Vostokov @ DumpAnalysis.org + TraceAnalysis.org -
Posted in Crash Dump Analysis, Crash Dump Patterns, Fun with Crash Dumps, Memoretics, Memory Visualization, Science of Memory Dump Analysis, Tools | No Comments »
Monday, February 22nd, 2010
As soon as I dug out the 3rd edition of this book to download samples for my internal projects I found that the new edition was published this month! I read all of them and now ordering the 4th edition:
Windows System Programming (4th Edition)

Actually I re-read the 2nd edition of Johnson M. Hart’s book when looking for a job in 2003 and coupled with timely reading of John Robbings’ book Debugging Applications (1st 2000 edition) secured my landing in Dublin East Point Business Park.
This book is an essential reading for Windows memory dump analysts, software maintenance and escalation engineers, software defect researchers and software tool developers. It lucidly describes and succinctly illustrates user-land Windows API with practical console mode samples in plain C. This book is especially valuable for software engineers coming from UNIX background because the author draws various parallels and provides maps between UNIX / Pthreads and Win32 / 64 APIs. Highly recommended! Plan to post an Amazon review when I get the copy of the 4th edition.
- Dmitry Vostokov @ DumpAnalysis.org + TraceAnalysis.org -
Posted in Books, C and C++, Citrix, Code Reading, Debugging, History, Tools, Vista, Windows 7, Windows Server 2008 | No Comments »
Thursday, February 11th, 2010
This is a revised, edited, cross-referenced and thematically organized volume of selected DumpAnalysis.org blog posts about crash dump analysis and debugging written in July 2009 - January 2010 for software engineers developing and maintaining products on Windows platforms, quality assurance engineers testing software on Windows platforms and technical support and escalation engineers dealing with complex software issues. The fourth volume features:
- 13 new crash dump analysis patterns
- 13 new pattern interaction case studies
- 10 new trace analysis patterns
- 6 new Debugware patterns and case study
- Workaround patterns
- Updated checklist
- Fully cross-referenced with Volume 1, Volume 2 and Volume 3
- New appendixes
Product information:
- Title: Memory Dump Analysis Anthology, Volume 4
- Author: Dmitry Vostokov
- Language: English
- Product Dimensions: 22.86 x 15.24
- Paperback: 410 pages
- Publisher: Opentask (30 March 2010)
- ISBN-13: 978-1-906717-86-5
- Hardcover: 410 pages
- Publisher: Opentask (30 April 2010)
- ISBN-13: 978-1-906717-87-2

Back cover features memory space art image: Internal Process Combustion.
- Dmitry Vostokov @ DumpAnalysis.org + TraceAnalysis.org -
Posted in .NET Debugging, Aesthetics of Memory Dumps, Announcements, AntiPatterns, Art, Assembly Language, Books, C and C++, CDA Pattern Classification, CDF Analysis Tips and Tricks, Categorical Debugging, Certification, Citrix, Code Reading, Common Mistakes, Computer Science, Countefactual Debugging, Crash Analysis Report Environment (CARE), Crash Dump Analysis, Crash Dump Patterns, Crash Dumps for Dummies, DebugWare Patterns, Debugging, Debugging Slang, Education and Research, Escalation Engineering, Fun with Crash Dumps, Games for Debugging, Hardware, Horrors of Computation, Hyper-V, Kernel Development, Laws of Troubleshooting and Debugging, Mathematics of Debugging, Memiotics (Memory Semiotics), Memoidealism, Memoretics, Memory Analysis Culture, Memory Analysis Forensics and Intelligence, Memory Dreams, Memory Dump Analysis Jobs, Memory Dumps in Movies, Memory Space Art, Memory Visualization, Memuonics, Minidump Analysis, Multithreading, Music for Debugging, New Acronyms, New Words, Opcodism, Philosophy, Physicalist Art, Publishing, Science Fiction, Science of Memory Dump Analysis, Science of Software Tracing, Security, Software Architecture, Software Defect Construction, Software Engineering, Software Generalist, Software Maintenance Institute, Software Narratology, Software Technical Support, Software Trace Analysis, Software Trace Visualization, Software Tracing for Dummies, Software Victimology, Stack Trace Collection, Testing, Tools, Trace Analysis Patterns, Training and Seminars, Troubleshooting Methodology, Victimware, Virtualization, Vista, Visual Dump Analysis, WinDbg Scripts, WinDbg Tips and Tricks, WinDbg for GDB Users, Windows 7, Windows Server 2008, Windows System Administration, Workaround Patterns | No Comments »
Monday, January 25th, 2010
Another workaround pattern for some problems is to freeze a process responsible for an annoying or excessive activity like in the case study: Debugger as a Shut Up Application. We can also use other tools for this purpose like Mark Russinovich’s PsSuspend. The suitable name for this pattern is Frozen Process.
- Dmitry Vostokov @ DumpAnalysis.org + TraceAnalysis.org -
Posted in Debugging, Software Technical Support, Tools, Troubleshooting Methodology, Workaround Patterns | 1 Comment »
Sunday, January 24th, 2010
After fighting HTML comments in Safari and Chrome (see the case study below) I came to an idea to name and catalog workaround patterns in troubleshooting and debugging. The first one is called Hidden Output. Sometimes we can just remove message boxes reporting minor problems and generating unnecessary support calls by hiding their windows, for example, by using CtxHideEx32. A different example is what I did today when troubleshooting Amazon aStore widget HTML code. It worked well in IE8:
However, in Apple Safari and Google Chrome the widget code was visible at the top of the page:
After a few unsuccessful attempts to debug the problem and faced with other pressing tasks I got a flash in my mind to hide the visible code by changing its color to be the same as its background:
<font color=”D3E7F4″><script type=”text/javascript”><!–

amazon_ad_tag=”crasdumpanala-20″;

amazon_ad_width=”728″;

amazon_ad_height=”90″;

amazon_color_background=”D3E7F4″;

amazon_color_border=”0000FF”;

amazon_color_logo=”FFFFFF”;

amazon_color_link=”0000FF”;

amazon_ad_logo=”hide”;

amazon_ad_link_target=”new”;

amazon_ad_border=”hide”;

amazon_ad_title=”OpenTask Books, Magazines and Notebooks”; //–></script>

<script type=”text/javascript” src=”http://www.assoc-amazon.com/s/asw.js”></script></font>
After that the picture became nicer:
- Dmitry Vostokov @ DumpAnalysis.org + TraceAnalysis.org -
Posted in Citrix, Debugging, Software Technical Support, Tools, Troubleshooting Methodology, Workaround Patterns | 1 Comment »
Sunday, December 20th, 2009
“Memory dumps are facts.”
I’m very excited to announce that Volume 3 is available in paperback, hardcover and digital editions:
Memory Dump Analysis Anthology, Volume 3
Table of Contents
In two weeks paperback edition should also appear on Amazon and other bookstores. Amazon hardcover edition is planned to be available in January 2010.
The amount of information was so voluminous that I had to split the originally planned volume into two. Volume 4 should appear by the middle of February together with Color Supplement for Volumes 1-4.
- Dmitry Vostokov @ DumpAnalysis.org -
Posted in .NET Debugging, Aesthetics of Memory Dumps, Announcements, AntiPatterns, Art, Assembly Language, Books, Bugtations, C and C++, CDA Pattern Classification, CDF Analysis Tips and Tricks, Certification, Citrix, Code Reading, Common Mistakes, Computer Science, Crash Dump Analysis, Crash Dump Patterns, Crash Dumps for Dummies, DebugWare Patterns, Debugging, Debugging Slang, Deep Down C++, Education and Research, Escalation Engineering, Fun with Crash Dumps, Hardware, Horrors of Computation, Kernel Development, Mathematics of Debugging, Memiotics (Memory Semiotics), Memoidealism, Memoretics, Memory Analysis Culture, Memory Analysis Forensics and Intelligence, Memory Space Art, Memory Visualization, Minidump Analysis, Multithreading, Philosophy, Poetry, Publishing, Science of Memory Dump Analysis, Science of Software Tracing, Security, Software Architecture, Software Defect Construction, Software Engineering, Software Narratology, Software Technical Support, Software Trace Analysis, Software Trace Visualization, Software Tracing for Dummies, Software Victimology, Stack Trace Collection, Testing, Tools, Trace Analysis Patterns, Training and Seminars, Troubleshooting Methodology, Victimware, Virtualization, Vista, Visual Dump Analysis, WinDbg Scripts, WinDbg Tips and Tricks, WinDbg for GDB Users, Windows 7, Windows Server 2008, Windows System Administration | 1 Comment »
Wednesday, December 16th, 2009
Finally, after the long delay, the issue is available in print on Amazon and through other sellers:
Debugged! MZ/PE: Software Tracing
- Dmitry Vostokov @ DumpAnalysis.org -
Posted in Announcements, Books, CDF Analysis Tips and Tricks, Computer Science, Crash Dump Analysis, Crash Dump Patterns, Debugged! MZ/PE, Debugging, Education and Research, Fun with Crash Dumps, Memoretics, Memory Visualization, Publishing, Science of Memory Dump Analysis, Science of Software Tracing, Software Technical Support, Software Trace Analysis, Software Trace Visualization, Testing, Tools, Trace Analysis Patterns, Training and Seminars, Troubleshooting Methodology, Visual Dump Analysis | 1 Comment »
Wednesday, December 9th, 2009
In its simplest form the first law of troubleshooting and debugging states that:
The more frequent a problem is, the simpler tool is needed to resolve and fix it.
- Dmitry Vostokov @ DumpAnalysis.org -
Posted in Announcements, Bugtations, DebugWare Patterns, Debugging, Laws of Troubleshooting and Debugging, Software Technical Support, Tools, Troubleshooting Methodology | No Comments »
Wednesday, December 9th, 2009
I’m very pleased to announce that Dan Skwire’s unique book has been published by OpenTask:
First Fault Software Problem Solving: A Guide for Engineers, Managers and Users
- Dmitry Vostokov @ DumpAnalysis.org -
Posted in Announcements, Books, Escalation Engineering, First Fault Problem Solving, Publishing, Software Engineering, Software Technical Support, Tools, Troubleshooting Methodology | 1 Comment »
Wednesday, October 28th, 2009
Support tools can be packaged for delivery as (not counting optional separate readme and EULA files):
- - A raw collection of modules
- - A single installation package
- - A single archived file
- - A single self-extractable component
The latter common packaging choice is a pattern itself that I call Self Extractor. Typical examples include sysinternals tools like Process Monitor. Here is a simple unorthodox UML diagram for a single platform tool combining elements from static and component diagrams to illustrate component embedding (not sharing):
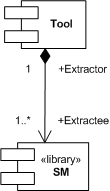
SM is a supporting module, for example, a driver, to carry out some task or receive notifications.
Some tools even extract different components depending on the processor architecture, for example, x86 and x64. This is illustrated on a more elaborate UML diagram:
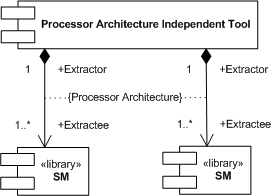
The typical example would be a backward compatible x86 Extractor that extracts an x64 driver (Extractee) for an x64 OS kernel that doesn’t load x86 drivers.
- Dmitry Vostokov @ DumpAnalysis.org -
Posted in DebugWare Patterns, Debugging, Software Architecture, Software Engineering, Software Technical Support, Tools | 2 Comments »
Wednesday, October 21st, 2009
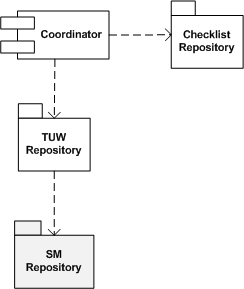
The domain of some troubleshooting and debugging tools sometimes spans several computers, for example, a client, a server, and a middleware server (or a frontware server like a web server). Because such tools are small, there is no need to devise yet another distributed architecture but force the tool to differentiate its functionality based on a command line parameters. For example, the following tool implements Checklist pattern and chooses the right checklist from a checklist repository based on a command line option:
c:\> GreatTool -client
c:\> GreatTool -server
This nicely fits with a case when a server is also a client to another server and we need to troubleshoot its client and server functionality on the same physical computer.
- Dmitry Vostokov @ DumpAnalysis.org -
Posted in DebugWare Patterns, Debugging, Software Architecture, Software Engineering, Software Technical Support, Tools | 1 Comment »
Tuesday, October 20th, 2009
Many troubleshooting tools and their components (like TUW modules from checklists) reuse the same code over and over, for example, querying registry keys or environment variables. It is beneficial to have a package of supporting modules (or a library) for code reuse purposes, hence the name of this pattern, Supporting Module (SM). In the context of Checklist pattern we can refine its UML component diagram to highlight that TUWs are using some shared SM components:
- Dmitry Vostokov @ DumpAnalysis.org -
Posted in DebugWare Patterns, Debugging, Software Architecture, Software Engineering, Software Technical Support, Tools | No Comments »