Archive for the ‘Software Trace Analysis’ Category

Trace Analysis Patterns (Part 237)

Saturday, November 18th, 2023

How can we view traces and logs to facilitate there classification? One of the possible avenues is to view traces and logs consisting of the very large conceptual units, bricks, or bases to avoid combinatorial explosion. The natural candidates are Activity Region, Discontinuity, and Error Message or Exception Stack Trace Characteristic Message Block (Crash metaphor). So we have A, C, D, and we add B for Bad Activity Region whatever that means. For example, a typical trace that starts with some activity, then we have an exception stack trace belongs to AC Trace Class. Another trace that starts with some activity, then doesn’t show any messaged till the end can be classified as AD. A more elaborate class is ABCABCABCBC with periodicity of normal and bad activities culminating with error messages and finally with the last bad activity and exception. These three Trace Classes are depicted in the following diagram:

We combine sequences of the same bases into one, for example, AAAAA as just A, thus abstracting from semantic and syntactical differences between normal Activity Regions. The same is with other bases and can be considered as an extreme version of Quotient Trace. This classification can also be applied to individual Threads of Activity and Adjoint Threads of Activity.

This genetic-like description parallels the earlier proposal for DNA and RNA of Ruptured Computation.

- Dmitry Vostokov @ DumpAnalysis.org + TraceAnalysis.org -

Trace Analysis Patterns (Part 236)

Monday, November 6th, 2023

If Trace String analysis patterns caters for trace length variations when the sequence of Activity Regions is constant then Trace Amplitude is about different paths between constant regions at both trace ends that may include varying regions in between, as depicted in the following diagram:

Therefore, several different Trace Strings may be embedded in one Trace Amplitude. The idea of this analysis pattern was borrowed from the path integral formulation of QM.

- Dmitry Vostokov @ DumpAnalysis.org + TraceAnalysis.org -

Trace Analysis Patterns (Part 235)

Sunday, September 24th, 2023

Some Dia|gram language illustrations of trace and log analysis patterns can be easily converted to more usual graphs. For example, Trace Field can be converted to Combed Trace or Adjoint Threads of Activity:


The resulted series can be plotted as a graph:

If time is values are not uniform Time Scale analysis pattern may be involved with the constructed Motivic Trace. We call this analysis pattern Trace Graph.

- Dmitry Vostokov @ DumpAnalysis.org + TraceAnalysis.org -

Trace Analysis Patterns (Part 234)

Sunday, September 17th, 2023

When comparing traces we may be interested in their Trace Benchmarks, for example (not limited to, just a proposal):

  • Performance impact (impact this trace collection has on system performance)
  • Problem relevance score (was it really relevant or missed the problem repro?)
  • Easy to understand (is there any room for improvement for trace messages?)
  • Sensitivity (does it have any sensitive information?)
  • Canonicity score (does it contain all required ATIDs?)
  • Novelty score (any surprises?)
  • Sufficiency (does it require supplemental log from other tools?)
  • Pattern metrics (number of distinct error messages, etc., based on trace and log analysis patterns)
  • Problem resolution impact (was it the trace that provided missing insights?)

This post-analysis pattern may also be useful for problem postmortems and case studies. This pattern is different from Trace Summary which is a pre-analysis information.

- Dmitry Vostokov @ DumpAnalysis.org + TraceAnalysis.org -

Trace Analysis Patterns (Part 233)

Saturday, September 16th, 2023

When comparing traces, saving them for further processing, or making their Trace Mask, we may transform them into Canonical Trace form with the same Trace Schema:

This analysis pattern is different from Master Trace and Meta Trace, where the former is about an “ideal” archetype trace of a use case to compare to, and the latter is about trace evolution when underlying code changes.

- Dmitry Vostokov @ DumpAnalysis.org + TraceAnalysis.org -

Trace Analysis Patterns (Part 232)

Monday, August 28th, 2023

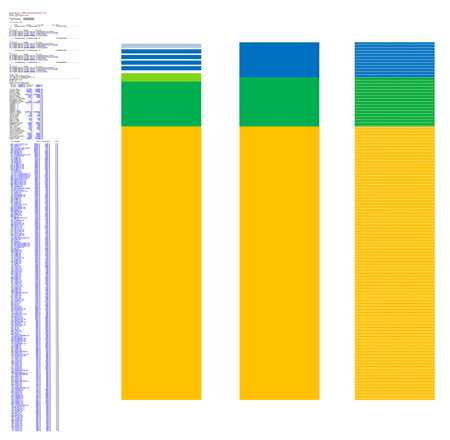
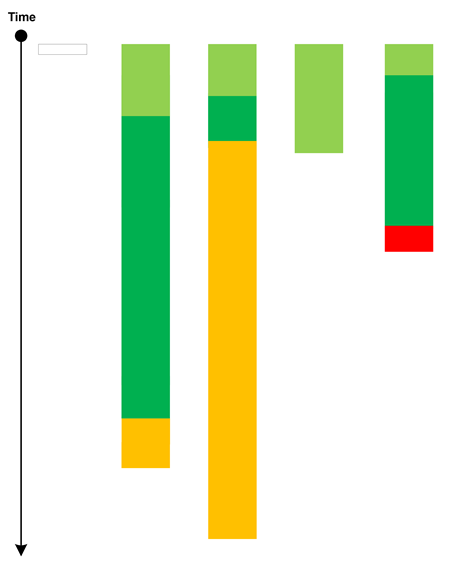
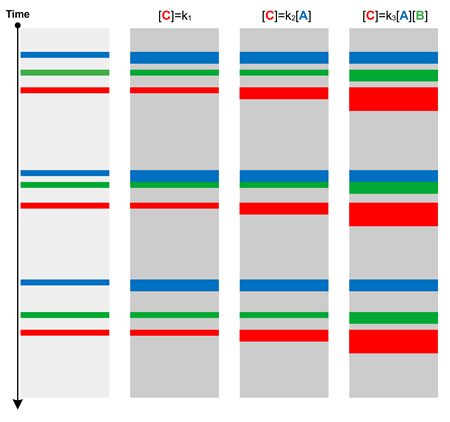
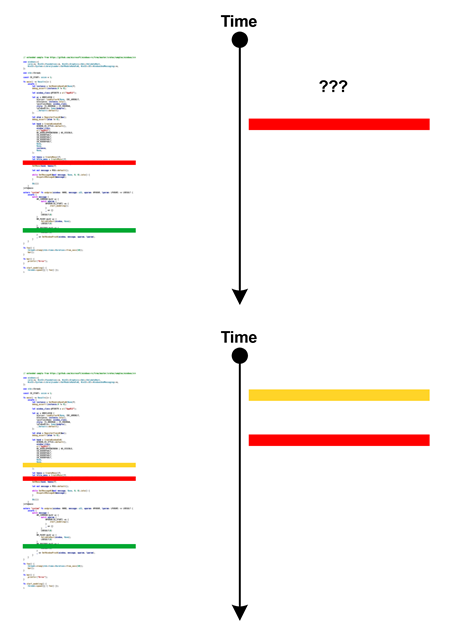
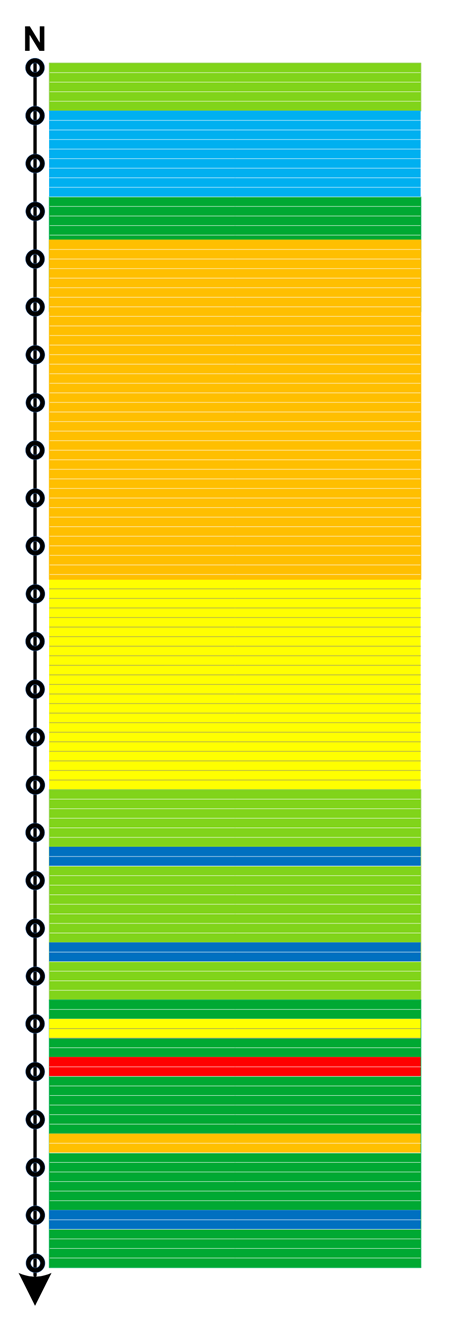
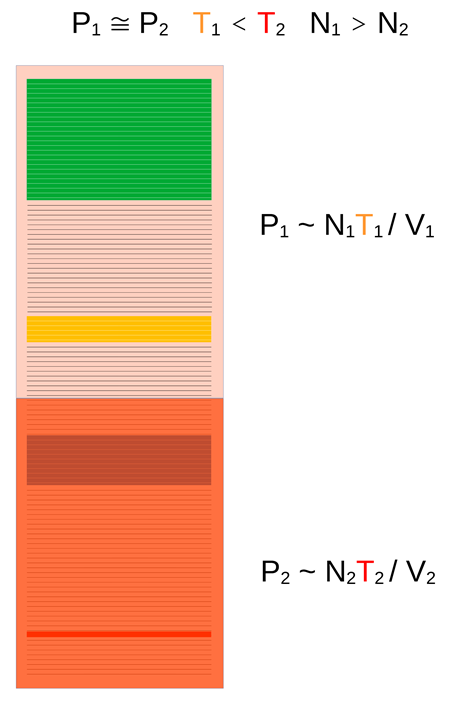
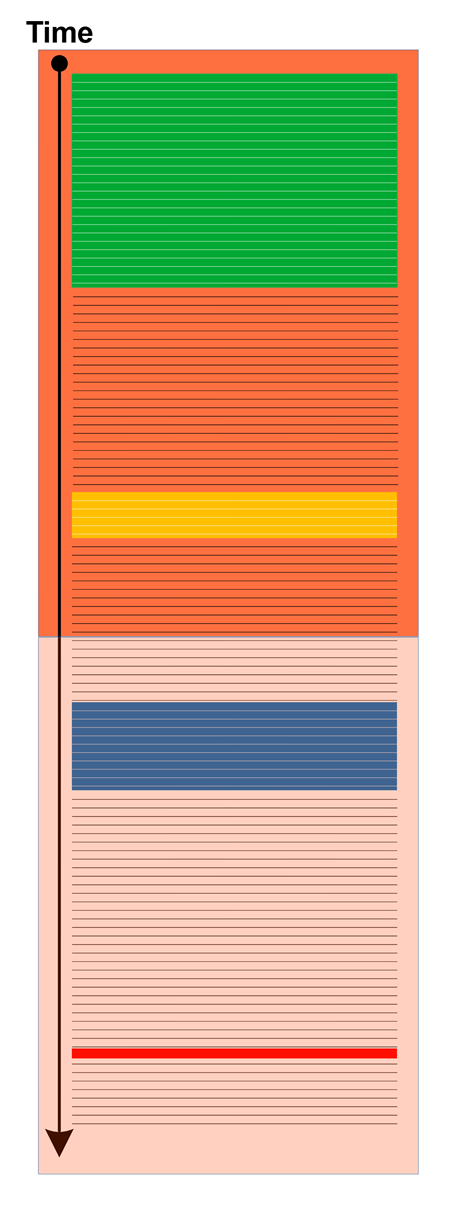
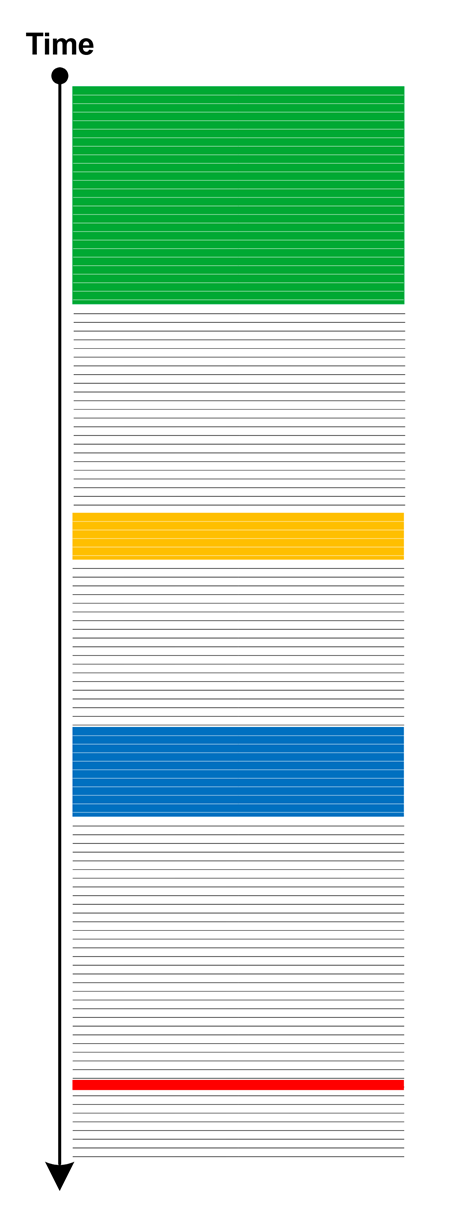
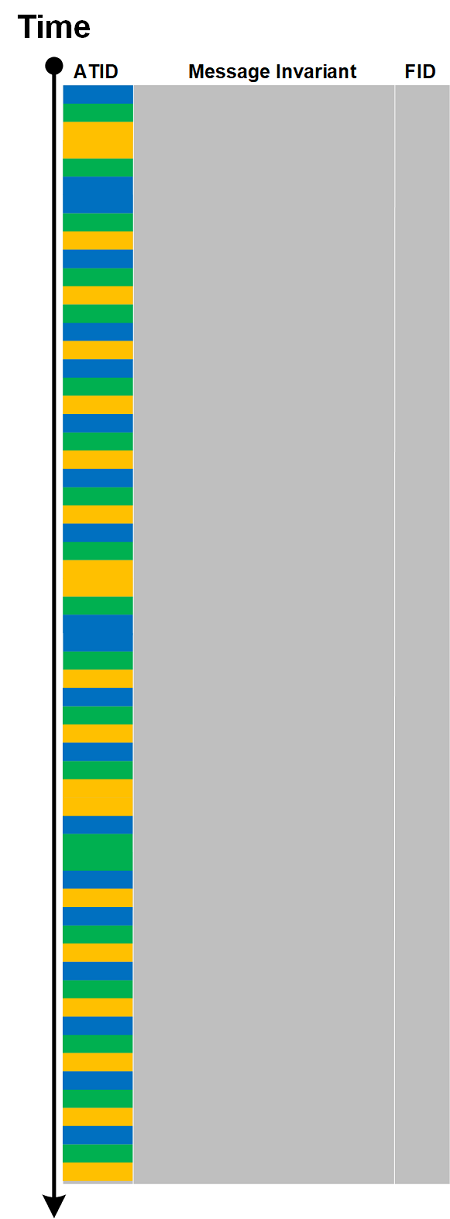
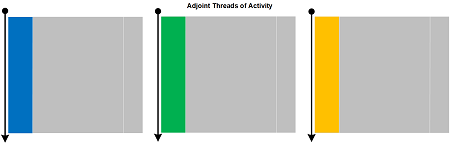
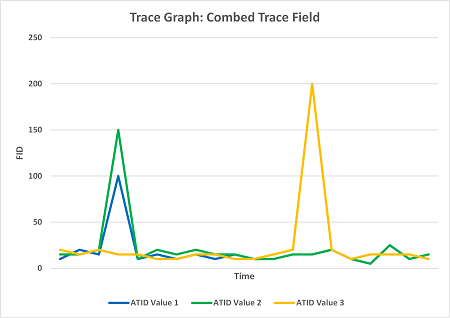
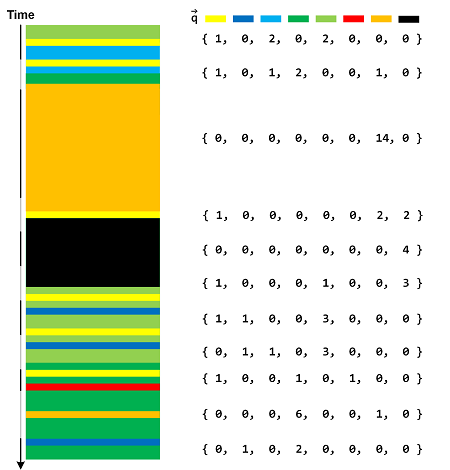
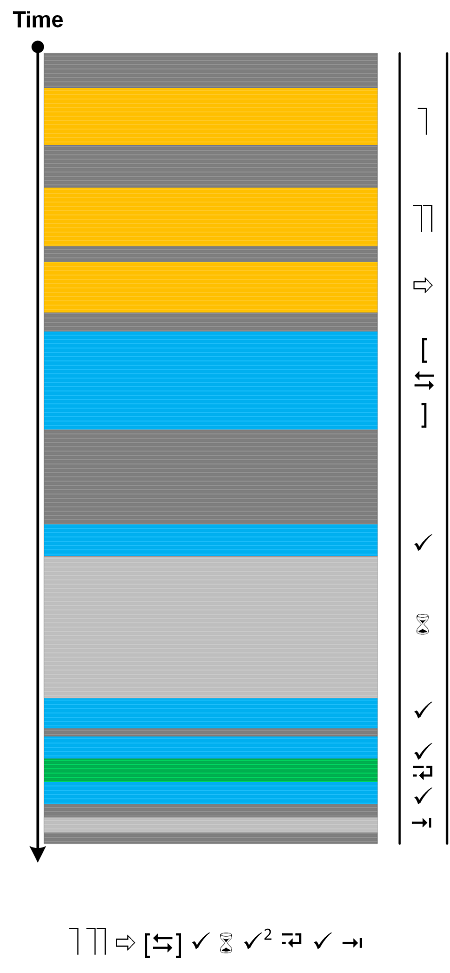
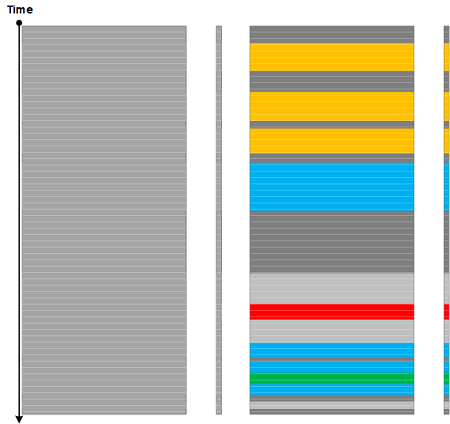
Most trace and log diagrams we use for analysis pattern illustration are 1-dimensional if we ignore the structure of individual trace messages despite being looking as 2-dimensional. It is, therefore, natural to consider them as periodic and aperiodic tessellations of a line using a set of segments of different lengths and colors. A Trace Tessellation analysis pattern is such an arrangement based on some criteria, for example, a combination of trace and log analysis patterns or simply some A(TID) mapping.

GPT-4 suggests the following outline for 1-dimensional tessellation:

Tessellating a one-dimensional space like a line is fundamentally simpler than tessellating a two-dimensional space. Given that a line segment is the only basic shape you can use to tessellate a line, at first glance, it may seem there isn’t much room for diverse or “interesting” patterns. However, we can introduce variability by considering the following:

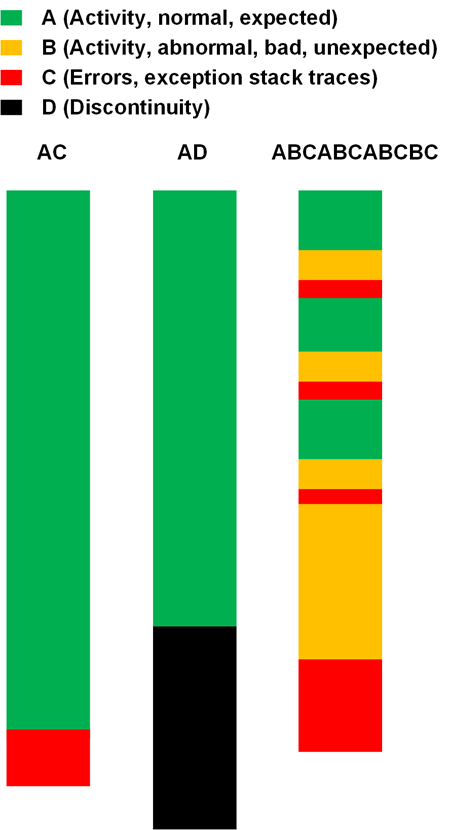
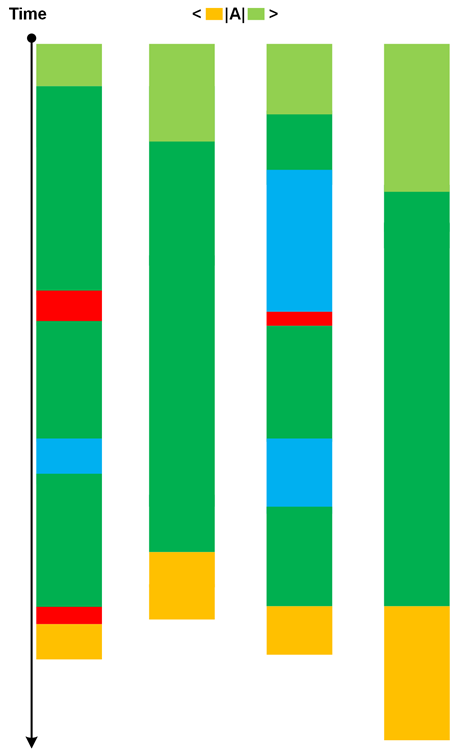
Varying Lengths: Instead of using uniform line segments, use segments of varying lengths. For instance, alternating between short and long segments can create a rhythmic pattern.

Color or Texture Variations: Even though it’s a one-dimensional space, you can vary colors or textures. For example, alternate between black and white line segments.

Spacing: While traditional tessellation has no gaps, you could introduce regular or irregular spacing between line segments for a more abstract approach.

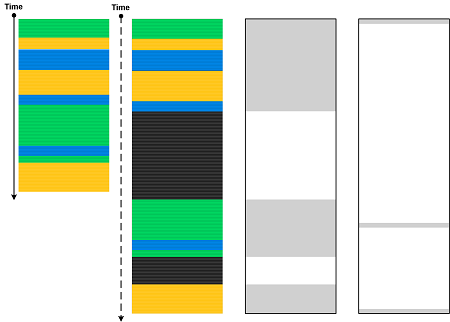
Pattern Interruption: Repeating a set pattern and then deliberately interrupting it can be visually interesting. For instance, having three short segments followed by one long segment, and then repeating.

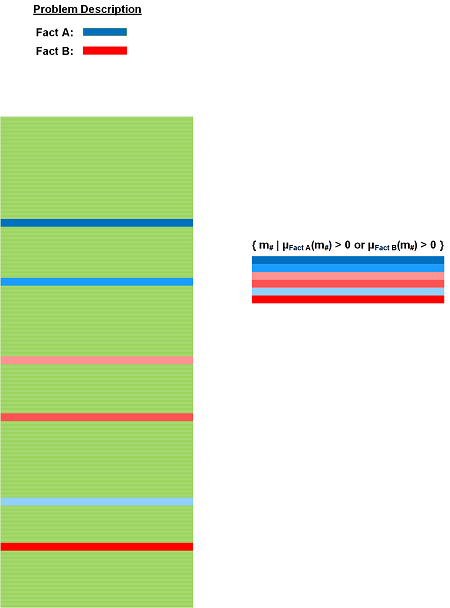
Associative Representation: You can use tessellated patterns on a line to represent data or other concepts. For example, Morse code uses a combination of short (”dots”) and long (”dashes”) signals, essentially tessellating a line with two types of segments to convey information.

Fractals and Recursive Patterns: While not “tessellation” in the traditional sense, you can create patterns on a line using recursive rules. The Cantor set is an example of this, where you take a line segment, remove the middle third, and then repeat the process for the remaining segments ad infinitum.

These are just a few ways to introduce interest and complexity into the “tessellation” of a one-dimensional space. While it’s fundamentally simpler than two-dimensional tessellation, with some creativity, you can still achieve intriguing and meaningful patterns.

- Dmitry Vostokov @ DumpAnalysis.org + TraceAnalysis.org -

Trace Analysis Patterns (Part 231)

Sunday, April 2nd, 2023

Suppose we are interested in particular message types, which are Message Patterns. We can form a Pattern Vector with values of corresponding Message Pattern occurrences during each fixed time interval corresponding to selected Time Scale. A typical example is illustrated in the following diagram with counted Silent Messages as well:

Each Message Vector component value is the local Statement Current. We can also select Statement Densities instead, especially if we select only Message Patterns from Foreground Components. Other values are possible, for example, from Trace Field.

- Dmitry Vostokov @ DumpAnalysis.org + TraceAnalysis.org -

Trace Analysis Patterns (Part 230)

Monday, March 6th, 2023

Inspired by Laws of Form and works inspired by it including Story and Structure we introduce Iconic Trace symbolic mapping for individual messages, Activity Regions, Motives, and Activity Theatre. A typical example is illustrated in the following diagram:

It is also possible to construct Iconic CoTraces. We will provide different symbolic profiles (with the meaning of various symbols) and examples later in the forthcoming revision of Software Narratology.

- Dmitry Vostokov @ DumpAnalysis.org + TraceAnalysis.org -

Trace Analysis Patterns (Part 229)

Saturday, February 25th, 2023

Often, we have Basic Facts but are unsure 100% if particular trace messages are relevant or not. We take the idea of Case Messages analysis pattern from fuzzy sets where we have a degree of membership function. It is illustrated in the following diagram:

In comparison, Message Set analysis pattern is about crisp sets where the degree of membership is either 0 or 1.

- Dmitry Vostokov @ DumpAnalysis.org + TraceAnalysis.org -

Trace Analysis Patterns (Part 228)

Sunday, February 19th, 2023

If necessary, for example, for the conversion to Text Trace, individual trace messages may need to be converted to message text form blending various message constituents like ATIDs, Message Invariants, data, and Trace Constants into some textual narrative form. We illustrate it in the following diagram:

We call the resulting message text Denormalized Message. It is the reverse process than finding Features of Activity and constructing structured messages conforming to some Trace Schema.

- Dmitry Vostokov @ DumpAnalysis.org + TraceAnalysis.org -

Trace Analysis Patterns (Part 227)

Sunday, February 19th, 2023

In addition to Trace Skeleton, we can insert Silent Messages, treat non-silent messages as instances of some template message, and even take Quotient Trace of them, leaving the position of final non-silent messages intact. This is similar to retraction in topology, so we name this analysis pattern Trace Retract and illustrate it in the following diagram:


- Dmitry Vostokov @ DumpAnalysis.org + TraceAnalysis.org -

Trace Analysis Patterns (Part 226)

Sunday, February 19th, 2023

When we construct Trace Molecule, we may find that some Message Complex links from different ATIDs point to the same message and Tracemes. In such a case we have Message Bond by analogy with covalent bonds. One such example is illustrated in the following diagram:


- Dmitry Vostokov @ DumpAnalysis.org + TraceAnalysis.org -

Trace Analysis Patterns (Part 225)

Saturday, February 18th, 2023

Trace Nerve is Thread of Activity or Adjoint Thread of Activity that runs through all Activity Regions. An example is illustrated in the following diagram:

Of course, depending on trace or log, there can be several Trace Nerves. This analysis pattern was inspired by nerve complexes in topology.

- Dmitry Vostokov @ DumpAnalysis.org + TraceAnalysis.org -

Trace Analysis Patterns (Part 224)

Saturday, February 18th, 2023

Looking at software traces and logs as 2-categories allows us to consider Whisker Traces (horizontal composition) in addition to vertical composition such as Serial Traces, Trace Mask, and Container Traces. The same ATIDs can be combined, and if there is a time mismatch, additional message copies need to be added (whiskering). The process is illustrated in the following diagram:

- Dmitry Vostokov @ DumpAnalysis.org + TraceAnalysis.org -

Trace Analysis Patterns (Part 223)

Friday, February 17th, 2023

Trace embedding usually happens when some external tracing or logging framework or library is used. In this case, a trace message becomes part of an outer trace message which may have its own uniform Trace Schema. In this case, Embedded Trace analysis pattern is different from Container Trace where outer Trace Schemas may be different.

- Dmitry Vostokov @ DumpAnalysis.org + TraceAnalysis.org -

Trace Analysis Patterns (Part 222)

Saturday, February 11th, 2023

Trace Windows, the obvious analysis pattern that was always implicit, is added now due to the proliferation of stream processing nowadays. However, it captures not only horizontal windows but vertical ones, similar to subspaces if we consider messages as vectors. Both types of windows can be combined. This is illustrated in the following diagram:

- Dmitry Vostokov @ DumpAnalysis.org + TraceAnalysis.org -

Trace Analysis Patterns (Part 221)

Wednesday, February 8th, 2023

There’s some kind of duality between trace data and activity. For example, trace data corresponds to CoData (CoTrace, CoLog), the analysis activity. On the other hand, Regions of Activity (and various Activity-related patterns such Thread of Activity) may contain data that itself may point to some activity (not necessarily the same), CoActivity. For example, some keyboard-related message data may contain values of passwords. This analysis pattern is illustrated schematically in the following diagram:

CoActivity is different from Data Flow, where the same or modified value is passed from one message to another, not necessarily inside the same activity.

- Dmitry Vostokov @ DumpAnalysis.org + TraceAnalysis.org -

Trace Analysis Patterns (Part 220)

Tuesday, February 7th, 2023

For any Message Complex, we can choose the corresponding Tracemes and assign them to points. If we keep ourselves only to line segments, we call these arrangements Trace Molecules. One example is illustrated in the following diagram:

This molecular approach was inspired by semic molecules in semic analysis. On the other hand, ultimately, the whole trace is one giant molecule similar to the traces and logs as proteins metaphor. This approach differs from the earlier artificial chemistry approach to trace and log analysis where molecules are patterns.

- Dmitry Vostokov @ DumpAnalysis.org + TraceAnalysis.org -

Trace Analysis Patterns (Part 219)

Monday, February 6th, 2023

Consider the following trace message:

object: 0x77F468AB100 ref: 2

It contains several Tracemes, the smallest units of tracing (trace meaning, by analogy with semes), corresponding to Message Invariants and their data: //object memory address//, and //reference count//. However, they are structurally higher in the semantic hierarchy when compared with sememesTraceme is pronounced /tɹeɪˈsiːm/ and can also be interpreted as trace me.

- Dmitry Vostokov @ DumpAnalysis.org + TraceAnalysis.org -

Trace Analysis Patterns (Part 218)

Sunday, February 5th, 2023

Message Complex takes inspiration from simplicial complexes. We select a message, choose TID or ATID, and connect to the nearest messages having the same TID or ATID. This procedure can be repeated for newly connected messages. Then we select another ATID and repeat the procedure. Three connected messages with the same ATID may form a triangle and may also intersect another triangle with a different ATID if they share the same message. A very simple example is illustrated in the following diagram:

Message Complex is more structural and geometric compared to Message Context, which is just a set of surrounding messages regardless of their TID or ATID based on some relationship criteria.

- Dmitry Vostokov @ DumpAnalysis.org + TraceAnalysis.org -