.SYS (Debugging Slang, Part 9)
Tuesday, April 13th, 2010.SYS - Sponsor YourSelf or Sponsor YourSelves.
Examples: I’m developing a fantastic project.SYS
- Dmitry Vostokov @ DumpAnalysis.org + TraceAnalysis.org -
.SYS - Sponsor YourSelf or Sponsor YourSelves.
Examples: I’m developing a fantastic project.SYS
- Dmitry Vostokov @ DumpAnalysis.org + TraceAnalysis.org -
Plan to start providing training and seminars in my free time. If you are interested please answer these questions (you can either respond here in comments or use this form for private communication http://www.dumpanalysis.org/contact):
Additional topics of expertise that can be integrated into training include Source Code Reading and Analysis, Debugging, Windows Architecture, Device Drivers, Troubleshooting Tools Design and Implementation, Multithreading, Deep Down C and C++, x86 and x64 Assembly Language Reading.
Looking forward to your responses. Any suggestions are welcome.
- Dmitry Vostokov @ DumpAnalysis.org + TraceAnalysis.org -
This is a new open source tool similar to PDBFinder in functionality but with much simpler interface and internal implementation (based on the file name structure of the certain classes of TMF files for ETW). To be released this month on TraceAnalysis.org.
- Dmitry Vostokov @ DumpAnalysis.org + TraceAnalysis.org -
I’m very pleased to announce that the Korean edition is available:

The book can be found on:
- Dmitry Vostokov @ DumpAnalysis.org + TraceAnalysis.org -
Just got today a notification from one of corporate content providers that the following book was released a few months ago (reading it now and post a review later):
Technical Support Essentials: Advice to Succeed in Technical Support

It would be interesting to compare with the Art of Software Support book (I still hasn’t finished it yet).
- Dmitry Vostokov @ DumpAnalysis.org + TraceAnalysis.org -
The clash of titans over the bit of memory.
- Dmitry Vostokov @ DumpAnalysis.org + TraceAnalysis.org -
On The Same Page - coming to the same conclusion as another engineer when looking at a memory dump or a software trace. Literally means the same page of memory where an exception occurred or a stack trace is reconstructed or the same “page” when browsing a software trace output using a viewer.
Examples: Aha, we are on the same page!
- Dmitry Vostokov @ DumpAnalysis.org + TraceAnalysis.org -
This is a revised, edited, cross-referenced and thematically organized volume of selected DumpAnalysis.org blog posts about crash dump analysis and debugging written in July 2009 - January 2010 for software engineers developing and maintaining products on Windows platforms, quality assurance engineers testing software on Windows platforms and technical support and escalation engineers dealing with complex software issues. The fourth volume features:
- 13 new crash dump analysis patterns
- 13 new pattern interaction case studies
- 10 new trace analysis patterns
- 6 new Debugware patterns and case study
- Workaround patterns
- Updated checklist
- Fully cross-referenced with Volume 1, Volume 2 and Volume 3
- New appendixes
Product information:

Back cover features memory space art image: Internal Process Combustion.
- Dmitry Vostokov @ DumpAnalysis.org + TraceAnalysis.org -
STUPID - Software Tracing Under Pressure Is Dumb
Examples: STUPID! STUPID! I told you to enable all modules! You included all but the one I need…
- Dmitry Vostokov @ DumpAnalysis.org + TraceAnalysis.org -
What happens when Hidden Output and Frozen Process patterns don’t help with annoying popup windows? The former can’t prevent windows from reappearing afresh and the latter could block other coupled processes that might exchange window messages with our suspended process or simply use any IPC mechanism. Here Axed Code pattern can help as demonstrated below. One process was frequently and briefly showing network disconnection message box or dialog. The problem is that it was also bringing its main window into foreground disrupting work in other windows because they were loosing focus. Next time the dialog appeared we found its process ID in Task Manager and attached WinDbg to it. We wasn’t sure what dialog function to intercept so we put a general breakpoint on all “Dialog” functions for all threads:
0:000:x86> bm *Dialog*

[...]

  6: 73a8ba81 @!"MFC80!CDialog::~CDialog"

  7: 73ac25e2 @!"MFC80!CPageSetupDialog::~CPageSetupDialog"

  8: 73a94b6b @!"MFC80!CDHtmlDialog::_AfxSimpleScanf"

  9: 73a8fbe9 @!"MFC80!CFileDialog::OnTypeChange"

 10: 73a90b17 @!"MFC80!CColorDialog::GetRuntimeClass"

 11: 73a8bb4a @!"MFC80!CDialog::CreateIndirect"

[...]

360: 73a93750 @!"MFC80!CDHtmlDialog::OnNavigateComplete"

361: 73a8f1f3 @!"MFC80!CCommonDialog::OnOK"

362: 73a95d9f @!"MFC80!CDHtmlDialog::GetDropTarget"

363: 73a90266 @!"MFC80!CPrintDialog::GetDevMode"

364: 73ac1514 @!"MFC80!COleInsertDialog::COleInsertDialog"

365: 73ac27c7 @!"MFC80!COlePropertiesDialog::COlePropertiesDialog"

366: 73a75282 @!"MFC80!CWnd::UpdateDialogControls"

367: 73a7fd86 @!"MFC80!CDialogBar::SetOccDialogInfo"
0:000:x86> g

Breakpoint 314 hit

MFC80!_AfxPostInitDialog:

73a7134e 55              push    ebp
0:000:x86> kL 100

ChildEBP RetAddr  Args to Child

0027ed2c 73a7180a MFC80!_AfxPostInitDialog

0027ed90 75628817 MFC80!_AfxActivationWndProc+0x90

0027edbc 7562898e USER32!InternalCallWinProc+0x23

0027ee34 7562c306 USER32!UserCallWinProcCheckWow+0x109

0027ee78 756375a2 USER32!SendMessageWorker+0x55b

0027ef4c 7563787a USER32!InternalCreateDialog+0xb64

0027ef70 75649b65 USER32!CreateDialogIndirectParamAorW+0x33

0027ef9c 75225192 USER32!CreateDialogParamA+0x4a

WARNING: Stack unwind information not available. Following frames may be wrong.

0027efc8 010c3bf1 DllA!WarningPopup+0×152

0027effc 73a71812 ProcessA+0×9fa1

00000000 00000000 MFC80!_AfxActivationWndProc+0×98
Now we cleared all breakpoints and put the new breakpoint on WarningPopup function:
0:000:x86> bc *
0:000:x86> bp DllA!WarningPopup
0:000:x86> g

Breakpoint 0 hit

DllA!WarningPopup:

75225040 51              push    ecx
Then we assumed that the calling convention was the default one used by C or C++ code like _cdecl and took the bold step to replace push ecx with ret instruction:
0:000:x86> a 75225040

75225040 ret

ret

75225041
0:000:x86> g

Breakpoint 0 hit

DllA!WarningPopup:

75225040 c3 ret
0:000:x86> bc *
0:000:x86> g
Result: no warning popups anymore.
I originally intended to name the pattern Patched Code but then realized that code axing can also be done at the source code level as a quick temporal fix.
- Dmitry Vostokov @ DumpAnalysis.org + TraceAnalysis.org -
Another workaround pattern for some problems is to freeze a process responsible for an annoying or excessive activity like in the case study: Debugger as a Shut Up Application. We can also use other tools for this purpose like Mark Russinovich’s PsSuspend. The suitable name for this pattern is Frozen Process.
- Dmitry Vostokov @ DumpAnalysis.org + TraceAnalysis.org -
After fighting HTML comments in Safari and Chrome (see the case study below) I came to an idea to name and catalog workaround patterns in troubleshooting and debugging. The first one is called Hidden Output. Sometimes we can just remove message boxes reporting minor problems and generating unnecessary support calls by hiding their windows, for example, by using CtxHideEx32. A different example is what I did today when troubleshooting Amazon aStore widget HTML code. It worked well in IE8:
However, in Apple Safari and Google Chrome the widget code was visible at the top of the page:
After a few unsuccessful attempts to debug the problem and faced with other pressing tasks I got a flash in my mind to hide the visible code by changing its color to be the same as its background:
<font color=”D3E7F4″><script type=”text/javascript”><!–

amazon_ad_tag=”crasdumpanala-20″;

amazon_ad_width=”728″;

amazon_ad_height=”90″;

amazon_color_background=”D3E7F4″;

amazon_color_border=”0000FF”;

amazon_color_logo=”FFFFFF”;

amazon_color_link=”0000FF”;

amazon_ad_logo=”hide”;

amazon_ad_link_target=”new”;

amazon_ad_border=”hide”;

amazon_ad_title=”OpenTask Books, Magazines and Notebooks”; //–></script>

<script type=”text/javascript” src=”http://www.assoc-amazon.com/s/asw.js”></script></font>
After that the picture became nicer:
- Dmitry Vostokov @ DumpAnalysis.org + TraceAnalysis.org -
After exciting results of the previous year of debugging it is time to announce modest plans for this year, 0×7DA:
Release the first beta version of EasyDbg
Release the first beta version of CARE (Crash Analysis Report Environment) for a pattern-driven debugger log analyzer with standards for structured audience-driven reports
Release the first beta version of STARE (Software Trace Analysis Report Environment) for a pattern-driven software trace analyzer with corresponding standards for structured audience-driven reports
Publish the following books on dump analysis that address different audiences (general users, system administrators, support and escalation engineers, testers, software engineers, security and software defect researchers):
- Windows Debugging Notebook
- Crash Dump Analysis for System Administrators and Support Engineers
- Memory Dump Analysis Anthology, Volume 4
- Memory Dump Analysis Anthology, Volume 5
- Memory Dump Analysis Anthology Color Supplement
- Principles of Memory Dump Analysis
- My Computer Crashes and Freezes: A Non-technical Guide to Software and Hardware Errors
- Linux, FreeBSD and Mac OS X Debugging: Practical Foundations
- Encyclopedia of Crash Dump Analysis Patterns
- WinDbg In Use: Debugging Exercises
Publish articles related to memory dump analysis in Debugged! magazine
Update WinDbg Poster and Cards
- Dmitry Vostokov @ DumpAnalysis.org + TraceAnalysis.org -
The Year of Debugging, 0×7D9, was a remarkable year for DumpAnalysis.org. Here is the list of achievements to report:
- Software Trace Analysis as a new discipline with its own set of patterns
- Unification of Memory Dump Analysis with Software Trace Analysis (DA+TA)
- New computer memory dump-based art movements: Opcodism and Physicalist Art
- Discovery of 3D computer memory visualization techniques
- Establishing Software Maintenance Institute
- Broadening software fault injection as Software Defect Construction discipline
- Establishing a new profession of a Software Defect Researcher
- Starting ambitious Dictionary of Debugging
- Publishing Windows Debugging: Practical Foundations book
- Publishing the first x86-free Windows debugging book: x64 Windows Debugging: Practical Foundations
- Establishing the new debugging magazine: Debugged! MZ/PE
- Publishing Memory Dump Analysis Anthology, Volume 3
- Cooperation with OpenTask to promote First Fault Software Problem Solving book
- Establishing Debugging Expert(s) Magazine Online
- Creating the first development process for debugging and software troubleshooting tools: RADII
- Publishing the first pattern-driven memory dump analysis troubleshooting methodology as a foundation for software debugging
- Proposal for an International Memory Analysts and Debuggers Day
- Almost completed Windows Debugging Notebook to be published soon
Now DumpAnalysis.org focuses on The Year of Dump Analysis, 0×7DA, as a foundation for the forthcoming debugging decade and reveals future plans this weekend.
I’m sure that many other organizations and individuals have no less remarkable accomplishments to report for 2009. I promise to track down and write about some of them in the forthcoming book:
The Science of Dr. Watson: An Illustrated History of Debugging (ISBN: 978-1906717070)
- Dmitry Vostokov @ DumpAnalysis.org + TraceAnalysis.org -
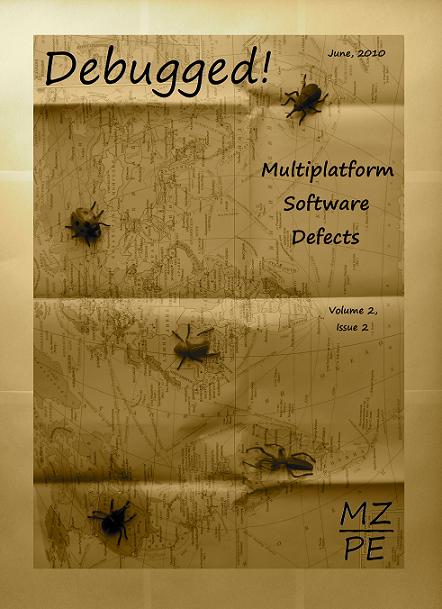
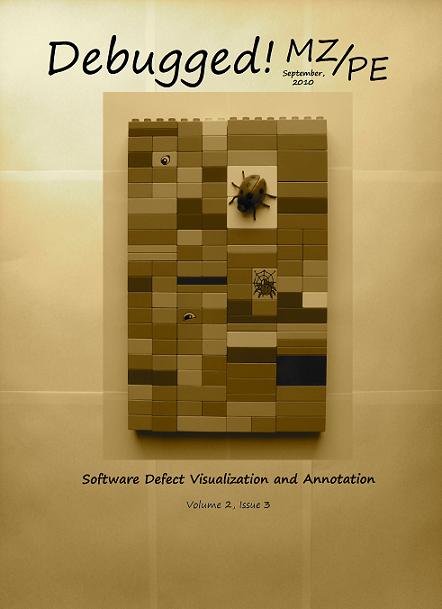
Main topics of Debugged! MZ/PE magazine issues for June and September 2010:
Debugged! MZ/PE: Multiplatform Software Defects, June, 2010 (Paperback, ISBN: 978-1906717902)
Debugged! MZ/PE: Software Defect Visualization and Annotation, September, 2010 (Paperback, ISBN: 978-1906717919)
Here are draft front covers designed today:
- Dmitry Vostokov @ DumpAnalysis.org -
See the greeting card on the portal together with New Year’s Eve code analysis puzzle:
DumpAnalysis.org Wishes Happy New Year 7DA!
- Dmitry Vostokov @ DumpAnalysis.org -
“Memory dumps are facts.”
I’m very excited to announce that Volume 3 is available in paperback, hardcover and digital editions:
Memory Dump Analysis Anthology, Volume 3
In two weeks paperback edition should also appear on Amazon and other bookstores. Amazon hardcover edition is planned to be available in January 2010.
The amount of information was so voluminous that I had to split the originally planned volume into two. Volume 4 should appear by the middle of February together with Color Supplement for Volumes 1-4.
- Dmitry Vostokov @ DumpAnalysis.org -
I propose to celebrate it on 08.08 every year starting from The Year of Dump Analysis, 2010, 7DA at 8:00 (I prefer 8pm for MAD Day, moderation is important in debugging too).
What do you think? If you count things from 0 or favour user space there is an alternative date: 07.07
- Dmitry Vostokov @ DumpAnalysis.org -
Previously announced Software Maintenance Institute was finally registered in Ireland (Reg. No. 400906) and its certificate was received yesterday.
Here is the current component structure of various institutions (depicted in UML):
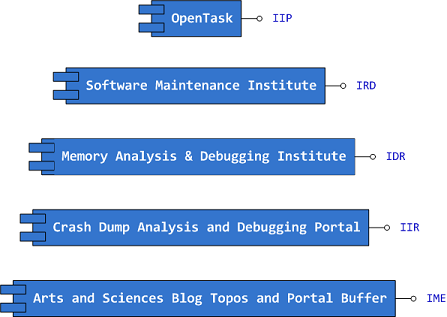
Interface Tags:
IIP Interface of Iterative Publishing

IRD Interface of Research and Development

IDR Interface of Defect Research

IIR Interface of Information Repository

IME Interface of Memetic Engineering
- Dmitry Vostokov @ DumpAnalysis.org -
Finally, after the long delay, the issue is available in print on Amazon and through other sellers:
Debugged! MZ/PE: Software Tracing
- Dmitry Vostokov @ DumpAnalysis.org -