Archive for the ‘Software Technical Support’ Category
Saturday, July 10th, 2010
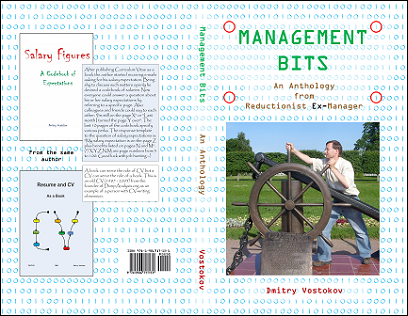
Being a software engineer, the author penetrated a software technical support department of a major software company rising to a management position. There he started collecting various management bits and tips promising everyone to write a management book. After moving back to engineering he became a director of several software research, education, publishing and software behavior analysis consultancy institutions including a museum. This book is an anthology of selected and edited blog posts from his Management Bits and Tips blog.
What this book has to do with the crash dump analysis then? Considering metaphorically an organization as a software machine, teams as processes and individuals as threads the author had applied his unique knowledge of software crashes and hangs to organizational project failures.
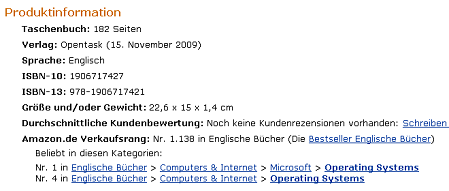
- Title: Management Bits: An Anthology from Reductionist Manager
- Author: Dmitry Vostokov
- Publisher: OpenTask (September 2010)
- Language: English
- Product Dimensions: 19.8 x 12.9
- Paperback: 100 pages
- ISBN-13: 978-1906717131
- Dmitry Vostokov @ DumpAnalysis.org + TraceAnalysis.org -
Posted in Announcements, Books, Crash Dump Analysis, Crash Dump Patterns, Escalation Engineering, Fun with Crash Dumps, Management Bits and Tips, Publishing, Software Engineering, Software Technical Support | No Comments »
Wednesday, July 7th, 2010
The rules of the previously announced competition have been changed. You can now also nominate someone by sending a debugging story link. Please send your story or a nomination using this page: http://www.dumpanalysis.org/contact or dmitry dot vostokov at dumpanalysis dot org (if a story is with pictures).

- Dmitry Vostokov @ DumpAnalysis.org + TraceAnalysis.org -
Posted in Announcements, Competitions and Awards, Crash Dump Analysis, Debugging, Escalation Engineering, Security, Software Engineering, Software Technical Support | No Comments »
Wednesday, June 16th, 2010
Adding AI. Analysis Improvement.
After reading earlier today Windows Internals pages about system audit an idea came to my mind in the evening to provide audit services for memory dump and software trace analysis. One mind is good but two are better, especially if the second is a pattern-driven AI. Here are possible problem scenarios:
Problem: You are not satisfied with a crash report.
Problem: Your critical issue is escalated to the VP level. Engineers analyze memory dumps and software traces. No definite conclusion so far. You want to be sure that nothing has been omitted from the analysis.
Problem: You analyze a system dump or a software trace. You need a second pair of eyes but don’t want to send your memory dump due to your company security policies.
Other scenarios (use cases) will be added as soon as I see the service fit to the realities of software technical support.
I plan to make this service operational in July - August, 2010. Prices to be announced soon.
- Dmitry Vostokov @ DumpAnalysis.org + TraceAnalysis.org -
Posted in .NET Debugging, Announcements, Common Mistakes, Complete Memory Dump Analysis, Crash Analysis Report Environment (CARE), Crash Dump Analysis, Crash Dump De-analysis, Crash Dump Patterns, Debugging, Escalation Engineering, Minidump Analysis, Software Behavior Patterns, Software Engineering, Software Technical Support, Software Trace Analysis, Software Troubleshooting Patterns, Tools, Trace Analysis Patterns | 1 Comment »
Sunday, June 13th, 2010
By analogy with paratext let’s introduce a software narratological concept of the extended software trace that consists of a software trace plus additional supporting information that makes troubleshooting and debugging easier. Such “paratextual” information can consists of pictures, videos, accounts of scenarios and past problem histories, customer interviews and even software trace delivery medium and format (if preformatted).
- Dmitry Vostokov @ DumpAnalysis.org + TraceAnalysis.org -
Posted in Debugging, Debugging Methodology, Escalation Engineering, Science of Software Tracing, Software Engineering, Software Narratology, Software Technical Support, Software Trace Analysis, Software Trace Reading | 1 Comment »
Friday, June 4th, 2010
An exercise in de-analysis
This anti-pattern is called Wild Explanation. This is a free floating explanation based on loose associations. Its extreme version uses Gödel incompleteness theorems (undecidable crashes and hangs), quantum mechanics (in small time delta any bug can appear and disappear without being caught) or hydrodynamics (code fluidity, turbulence around processor cores) for abnormal software behaviour explanation (similar to Fashionable Nonsense in philosophy, humanities and social sciences). Its milder version is slightly modified original analysis monologue I found when searching Google for stack traces (I provide my comments below):
“Two hints make me assume this can be a physical memory problem:”
PAGE_FAULT_IN_NONPAGED_AREA (50)
Invalid system memory was referenced. This cannot be protected by try-except,
it must be protected by a Probe. Typically the address is just plain bad or it
is pointing at freed memory.
Arguments:
Arg1: e37cc20e, memory referenced.
Arg2: 00000001, value 0 = read operation, 1 = write operation.
Arg3: 8083fe2c, If non-zero, the instruction address which referenced the bad memory
address.
Arg4: 00000000, (reserved)
EXCEPTION_CODE: (NTSTATUS) 0xc0000005 - The instruction at “0x%08lx” referenced memory at “0x%08lx”. The memory could not be “%s”.
I wouldn’t be so quick. Check Hardware Error pattern post and comments there. So let’s de-analyze the analysis.
“c0000005 is Access Denied where C is virtual memory, meaning usually disk cache”
c is just STATUS_SEVERITY_ERROR (0×3 or 0y11) 11000000000000000000000000000101 and doesn’t have any connection to cache or crash beyond a mere coincidence. See NTSTATUS bit descriptions: http://msdn.microsoft.com/en-us/library/cc231200(PROT.10).aspx
“It could be RAM and/or it could be savrt.sys if you’re using something like an antivirus.
Check to see if you need updates for them, Norton, Symantec, McCaffee.”
Of course, it is either RAM or antivirus, what else? What about a virus? All household names.
EXCEPTION_CODE: (NTSTATUS) 0xc0000005 - The instruction at “0x%08lx” referenced memory at “0x%08lx”. ”The memory could not be “%s”.” means there is something wrong with the debugger itself; those should be addresses, not percent signs and alphanumeric garbage.”
Now even a debugger is corrupt. RAM again? It is not a garbage, they’re format codes (like for printf C function) to print actual addresses.
“8083fe2c” this address called a pointer, that referenced “e37cc20e” again, that “e” has specific meaning, some virtual device or another, probably CD ROM, trying to transfer data to RAM. This implies either SCSI or PCI buss or DMA buss timing problems.”
RAM again… Evidence mounts stronger and stronger. Its all about timing. A bus buzzes.
“Which is usually caused by a bad driver, not RAM, but sometimes replacing the RAM “masks” out the failure.”
You never know… A bit of doubt?
“This normally happens with 64-bit machines that take advantage of the 64-bit superfast address access and indexing, known as Vector Indirect Addressing, which is, apparently, too fast for even recent Operating System code.”
I always suspected these machines run x64 times faster… I can only imagine horrors when Vector Indirect Addressing hits an old Operating System code. However, the crash under discussion is x86…
“A write to the “e” device; so, is it some kind of CDR or DVDR or other storage device?”
I guess that was a rhetorical question… or let me finish this thread of thought to connect dots, e-devices, virtual memory, disk cache and CD ROM. What if a page file was configured on a DVD-R?
- Dmitry Vostokov @ DumpAnalysis.org + TraceAnalysis.org -
Posted in AntiPatterns, Crash Dump Analysis, Crash Dump De-analysis, Crash Dump Patterns, Fun with Crash Dumps, Software Technical Support | No Comments »
Sunday, May 30th, 2010
Finally, after careful consideration, I’ve come up with the topic that has been neglected so far but at the same time important for both camps (kernel space and user space, including managed space): complete memory dump and software trace analysis. I plan to publish the first webinar agenda early in July and deliver the webinar in August (the date should be finalized by mid July).
PS. Sailing memory spaces under an RGB flag 

- Dmitry Vostokov @ DumpAnalysis.org + TraceAnalysis.org -
Posted in Announcements, CDF Analysis Tips and Tricks, Crash Analysis Report Environment (CARE), Crash Dump Analysis, Crash Dump Patterns, Debugging, DumpAnalysis and TraceAnalysis Logos, Escalation Engineering, Software Behavior Patterns, Software Technical Support, Software Trace Analysis, Software Troubleshooting Patterns, Tools, Trace Analysis Patterns, Training and Seminars, WinDbg Scripts, WinDbg Tips and Tricks | 2 Comments »
Tuesday, May 25th, 2010
Finally Citrix has published a tool (written by my colleague Colm Naish, lead escalation engineer) that allows controlled injection of events into CDF (ETW) trace message stream. This is useful in many troubleshooting scenarios where we need to rely on Significant Event and Anchor Message analysis patterns to partition traces into artificial Activity Regions to start our analysis with. This is also analogous for the imposition of the external time on the stream of tracing events from software narratology perspective:
CDFMarker On Demand - For XenApp and XenDesktop
- Dmitry Vostokov @ DumpAnalysis.org + TraceAnalysis.org -
Posted in Announcements, CDF Analysis Tips and Tricks, Citrix, Debugging, Escalation Engineering, Software Engineering, Software Narratology, Software Technical Support, Software Trace Analysis, Software Trace Reading, Tools, Trace Analysis Patterns | 1 Comment »
Friday, May 21st, 2010
In this part I would like to introduce the notion of Forgotten Facts in opposition to Basic Facts or supporting information. These are facts that engineers often feel uncomfortable to mention because they are troubleshooting information they couldn’t obtain (if they tried) due to some time or customer pressures, failures, incorrectly understood troubleshooting procedures or some other obstacles. Therefore it is important to have a set of counter questions or checklists mapped from common software behaviour patterns to software troubleshooting patterns. Problem descriptions should also be subjected to close reading to reveal unconsciously concealed information. Next part will explore this in more detail with some case studies commissioned by Software Maintenance Institute.
- Dmitry Vostokov @ DumpAnalysis.org + TraceAnalysis.org -
Posted in Crash Dump Analysis, Debugging, Escalation Engineering, Psychoanalysis of Software Maintenance and Support, Psychology, Software Behavior Patterns, Software Maintenance Institute, Software Technical Support, Software Trace Analysis, Software Trace Reading, Software Troubleshooting Patterns | 1 Comment »
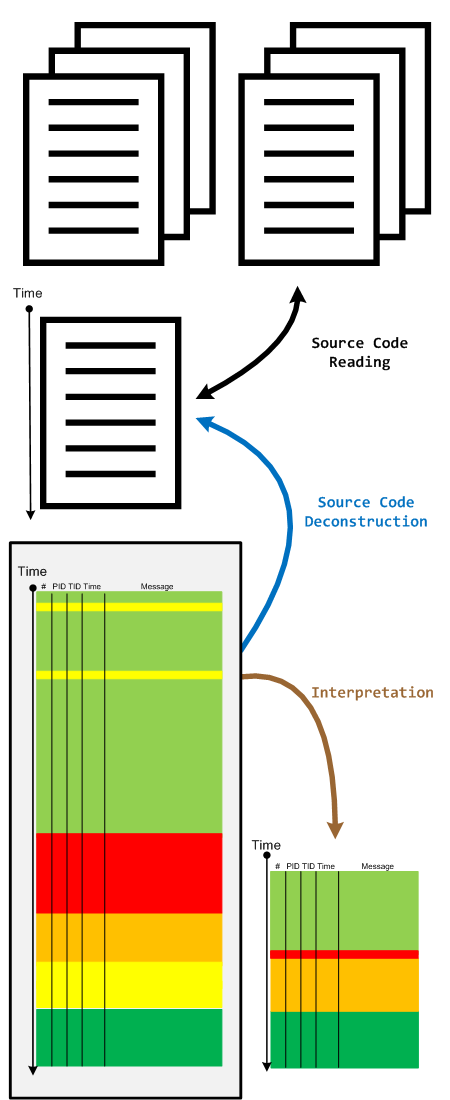
Friday, May 21st, 2010
When we have a software trace we read it in two directions. The first one is to deconstruct it into a linear ordered source code based on PLOT fragments. The second direction is to construct an interpretation that serve as an explanation for reported software behaviour. During the interpretive reading we remove irrelevant information, compress relevant activity regions and construct the new fictional software trace based on discovered patterns and our problem description.
- Dmitry Vostokov @ DumpAnalysis.org + TraceAnalysis.org -
Posted in Code Reading, Debugging, Science of Software Tracing, Software Narratology, Software Technical Support, Software Trace Analysis, Software Trace Reading, Trace Analysis Patterns | No Comments »
Monday, May 10th, 2010
My drive to generalization led me to place an adornment on the portal to highlight the fact that memory and software trace analysis patterns are under an umbrella of general software behaviour patterns:
http://www.dumpanalysis.org/Software-Behavior-Patterns-Headline
In the forthcoming post series I plan to write about similarities between these two branches and also provide pattern examples from non-Windows platforms. All this material will provide the foundation for the forthcoming book Software Behavior: A Guide to Systematic Analysis (ISBN: 978-1906717162).
- Dmitry Vostokov @ DumpAnalysis.org + TraceAnalysis.org -
Posted in Announcements, Computer Science, Crash Dump Analysis, Crash Dump Patterns, Debugging, Escalation Engineering, Memiotics (Memory Semiotics), Memoretics, Science of Memory Dump Analysis, Science of Software Tracing, Software Behavior Patterns, Software Engineering, Software Maintenance Institute, Software Technical Support, Software Trace Analysis, Software Troubleshooting Patterns, Trace Analysis Patterns | No Comments »
Wednesday, May 5th, 2010
PLOT - Program Lines of Trace - the source code lines behind trace messages
Examples: What a plot do we have here! The struggle against the monster database component and endless voyages across space boundaries.
- Dmitry Vostokov @ DumpAnalysis.org + TraceAnalysis.org
Posted in Debugging, Debugging Slang, Escalation Engineering, New Acronyms, Software Engineering, Software Narratology, Software Technical Support, Software Trace Analysis, Trace Analysis Patterns | 1 Comment »
Monday, May 3rd, 2010
Modern pattern-driven software trace analysis on Microsoft and Citrix platforms urgently requires a practical guide and OpenTask plans to publish this summer the following book in both Practical Foundations and Systematic Software Fault Analysis series:
- Title: Citrix Common Diagnostic Facility (CDF) and Microsoft Event Tracing for Windows (ETW) Software Trace Analysis: Practical Foundations
- Author: Dmitry Vostokov
- Publisher: Opentask (August 2010)
- Language: English
- Product Dimensions: 22.86 x 15.24
- ISBN: 1906717176
- ISBN-13: 978-1906717179
- Paperback: 200 pages
- Dmitry Vostokov @ DumpAnalysis.org + TraceAnalysis.org -
Posted in Announcements, Books, Citrix, Escalation Engineering, Publishing, Software Engineering, Software Technical Support, Software Trace Analysis, Software Tracing for Dummies, Testing, Tools, Trace Analysis Patterns, Training and Seminars, Windows System Administration | No Comments »
Sunday, May 2nd, 2010
c’t – Magazin für Computertechnik has published a review of First Fault Software Problem Solving book:
http://www.heise.de/ct/inhalt/2010/08/192/ (in German)
Fabian Röken kindly translated it into English:
No single large software package comes without errors. It seems that customers simply accept this, patiently waiting and hoping for patches or updates. Skwire sticks up for a more target-aimed approach: one will never get a faultless software, but it would already be a great improvement if flaws were already solved on their first occurrence (”first fault”) and not only after a long analysis (”second fault”).
The advantages are actually obvious. However, a corresponding stringent system architecture, as common on mainframes such as IBM’s z/OS, did not become prevalent in the PC market.
Skwire outlines the types of errors and strategies to resolve them in all details. His 40 years of experience, such as at IBM, shimmers through again and again. He puts emphasis on making sure that the reader understands the terminology he is using: “What is a problem in the first place?”, “What is a service point?” - in some cases he also explains specific metrics such as the “serviceability rating”.
His tool classification includes teaching tips, e.g. regarding the structure of a protocol in case of errors; or for tracking the important information how often an error must occur before a solution has to be approached. His suggestions equally address developers, designers, testers, managers - and the end user. In his last chapter he presents and reviews commercial tools in the first fault and second fault environment.
Skwire addresses a topic which is unfortunately very much neglected, and this alone already makes it worth enough to take a look at his book (***). Short quotations and humorous drawings relax the technical topic. If you are looking for an overview then you will be fine with this book. However, if you are a software developer looking for source code samples then you will search in vain. Skwire has released the book under the print-on-demand process. You will find it on Amazon, for example.
(Tobias Engler/fm)
- Dmitry Vostokov @ DumpAnalysis.org + TraceAnalysis.org -
Posted in Books, Escalation Engineering, First Fault Problem Solving, Software Engineering, Software Technical Support, Troubleshooting Methodology, Windows System Administration | No Comments »
Sunday, May 2nd, 2010
It is time to start being systematic. In addition to all-encompassing multi-volume Memory Dump Analysis Anthology OpenTask starts Systematic Software Fault Analysis series with Crash Dump Analysis: Practical Foundations as the first book. It introduces basic definitions, tools, memory dump collection and preliminary analysis methods for Windows platforms including legacy versions. This practical reference guide is a must have for system administrators of Windows server platforms and client workstations, technical support engineers and general Windows users. It builds foundation for the second book Crash Dump Analysis for System Administrators and Support Engineers and the remaining tetralogy books Windows Crash Dump Analysis and Advanced Windows Crash Dump Analysis.
Product information:
- Title: Crash Dump Analysis: Practical Foundations (Windows Edition, Systematic Software Fault Analysis Series)
- Authors: Dmitry Vostokov
- Publisher: Opentask (May 2010)
- Language: English
- Product Dimensions: 22.86 x 15.24
- ISBN-13: 978-1-906717-98-8
- Paperback: 100 pages
Fromt cover:
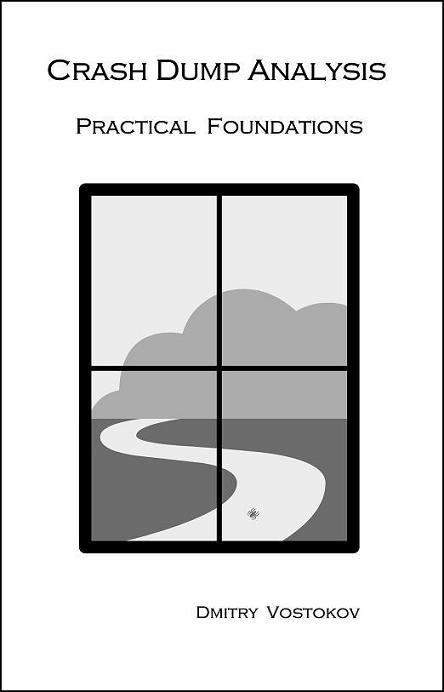
Table of Contents to be published soon.
- Dmitry Vostokov @ DumpAnalysis.org + TraceAnalysis.org -
Posted in Announcements, Books, Crash Dump Analysis, Crash Dumps for Dummies, Escalation Engineering, Publishing, Software Technical Support, Tools, Windows System Administration | No Comments »
Thursday, April 22nd, 2010
Forthcoming CARE and STARE online systems additionally aim to provide software behaviour pattern identification via debugger log and trace analysis and suggest possible software troubleshooting patterns. The purpose of these post series is to provide high level overview of possible patterns of software behavior and how they can be recognised and analyzed. This work started in October, 2006 with the identification of computer memory patterns and later continued with software trace patterns. Bringing all of them under a unified linked framework seems quite natural to me.
- Dmitry Vostokov @ DumpAnalysis.org + TraceAnalysis.org -
Posted in Computer Science, Crash Dump Analysis, Crash Dump Patterns, Escalation Engineering, Science of Memory Dump Analysis, Science of Software Tracing, Software Behavior Patterns, Software Engineering, Software Maintenance Institute, Software Technical Support, Software Trace Analysis, Software Troubleshooting Patterns, Trace Analysis Patterns | No Comments »
Tuesday, April 20th, 2010
The following tool published by Citrix follows DebugWare patterns in its overall architecture and design and was implemented by a team of engineers using RADII process:
SsOnExpert - Single Sign-On XenApp Plug-in Troubleshooting Tool
- Dmitry Vostokov @ DumpAnalysis.org + TraceAnalysis.org -
Posted in Announcements, Citrix, DebugWare Patterns, Debugging, Debugging Methodology, Escalation Engineering, Software Architecture, Software Engineering, Software Maintenance Institute, Software Technical Support, Tools, Troubleshooting Methodology | No Comments »
Sunday, April 18th, 2010
OpenTask to offer first 3 volumes of Memory Dump Analysis Anthology in one set:


The set is available exclusively from OpenTask e-Commerce web site starting from June. Individual volumes are also available from Amazon, Barnes & Noble and other bookstores worldwide.
Product information:
- Title: Modern Memory Dump and Software Trace Analysis: Volumes 1-3
- Author: Dmitry Vostokov
- Language: English
- Product Dimensions: 22.86 x 15.24
- Paperback: 1600 pages
- Publisher: Opentask (31 May 2010)
- ISBN-13: 978-1-906717-99-5
Information about individual volumes:
- Dmitry Vostokov @ DumpAnalysis.org + TraceAnalysis.org -
Posted in .NET Debugging, Aesthetics of Memory Dumps, Announcements, AntiPatterns, Art, Assembly Language, Books, Bugchecks Depicted, C and C++, CDA Pattern Classification, CDF Analysis Tips and Tricks, Categorical Debugging, Certification, Citrix, Code Reading, Common Mistakes, Computational Ghosts and Bug Hauntings, Computer Science, Countefactual Debugging, Crash Analysis Report Environment (CARE), Crash Dump Analysis, Crash Dump Patterns, Crash Dumps for Dummies, Data Recovery, DebugWare Patterns, Debugging, Debugging Methodology, Debugging Slang, Deep Down C++, Dictionary of Debugging, Dr. Watson, Education and Research, Escalation Engineering, Fun with Crash Dumps, Futuristic Memory Dump Analysis, GDB for WinDbg Users, Hardware, History, Horrors of Computation, Hyper-V, Intelligent Memory Movement, Kernel Development, Laws of Troubleshooting and Debugging, Mathematics of Debugging, Memiotics (Memory Semiotics), Memoidealism, Memoretics, Memory Analysis Culture, Memory Analysis Forensics and Intelligence, Memory Auralization, Memory Dump Analysis Jobs, Memory Religion (Memorianity), Memory Space Art, Memory Space Music, Memory Systems Language, Memory Visualization, Memuonics, Minidump Analysis, Multithreading, Music for Debugging, Music of Computation, New Acronyms, New Words, Occult Debugging, Philosophy, Psi-computation, Publishing, Science of Memory Dump Analysis, Science of Software Tracing, Security, Software Architecture, Software Defect Construction, Software Engineering, Software Generalist, Software Maintenance Institute, Software Narratology, Software Technical Support, Software Trace Analysis, Software Trace Visualization, Software Tracing for Dummies, Software Victimology, Stack Trace Collection, Testing, Tools, Trace Analysis Patterns, Training and Seminars, Troubleshooting Methodology, Victimware, Virtualization, Vista, Visual Dump Analysis, WinDbg Scripts, WinDbg Tips and Tricks, WinDbg for GDB Users, Windows 7, Windows Server 2008, Windows System Administration | No Comments »
Wednesday, April 14th, 2010
Time flows fast and I have refined my code I wrote at 6 year anniversary to include finer monthly tracing:
switch (months_at_citrix)

{

  case 60:

    write_blog_post(”I’ve just passed 5 year mark … “);

    wait_for_certificate();

    write_blog_post(”Shortly after celebrating 5 years … “);

    break;

  case 72:

    write_blog_post(”Threads in my process run very fast. Not long ago … “);

    break;

  case 78:

    write_blog_post(”Time flows fast and I have refined my code …“);

    break;

case 84:

    // … TBD

}
- Dmitry Vostokov @ DumpAnalysis.org + TraceAnalysis.org -
Posted in Announcements, Citrix, Crash Dump Analysis, Debugging, Escalation Engineering, History, Software Engineering, Software Technical Support, Software Trace Analysis | 1 Comment »