Archive for the ‘Software Narratology’ Category
Monday, March 25th, 2013
In the past we viewed software traces and logs as temporarily ordered event sequences. Since events are just memory data we have a map
T -> M
as can be seen in the definition of a software trace. Here we generalize the domain to any arbitrary set, for example, it can be a list of indexes or pointers or even memory itself. The latter map can give us narrative chains such as
M -> M -> M -> M
and even give us a grand unification of memory and log analysis and the possibility to apply software narratology to memory dump analysis as well. We talk about it soon and provide some generalized software narrative examples.
- Dmitry Vostokov @ DumpAnalysis.org + TraceAnalysis.org -
Posted in Crash Dump Analysis, Crash Dump Patterns, Log Analysis, Software Narrative Science, Software Narratology, Software Trace Analysis, Trace Analysis Patterns | No Comments »
Sunday, November 18th, 2012
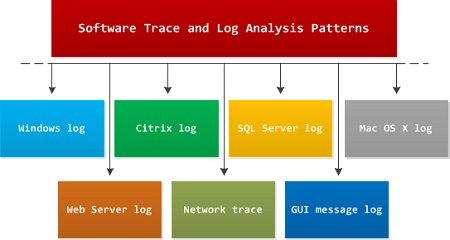
I get many questions on whether software log analysis patterns from Software Diagnostics Institute are OS or platform or product specific. My answer is that they are independent from all of them because they are based on viewing software logs as stories of computation and were discovered by application of narratological analysis (software narratology). In addition to these patterns there exist domain specific problem patterns such as wrong hotfix level or specific product error code during software installation or execution. Typical examples of support for such platform and product specific type of patterns include Microsoft Windows Problem Reporting and Citrix Auto Support.
- Dmitry Vostokov @ DumpAnalysis.org + TraceAnalysis.org -
Posted in Announcements, Debugging, Software Diagnostics, Software Narratology, Software Trace Analysis, Trace Analysis Patterns | No Comments »
Saturday, November 3rd, 2012
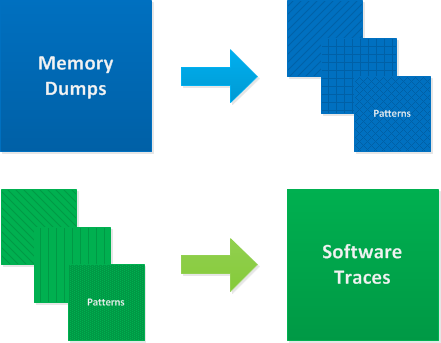
Doing memory dump analysis training for more than 2 years I found that students are divided into 2 types: those who prefer to see source code first and those who want to see a memory dump first. We actually prefer to show a memory dump first and then explore it to find certain patterns of abnormal structure and behavior. Software Diagnostics Services used this approach to design its Accelerated Windows Memory Dump Analysis and Accelerated .NET Memory Dump Analysis courses. Students explore memory dumps and debugger logs to find memory dump analysis patterns which are introduced when necessary. After that they can check source code of modeling applications if they have development experience. Accelerated Windows Software Trace Analysis course uses a different approach. It introduces all software trace analysis patterns at once because they are patterns from software narratology independent from programming languages and software platforms. After that they explore and analyze software traces and logs. We can summarize these 2 approaches on this diagram:
- Dmitry Vostokov @ DumpAnalysis.org + TraceAnalysis.org -
Posted in Crash Dump Analysis, Crash Dump Patterns, Software Diagnostics, Software Narratology, Software Trace Analysis, Trace Analysis Patterns, Training and Seminars | No Comments »
Monday, October 8th, 2012
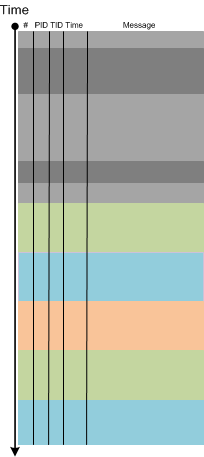
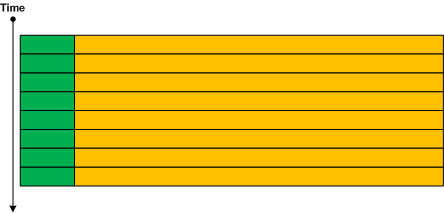
Periodic Message Block is similar to Periodic Error but not limited to errors or failure reports. One such example we recently encountered is when some adjoint activity (such as messages from specific PID) stop to appear after the middle of the trace and after that there are repeated blocks of similar messages from different PIDs with their threads checking for some condition (waiting for event and reporting timeouts):
- Dmitry Vostokov @ DumpAnalysis.org + TraceAnalysis.org -
Forthcoming Accelerated Windows Software Trace Analysis Training.
Posted in Debugging, Software Diagnostics, Software Narratology, Software Trace Analysis, Software Trace Reading, Trace Analysis Patterns | 1 Comment »
Wednesday, September 26th, 2012
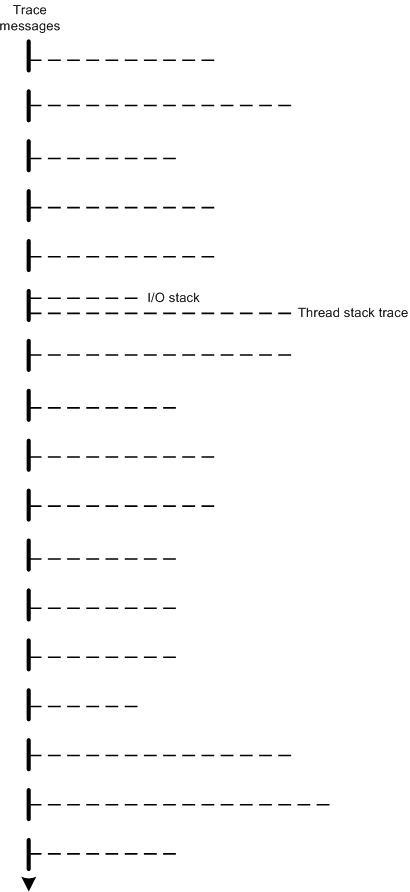
The modern software trace recording, visualization and analysis tools such as Process Monitor, Xperf, WPR and WPA provide stack traces associated with trace messages. Consider stack traces as software traces we have, in a more general case, traces (fibers) bundled together on (attached to) a base software trace. For example, a trace message, that mentions an IRP can have its I/O stack attached together with thread stack trace with function calls leading to a function that emitted the trace message. Another example is association of different types of traces with trace messages such as managed and unmanaged ones. This general trace analysis pattern needs a name so we opted for Fiber Bundle as analogy with a fiber bundle from mathematics. Here’s a graphical representation of stack traces recorded for each trace message where one message also has an associated I/O stack trace:
- Dmitry Vostokov @ DumpAnalysis.org + TraceAnalysis.org -
Posted in Debugging, Event Tracing for Windows (ETW), Performance Monitoring, Software Diagnostics, Software Narratology, Software Trace Analysis, Software Trace Reading, Software Trace Visualization, Trace Analysis Patterns | 1 Comment »
Thursday, July 19th, 2012
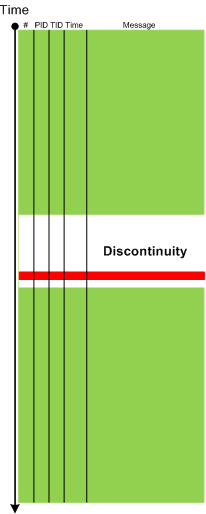
After some thinking I’ve decided to apply software trace analysis pattern approach to network trace analysis which lacks a unified pattern language. Here I consider a network trace as essentially a software trace where packet headers represent software trace messages coupled with associated transmitted data:
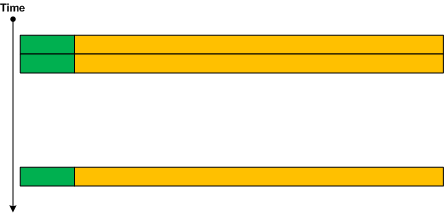
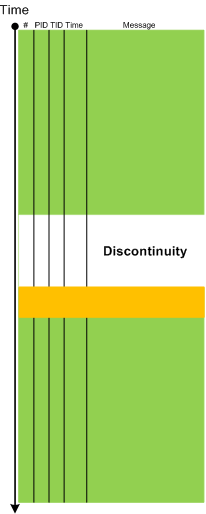
Since we have a trace message stream formatted by a network trace visualization tool we can apply most if not all trace analysis patterns for diagnostics including software narratology for interpretation, discourse and different representations. We provide a few trivial examples here and more in subsequent parts. The first example is Discontinuity pattern:
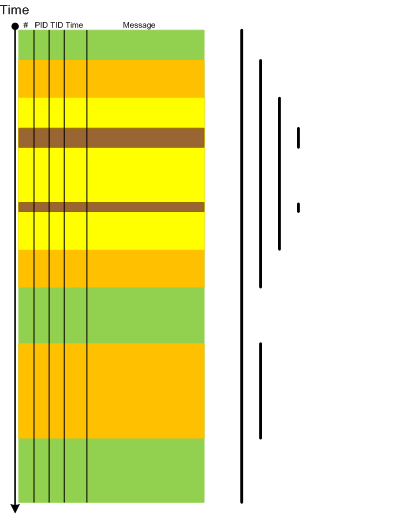
Other similar patterns are No Activity, Truncated Trace and Time Delta. The second example is Anchor Messages:
Additional example there include Significant Event and Bifurcation Point patterns. Layered protocols are represented through Embedded Message pattern (to be described and added to the pattern list soon). Such traces can be filtered for their embedded protocol headers and therefore naturally represent Adjoint Thread pattern (for the more detailed description of adjoint threads as extension of multithreading please see the article What is an Adjoint Thread):
 - Dmitry Vostokov @ DumpAnalysis.org + TraceAnalysis.org -
Posted in Network Trace Analysis Patterns, Software Behavior Patterns, Software Diagnostics, Software Diagnostics Pattern Language, Software Diagnostics Patterns, Software Narratology, Software Trace Analysis | No Comments »
Tuesday, July 3rd, 2012
When depicting trace analysis patterns I used two-dimensional diagrams based on CDF (ETW) traces such as this one for a bifurcation point:

While working today on a new pattern I needed a new expressive way to graphically illustrate the same idea of trace bifurcation points but without too much drawing. Traces from particle chambers and scattering diagrams came to my imagination after draw the first few diagrams illustrating bifurcation points:

Time directional arrow end can be omitted:

Trace variation after a bifurcation point can be indicated by angle partition:

The case when a variation also happens before is illustrated on this diagram:

and the case with several bifurcations:

Are N-bifurcations like on the diagram below possible?

Yes, they are, if the course of execution depends on some non-binary trace message parameter such as a loaded module that implements a required interface differently.
- Dmitry Vostokov @ DumpAnalysis.org + TraceAnalysis.org -
Posted in CDF Analysis Tips and Tricks, Event Tracing for Windows (ETW), Science of Software Tracing, Software Narratology, Software Trace Analysis, Software Trace Diagramming, Software Trace Visualization, Trace Analysis Patterns | 1 Comment »
Tuesday, June 5th, 2012
-
Motivated by 7 Habits of Highly Effective Debuggers I would like to reflect on a distinction between diagnostics and problem solving as separate processes (although highly related). First, we reverse the precept from that article because stories such as software logs and traces are of primary importance to software diagnostics (and not only). And without diagnostics there is no effective debugging (treatment, problem solving, etc.)
The Principle Precept of Diagnostics
Stories NOT Statistics secure certainty.
Next parts will be about actual habits so please stay tuned. I would try to finish this list before the forthcoming Webinar on software diagnostics.
- Dmitry Vostokov @ DumpAnalysis.org + TraceAnalysis.org -
Posted in 7 Habits, Core Dump Analysis, Crash Dump Analysis, Escalation Engineering, Software Diagnostics, Software Engineering, Software Narratology, Software Problem Solving, Software Technical Support, Software Trace Analysis | No Comments »
Sunday, June 3rd, 2012
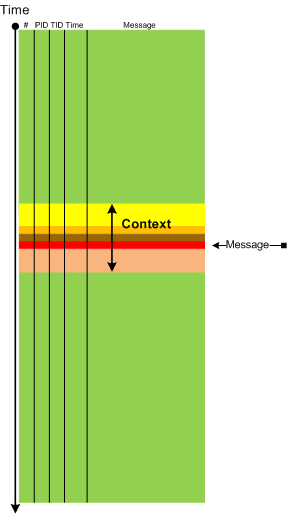
In some cases it is useful to consider Message Context: a set of surrounding messages having some relation to the chosen message:
- Dmitry Vostokov @ DumpAnalysis.org + TraceAnalysis.org -
Posted in Debugging, Software Narratology, Software Trace Analysis, Software Trace Reading, Trace Analysis Patterns | 2 Comments »
Sunday, June 3rd, 2012
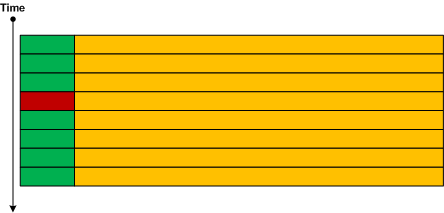
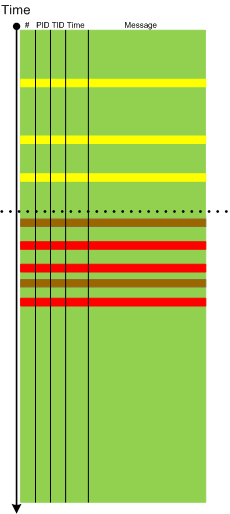
Sometimes we need to pay attention to Error Distribution, for example, the distribution of the same error across a software log space or different error messages in different parts of the same software log or trace (providing effective partition):
- Dmitry Vostokov @ DumpAnalysis.org + TraceAnalysis.org -
Posted in Debugging, Software Narratology, Software Trace Analysis, Software Trace Reading, Trace Analysis Patterns | 1 Comment »
Saturday, June 2nd, 2012
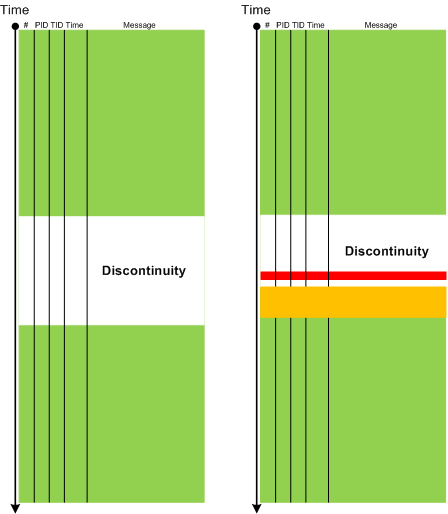
If Break-in Activity is usually unrelated to a thread or an adjoint thread which has a discontinuity then Resume Activity pattern highlights messages from that thread:
The difference can be seen on the following graphical representation of two traces we analyzed where in a working trace a break-in preceded resume activity whereas in a non-working trace both patterns were absent:
- Dmitry Vostokov @ DumpAnalysis.org + TraceAnalysis.org -
Posted in Debugging, Software Narratology, Software Trace Analysis, Software Trace Reading, Trace Analysis Patterns | No Comments »
Saturday, June 2nd, 2012
We resume our software trace analysis pattern catalog. The next pattern is called Break-in Activity. This is a message or a set of messages that surface just before the end of discontinuity of a adjoint thread and possibly triggered it:
- Dmitry Vostokov @ DumpAnalysis.org + TraceAnalysis.org -
Posted in Debugging, Software Narratology, Software Trace Analysis, Software Trace Reading, Trace Analysis Patterns | 1 Comment »
Sunday, April 15th, 2012
In a week this short full color book should appear in online bookstores:
- Title: Software Narratology: An Introduction to the Applied Science of Software Stories
- Authors: Dmitry Vostokov, Memory Dump Analysis Services
- Description: This is a transcript of Memory Dump Analysis Services Webinar about Software Narratology: an exciting new discipline and a field of research founded by DumpAnalysis.org. When software executes it gives us its stories in the form of UI events, software traces and logs. Such stories can be analyzed for their structure and patterns for troubleshooting, debugging and problem resolution purposes. Topics also include software narremes and their types, anticipatory software construction and software diagnostics.
- Publisher: OpenTask (April 2012)
- Language: English
- Product Dimensions: 28.0 x 21.6
- Paperback: 26 pages
- ISBN-13: 978-1908043078

- Dmitry Vostokov @ DumpAnalysis.org + TraceAnalysis.org -
Posted in Announcements, Books, CDF Analysis Tips and Tricks, Code Reading, Computer Science, Debugging, Debugging Methodology, Debugging Trends, Education and Research, Escalation Engineering, Event Tracing for Windows (ETW), Hermeneutics of Memory Dumps and Traces, Ideas, Narralog Programming Language, New Debugging School, Pattern-Driven Debugging, Pattern-Driven Software Support, Presentations, Publishing, Root Cause Analysis, SPDL, Science of Software Tracing, Software Behavior DNA, Software Behavior Patterns, Software Behavioral Genome, Software Diagnostics, Software Engineering, Software Narrative Fiction, Software Narrative Science, Software Narratology, Software Narremes, Software Problem Description Patterns, Software Problem Solving, Software Technical Support, Software Trace Analysis, Software Trace Analysis and History, Software Trace Deconstruction, Software Trace Linguistics, Software Trace Modeling, Software Trace Reading, Software Trace Visualization, Software Tracing Implementation Patterns, Software Troubleshooting Patterns, Structural Trace Patterns, Systems Thinking, Testing, Tools, Trace Analysis Patterns, Training and Seminars, Troubleshooting Methodology, UI Problem Analysis Patterns, Unified Debugging Patterns, Unified Software Diagnostics, Webinars | No Comments »
Monday, April 9th, 2012
Memory Dump Analysis Services organizes a free Webinar on Unified Software Diagnostics (USD) and the new scalable cost-effective software support model called Pattern-Driven Software Support devised to address various shortcomings in existing tiered software support organizations. Examples cover Windows, Mac OS and Linux.

Date: 22nd of June, 2012
Time: 17:00 (BST) 12:00 (EST) 09:00 (PST)
Duration: 60 minutes
Space is limited.
Reserve your Webinar seat now at:
https://www3.gotomeeting.com/register/172771078
- Dmitry Vostokov @ DumpAnalysis.org + TraceAnalysis.org -
Posted in Announcements, Best Practices, Crash Dump Analysis, Crash Dump Patterns, Debugging, Debugging Methodology, Debugging Trends, Economics, Escalation Engineering, Event Tracing for Windows (ETW), JIT Crash Analysis, JIT Memory Space Analysis, Malware Analysis, Malware Patterns, Memoretics, Memory Analysis Forensics and Intelligence, Memory Dump Analysis Methodology, Memory Dump Analysis Services, New Acronyms, New Debugging School, Pattern Prediction, Pattern-Driven Debugging, Pattern-Driven Software Support, Root Cause Analysis, Science of Memory Dump Analysis, Science of Software Tracing, Software Behavior DNA, Software Behavior Patterns, Software Behavioral Genome, Software Diagnostics, Software Engineering, Software Narratology, Software Problem Description Patterns, Software Problem Solving, Software Support Patterns, Software Technical Support, Software Trace Analysis, Software Troubleshooting Patterns, Software Victimology, Software and Economics, Structural Memory Patterns, Structural Trace Patterns, Systems Thinking, Testing, Tools, Trace Analysis Patterns, Training and Seminars, Troubleshooting Methodology, UI Problem Analysis Patterns, Unified Debugging Patterns, Unified Software Diagnostics, Victimware, Webinars, Workaround Patterns | No Comments »
Thursday, March 22nd, 2012
Narrative theory distinguishes between frame types such as (Fludernik, McHale, Nelles, Wolf):
- introductory framing (missing end frame) [—————————-
- terminal framing (missing opening frame) —————————-]
- [—————————-]
- interpolated framing [—-[ ]—-[ ]——–]
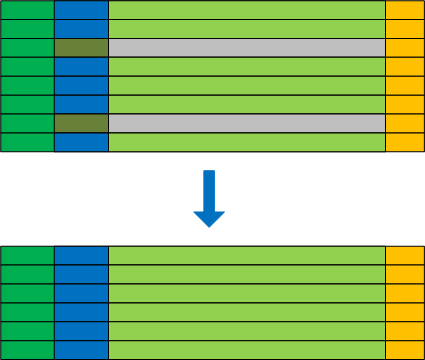
At the level of the software trace or an adjoint thread as a whole the first 3 types correspond to various types of this pattern Partition: Head, Prologue, Core, Epilogue, Tail where certain parts are missing. The first 2 types can also be instances of Truncated Trace pattern. Interpolated framing can be an instance of multiple discontinuities. All 4 types also correspond to foreground component messages and in general we have multiple Trace Frames as depicted:
- Dmitry Vostokov @ DumpAnalysis.org + TraceAnalysis.org -
Posted in CDF Analysis Tips and Tricks, Debugging, Software Narratology, Software Trace Analysis, Software Trace Reading, Trace Analysis Patterns | No Comments »
Tuesday, March 20th, 2012
The previous definition of software narratology was restricted to software traces and logs (the top left quadrant on a software narrative square, also the part of Memoretics which studies memory snapshots). Now, with the broadening of the domain of software narratology to the whole world of software narrative stories including actor interactions with software in construction requirements use cases and post-construction incidents we give another definition:
Software narrative is a representation of software events and changes of state. Software Narratology is a discipline that studies such software narratives (software narrative science).
- Dmitry Vostokov @ DumpAnalysis.org + TraceAnalysis.org -
Posted in Announcements, Cloud Computing, Code Reading, Computer Forensics, Computer Science, Crash Dump Analysis, Crash Dump Patterns, Debugging, Memoretics, Science of Memory Dump Analysis, Science of Software Tracing, Software Behavior DNA, Software Behavior Patterns, Software Behavioral Genome, Software Engineering, Software Narrative Science, Software Narratology, Software Narremes, Software Problem Description Patterns, Software Problem Solving, Software Technical Support, Software Trace Analysis, Software Trace Deconstruction, Software Trace Modeling, Software Trace Reading, Structural Trace Patterns, Testing, Trace Analysis Patterns | No Comments »
Sunday, March 11th, 2012
Software narratological approach can be useful for writing, analyzing and validating historical narratives. Trace and event log messages play the role of historical events where process ids are assigned to particular historical institutions and their representatives. Threads serve the role of historical entities like persons. Modules play the role of shared ideologies. We already use this approach for writing history books.
This can also work on a different level such as analyzing a history of debugging as a sequence of troubleshooting and debugging stories. More on this later as I plan to provide concrete examples from history. For the time being please read how software narratology and memoretics (the study of memory snapshots) help fiction writers as well.
- Dmitry Vostokov @ DumpAnalysis.org + TraceAnalysis.org -
Posted in General Memory Analysis, Hermeneutics of Memory Dumps and Traces, History, Social Sciences, Software Narratology, Software Trace Analysis and History, Structural Memory Analysis and Social Sciences | No Comments »
Sunday, March 11th, 2012
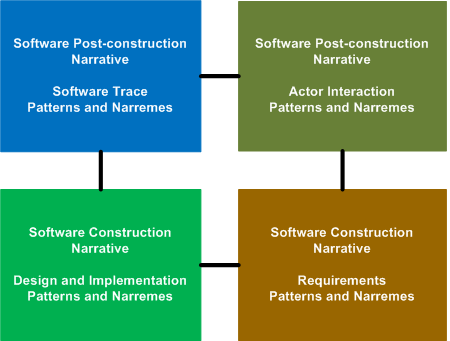
After introducing software narrative planes it is logical to expand the field of software narratology to cover the whole domain of software construction and post-construction. We therefore combine both pairs of planes to create a narratological square:
Please also register for the forthcoming free Webinar: Introduction to Software Narratology where I plan to provide a coherent overview of the recent developments in this new field.
- Dmitry Vostokov @ DumpAnalysis.org + TraceAnalysis.org -
Posted in Computer Science, Debugging, Science of Software Tracing, Software Engineering, Software Narrative Science, Software Narratology, Software Narremes, Software Problem Description Patterns, Software Problem Solving, Software Trace Analysis | No Comments »
Sunday, March 11th, 2012
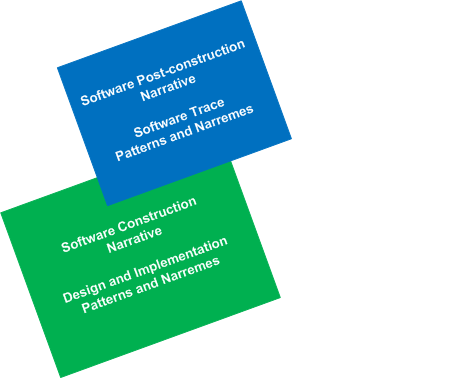
Based on an idea of expression and content planes from glossematics with a basic unit of glosseme we can organize software traces with corresponding patterns and software trace narremes (basic units of software narrative such as traces and event logs) into 2 planes: software trace narrative plane (expression) with narremes and the corresponding program lines of traces (PLOTs) source code and design plane (content) with their own set of construction narremes such as collaboration of software constructs. All this corresponds to the following diagram:
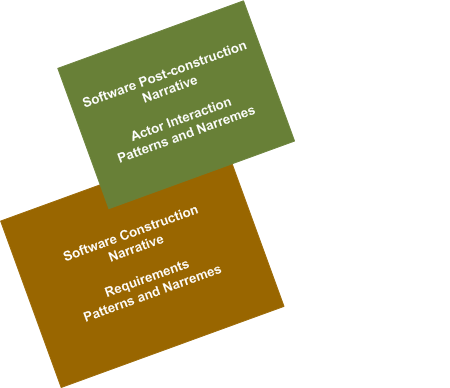
The same can be said about actor interaction level of software construction (what ought to be) and post-construction (what is) phases having their own construction and post-construction narratives, patterns and narremes such as in requirements (use cases) and in problem and software incident descriptions:
In the forthcoming articles I provide more examples and explanations including specific software narremes useful from the practical post-construction software problem solving perspective. Please also register for the forthcoming free Webinar: Introduction to Software Narratology where I plan to provide a coherent overview of this new field.
- Dmitry Vostokov @ DumpAnalysis.org + TraceAnalysis.org -
Posted in Computer Science, Science of Software Tracing, Software Narratology, Software Narremes, Software Problem Solving, Software Trace Analysis, Software Trace Linguistics | No Comments »
Sunday, February 19th, 2012
Memory Dump Analysis Services (DumpAnalysis.com) organizes a free Webinar about software narratology: an application of ideas from narratology to software narrative stories.

Learn about this exciting new discipline and a field of research. When software executes it gives us its stories in the form of UI events, software traces and logs. Such stories can be analyzed for their structure and patterns for troubleshooting, debugging and problem resolution purposes.
Prerequisites: basic software troubleshooting and ability to read software generated logs.
Audience: anyone can benefit from this new perspective: from software users to software engineers and managers.
Space is limited.
Reserve your Webinar seat now at:
https://www3.gotomeeting.com/register/603136294
- Dmitry Vostokov @ DumpAnalysis.org + TraceAnalysis.org -
Posted in Announcements, Computer Science, Debugging, Escalation Engineering, Intelligence Analysis Patterns, Memory Dump Analysis Services, SPDL, Science of Software Tracing, Security, Software Behavior DNA, Software Behavior Patterns, Software Behavioral Genome, Software Engineering, Software Narrative Fiction, Software Narratology, Software Problem Description Patterns, Software Problem Solving, Software Technical Support, Software Trace Analysis, Software Trace Deconstruction, Software Trace Linguistics, Software Trace Modeling, Software Trace Reading, Software Trace Visualization, Software Tracing Implementation Patterns, Software Tracing for Dummies, Software Troubleshooting Patterns, Software Victimology, Structural Trace Patterns, Testing, Tools, Trace Analysis Patterns, Troubleshooting Methodology, UI Problem Analysis Patterns, Unified Debugging Patterns, Unit Testing, Victimware, Webinars, Windows System Administration | No Comments »