Archive for the ‘Software Engineering’ Category
Wednesday, June 16th, 2010
Adding AI. Analysis Improvement.
After reading earlier today Windows Internals pages about system audit an idea came to my mind in the evening to provide audit services for memory dump and software trace analysis. One mind is good but two are better, especially if the second is a pattern-driven AI. Here are possible problem scenarios:
Problem: You are not satisfied with a crash report.
Problem: Your critical issue is escalated to the VP level. Engineers analyze memory dumps and software traces. No definite conclusion so far. You want to be sure that nothing has been omitted from the analysis.
Problem: You analyze a system dump or a software trace. You need a second pair of eyes but don’t want to send your memory dump due to your company security policies.
Other scenarios (use cases) will be added as soon as I see the service fit to the realities of software technical support.
I plan to make this service operational in July - August, 2010. Prices to be announced soon.
- Dmitry Vostokov @ DumpAnalysis.org + TraceAnalysis.org -
Posted in .NET Debugging, Announcements, Common Mistakes, Complete Memory Dump Analysis, Crash Analysis Report Environment (CARE), Crash Dump Analysis, Crash Dump De-analysis, Crash Dump Patterns, Debugging, Escalation Engineering, Minidump Analysis, Software Behavior Patterns, Software Engineering, Software Technical Support, Software Trace Analysis, Software Troubleshooting Patterns, Tools, Trace Analysis Patterns | 1 Comment »
Sunday, June 13th, 2010
By analogy with paratext let’s introduce a software narratological concept of the extended software trace that consists of a software trace plus additional supporting information that makes troubleshooting and debugging easier. Such “paratextual” information can consists of pictures, videos, accounts of scenarios and past problem histories, customer interviews and even software trace delivery medium and format (if preformatted).
- Dmitry Vostokov @ DumpAnalysis.org + TraceAnalysis.org -
Posted in Debugging, Debugging Methodology, Escalation Engineering, Science of Software Tracing, Software Engineering, Software Narratology, Software Technical Support, Software Trace Analysis, Software Trace Reading | 1 Comment »
Tuesday, May 25th, 2010
Finally Citrix has published a tool (written by my colleague Colm Naish, lead escalation engineer) that allows controlled injection of events into CDF (ETW) trace message stream. This is useful in many troubleshooting scenarios where we need to rely on Significant Event and Anchor Message analysis patterns to partition traces into artificial Activity Regions to start our analysis with. This is also analogous for the imposition of the external time on the stream of tracing events from software narratology perspective:
CDFMarker On Demand - For XenApp and XenDesktop
- Dmitry Vostokov @ DumpAnalysis.org + TraceAnalysis.org -
Posted in Announcements, CDF Analysis Tips and Tricks, Citrix, Debugging, Escalation Engineering, Software Engineering, Software Narratology, Software Technical Support, Software Trace Analysis, Software Trace Reading, Tools, Trace Analysis Patterns | 1 Comment »
Monday, May 10th, 2010
My drive to generalization led me to place an adornment on the portal to highlight the fact that memory and software trace analysis patterns are under an umbrella of general software behaviour patterns:
http://www.dumpanalysis.org/Software-Behavior-Patterns-Headline
In the forthcoming post series I plan to write about similarities between these two branches and also provide pattern examples from non-Windows platforms. All this material will provide the foundation for the forthcoming book Software Behavior: A Guide to Systematic Analysis (ISBN: 978-1906717162).
- Dmitry Vostokov @ DumpAnalysis.org + TraceAnalysis.org -
Posted in Announcements, Computer Science, Crash Dump Analysis, Crash Dump Patterns, Debugging, Escalation Engineering, Memiotics (Memory Semiotics), Memoretics, Science of Memory Dump Analysis, Science of Software Tracing, Software Behavior Patterns, Software Engineering, Software Maintenance Institute, Software Technical Support, Software Trace Analysis, Software Troubleshooting Patterns, Trace Analysis Patterns | No Comments »
Thursday, May 6th, 2010
Befind every trace and its messages is source code:
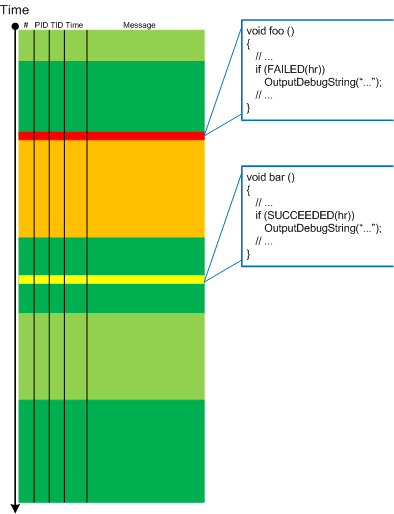
Borrowing the acronym PLOT (Program Lines of Trace) we now try to discern basic source code patterns that give rise to simple message patterns in software traces. There are only a few distinct PLOTs and the ability to mentally map trace statements to source code is crucial to software trace reading and comprehension. More about that in subsequent parts. More complex message patterns (for example, specific message blocks or correlated messages) arise from supportable and maintainable realizations of architectural, design and implementation patterns and will be covered in another post series.
I was thinking about acronym SLOT (Source Lines of Trace) but decided to use PLOT because it metaphorically bijects into literary theory and narrative plots.
Forthcoming CDF and ETW Software Trace Analysis: Practical Foundations
- Dmitry Vostokov @ DumpAnalysis.org + TraceAnalysis.org
Posted in C and C++, CDF Analysis Tips and Tricks, Code Reading, Debugging, Science of Software Tracing, Software Architecture, Software Engineering, Software Narratology, Software Trace Analysis, Software Trace Reading | 2 Comments »
Wednesday, May 5th, 2010
PLOT - Program Lines of Trace - the source code lines behind trace messages
Examples: What a plot do we have here! The struggle against the monster database component and endless voyages across space boundaries.
- Dmitry Vostokov @ DumpAnalysis.org + TraceAnalysis.org
Posted in Debugging, Debugging Slang, Escalation Engineering, New Acronyms, Software Engineering, Software Narratology, Software Technical Support, Software Trace Analysis, Trace Analysis Patterns | 1 Comment »
Monday, May 3rd, 2010
Modern pattern-driven software trace analysis on Microsoft and Citrix platforms urgently requires a practical guide and OpenTask plans to publish this summer the following book in both Practical Foundations and Systematic Software Fault Analysis series:
- Title: Citrix Common Diagnostic Facility (CDF) and Microsoft Event Tracing for Windows (ETW) Software Trace Analysis: Practical Foundations
- Author: Dmitry Vostokov
- Publisher: Opentask (August 2010)
- Language: English
- Product Dimensions: 22.86 x 15.24
- ISBN: 1906717176
- ISBN-13: 978-1906717179
- Paperback: 200 pages
- Dmitry Vostokov @ DumpAnalysis.org + TraceAnalysis.org -
Posted in Announcements, Books, Citrix, Escalation Engineering, Publishing, Software Engineering, Software Technical Support, Software Trace Analysis, Software Tracing for Dummies, Testing, Tools, Trace Analysis Patterns, Training and Seminars, Windows System Administration | No Comments »
Sunday, May 2nd, 2010
c’t – Magazin für Computertechnik has published a review of First Fault Software Problem Solving book:
http://www.heise.de/ct/inhalt/2010/08/192/ (in German)
Fabian Röken kindly translated it into English:
No single large software package comes without errors. It seems that customers simply accept this, patiently waiting and hoping for patches or updates. Skwire sticks up for a more target-aimed approach: one will never get a faultless software, but it would already be a great improvement if flaws were already solved on their first occurrence (”first fault”) and not only after a long analysis (”second fault”).
The advantages are actually obvious. However, a corresponding stringent system architecture, as common on mainframes such as IBM’s z/OS, did not become prevalent in the PC market.
Skwire outlines the types of errors and strategies to resolve them in all details. His 40 years of experience, such as at IBM, shimmers through again and again. He puts emphasis on making sure that the reader understands the terminology he is using: “What is a problem in the first place?”, “What is a service point?” - in some cases he also explains specific metrics such as the “serviceability rating”.
His tool classification includes teaching tips, e.g. regarding the structure of a protocol in case of errors; or for tracking the important information how often an error must occur before a solution has to be approached. His suggestions equally address developers, designers, testers, managers - and the end user. In his last chapter he presents and reviews commercial tools in the first fault and second fault environment.
Skwire addresses a topic which is unfortunately very much neglected, and this alone already makes it worth enough to take a look at his book (***). Short quotations and humorous drawings relax the technical topic. If you are looking for an overview then you will be fine with this book. However, if you are a software developer looking for source code samples then you will search in vain. Skwire has released the book under the print-on-demand process. You will find it on Amazon, for example.
(Tobias Engler/fm)
- Dmitry Vostokov @ DumpAnalysis.org + TraceAnalysis.org -
Posted in Books, Escalation Engineering, First Fault Problem Solving, Software Engineering, Software Technical Support, Troubleshooting Methodology, Windows System Administration | No Comments »
Thursday, April 22nd, 2010
Forthcoming CARE and STARE online systems additionally aim to provide software behaviour pattern identification via debugger log and trace analysis and suggest possible software troubleshooting patterns. The purpose of these post series is to provide high level overview of possible patterns of software behavior and how they can be recognised and analyzed. This work started in October, 2006 with the identification of computer memory patterns and later continued with software trace patterns. Bringing all of them under a unified linked framework seems quite natural to me.
- Dmitry Vostokov @ DumpAnalysis.org + TraceAnalysis.org -
Posted in Computer Science, Crash Dump Analysis, Crash Dump Patterns, Escalation Engineering, Science of Memory Dump Analysis, Science of Software Tracing, Software Behavior Patterns, Software Engineering, Software Maintenance Institute, Software Technical Support, Software Trace Analysis, Software Troubleshooting Patterns, Trace Analysis Patterns | No Comments »
Tuesday, April 20th, 2010
The following tool published by Citrix follows DebugWare patterns in its overall architecture and design and was implemented by a team of engineers using RADII process:
SsOnExpert - Single Sign-On XenApp Plug-in Troubleshooting Tool
- Dmitry Vostokov @ DumpAnalysis.org + TraceAnalysis.org -
Posted in Announcements, Citrix, DebugWare Patterns, Debugging, Debugging Methodology, Escalation Engineering, Software Architecture, Software Engineering, Software Maintenance Institute, Software Technical Support, Tools, Troubleshooting Methodology | No Comments »
Sunday, April 18th, 2010
OpenTask to offer first 3 volumes of Memory Dump Analysis Anthology in one set:


The set is available exclusively from OpenTask e-Commerce web site starting from June. Individual volumes are also available from Amazon, Barnes & Noble and other bookstores worldwide.
Product information:
- Title: Modern Memory Dump and Software Trace Analysis: Volumes 1-3
- Author: Dmitry Vostokov
- Language: English
- Product Dimensions: 22.86 x 15.24
- Paperback: 1600 pages
- Publisher: Opentask (31 May 2010)
- ISBN-13: 978-1-906717-99-5
Information about individual volumes:
- Dmitry Vostokov @ DumpAnalysis.org + TraceAnalysis.org -
Posted in .NET Debugging, Aesthetics of Memory Dumps, Announcements, AntiPatterns, Art, Assembly Language, Books, Bugchecks Depicted, C and C++, CDA Pattern Classification, CDF Analysis Tips and Tricks, Categorical Debugging, Certification, Citrix, Code Reading, Common Mistakes, Computational Ghosts and Bug Hauntings, Computer Science, Countefactual Debugging, Crash Analysis Report Environment (CARE), Crash Dump Analysis, Crash Dump Patterns, Crash Dumps for Dummies, Data Recovery, DebugWare Patterns, Debugging, Debugging Methodology, Debugging Slang, Deep Down C++, Dictionary of Debugging, Dr. Watson, Education and Research, Escalation Engineering, Fun with Crash Dumps, Futuristic Memory Dump Analysis, GDB for WinDbg Users, Hardware, History, Horrors of Computation, Hyper-V, Intelligent Memory Movement, Kernel Development, Laws of Troubleshooting and Debugging, Mathematics of Debugging, Memiotics (Memory Semiotics), Memoidealism, Memoretics, Memory Analysis Culture, Memory Analysis Forensics and Intelligence, Memory Auralization, Memory Dump Analysis Jobs, Memory Religion (Memorianity), Memory Space Art, Memory Space Music, Memory Systems Language, Memory Visualization, Memuonics, Minidump Analysis, Multithreading, Music for Debugging, Music of Computation, New Acronyms, New Words, Occult Debugging, Philosophy, Psi-computation, Publishing, Science of Memory Dump Analysis, Science of Software Tracing, Security, Software Architecture, Software Defect Construction, Software Engineering, Software Generalist, Software Maintenance Institute, Software Narratology, Software Technical Support, Software Trace Analysis, Software Trace Visualization, Software Tracing for Dummies, Software Victimology, Stack Trace Collection, Testing, Tools, Trace Analysis Patterns, Training and Seminars, Troubleshooting Methodology, Victimware, Virtualization, Vista, Visual Dump Analysis, WinDbg Scripts, WinDbg Tips and Tricks, WinDbg for GDB Users, Windows 7, Windows Server 2008, Windows System Administration | No Comments »
Wednesday, April 14th, 2010
Time flows fast and I have refined my code I wrote at 6 year anniversary to include finer monthly tracing:
switch (months_at_citrix)

{

  case 60:

    write_blog_post(”I’ve just passed 5 year mark … “);

    wait_for_certificate();

    write_blog_post(”Shortly after celebrating 5 years … “);

    break;

  case 72:

    write_blog_post(”Threads in my process run very fast. Not long ago … “);

    break;

  case 78:

    write_blog_post(”Time flows fast and I have refined my code …“);

    break;

case 84:

    // … TBD

}
- Dmitry Vostokov @ DumpAnalysis.org + TraceAnalysis.org -
Posted in Announcements, Citrix, Crash Dump Analysis, Debugging, Escalation Engineering, History, Software Engineering, Software Technical Support, Software Trace Analysis | 1 Comment »
Tuesday, April 13th, 2010
.SYS - Sponsor YourSelf or Sponsor YourSelves.
Examples: I’m developing a fantastic project.SYS
- Dmitry Vostokov @ DumpAnalysis.org + TraceAnalysis.org -
Posted in Debugging Slang, Escalation Engineering, Software Engineering, Software Technical Support, Tools | No Comments »
Friday, April 9th, 2010
Plan to start providing training and seminars in my free time. If you are interested please answer these questions (you can either respond here in comments or use this form for private communication http://www.dumpanalysis.org/contact):
- Are you interested in on-site training, prefer traveling or attending webinars?
- Are you interested in software trace analysis as well?
- What specific topics are you interested in?
- What training level (beginner, intermediate, advanced) are you interested in? (please provide an example, if possible)
Additional topics of expertise that can be integrated into training include Source Code Reading and Analysis, Debugging, Windows Architecture, Device Drivers, Troubleshooting Tools Design and Implementation, Multithreading, Deep Down C and C++, x86 and x64 Assembly Language Reading.
Looking forward to your responses. Any suggestions are welcome.
- Dmitry Vostokov @ DumpAnalysis.org + TraceAnalysis.org -
Posted in .NET Debugging, Announcements, AntiPatterns, Assembly Language, Bugchecks Depicted, C and C++, CDA Pattern Classification, CDF Analysis Tips and Tricks, Certification, Code Reading, Common Mistakes, Crash Analysis Report Environment (CARE), Crash Dump Analysis, Crash Dump Patterns, Crash Dumps for Dummies, Data Recovery, DebugWare Patterns, Debugging, Debugging Methodology, Deep Down C++, Education and Research, Escalation Engineering, FreeBSD Crash Corner, GDB for WinDbg Users, Hardware, Hyper-V, Java Debugging, Kernel Development, Laws of Troubleshooting and Debugging, Linux Crash Corner, Mac Crash Corner, Memory Analysis Forensics and Intelligence, Memory Visualization, Minidump Analysis, Multithreading, Security, Software Architecture, Software Defect Construction, Software Engineering, Software Generalist, Software Maintenance Institute, Software Narratology, Software Technical Support, Software Trace Analysis, Software Trace Visualization, Software Tracing for Dummies, Software Victimology, Stack Trace Collection, Testing, Tools, Trace Analysis Patterns, Training and Seminars, Troubleshooting Methodology, Victimware, Virtualization, Vista, Visual Dump Analysis, WinDbg Scripts, WinDbg Tips and Tricks, WinDbg for GDB Users, Windows 7, Windows Server 2008, Windows System Administration, Workaround Patterns | No Comments »
Monday, April 5th, 2010
I’m very pleased to announce that the Korean edition is available:

The book can be found on:
- Dmitry Vostokov @ DumpAnalysis.org + TraceAnalysis.org -
Posted in Announcements, AntiPatterns, Assembly Language, Books, Books (Korean), C and C++, Computer Science, Crash Dump Analysis, Crash Dump Patterns, Crash Dumps for Dummies, Debugging, Dr. Watson, Escalation Engineering, Fun with Crash Dumps, GDB for WinDbg Users, Hardware, Kernel Development, Mathematics of Debugging, Memiotics (Memory Semiotics), Memoretics, Memory Space Music, Memory Visualization, Minidump Analysis, Multithreading, Publishing, Science of Memory Dump Analysis, Security, Software Architecture, Software Engineering, Software Technical Support, Testing, Tools, Troubleshooting Methodology, Virtualization, Vista, WinDbg Scripts, WinDbg Tips and Tricks, WinDbg for GDB Users, Windows Server 2008, Windows System Administration | No Comments »
Sunday, March 21st, 2010
I originally intended to name this blog post as ”What I’m Reading Now” but then decided to show it as another satisfying example of my Mod N Reading technique. During my 7 years in memory dump analysis captivity I didn’t pay much attention to traditional synthetic software engineering (as opposed to analytical software defect research in computer memory) except occasionally writing some troubleshooting tools, describing DebugWare patterns in UML and devising RADII process. A few weeks ago I decided to brush up my engineering skills and read some books that accumulated in my library during last few years. Here is the list of them (debugging triptych of Windows Internals 5th Edition, Advanced Windows Debugging, and Advanced .NET Debugging are on my office table and I read them almost daily so I’m not including them in the list below).
Illustrated Mod N is actually Mod 7 technique where I cycle through 7 topics with 3 books for each topic. Ideally I aim to dedicate one topic per day every week but this is not always possible due to writing and publishing but I still do it in a Mod 7 way even if I skip some days. it usually takes me an hour or two to read carefully 5-10 pages from each of 3 topical books. Here is the current state of the reading round-robin queue (21 books) under my home computer desk:
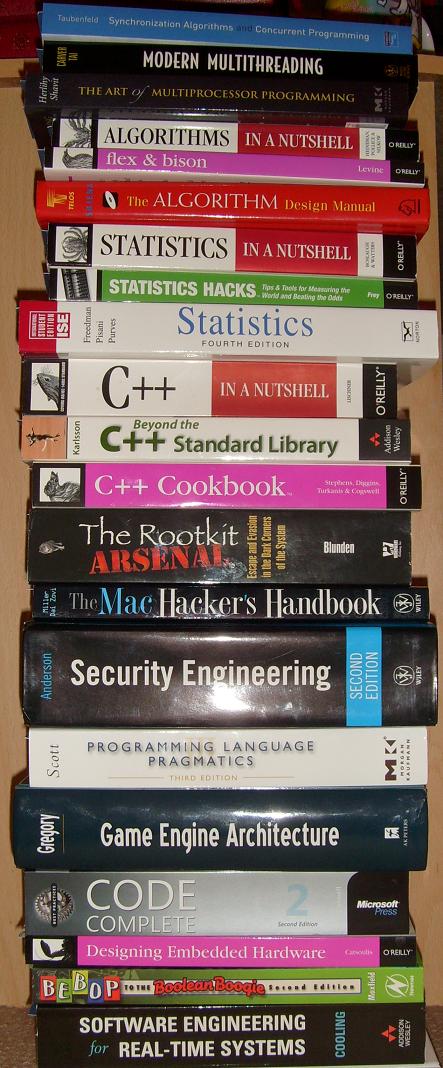
Here are the topics and corresponding books (with links if you would like to buy them from Amazon):
Multithreading from Computer Science Perspective
Synchronization Algorithms and Concurrent Programming

Modern Multithreading : Implementing, Testing, and Debugging Multithreaded Java and C++/Pthreads/Win32 Programs

The Art of Multiprocessor Programming

Algorithms, Parsing
Algorithms in a Nutshell

Flex & Bison: Text Processing Tools

The Algorithm Design Manual

Statistics
Statistics in a Nutshell: A Desktop Quick Reference

Statistics Hacks: Tips & Tools for Measuring the World and Beating the Odds

Statistics, 4th Edition

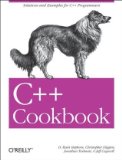
C++, STL and Boost
C++ in a Nutshell
Beyond the C++ Standard Library: An Introduction to Boost

C++ Cookbook
Security, Mac OS X
The Rootkit Arsenal: Escape and Evasion in the Dark Corners of the System

The Mac Hacker’s Handbook
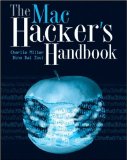
Security Engineering: A Guide to Building Dependable Distributed Systems

Code, Games
Programming Language Pragmatics, Third Edition

Game Engine Architecture
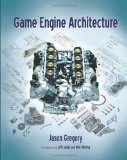
Code Complete: A Practical Handbook of Software Construction

Embedded and Real-Time Software Engineering
Designing Embedded Hardware

Bebop to the Boolean Boogie, Third Edition: An Unconventional Guide to Electronics

Software Engineering for Real-Time Systems

- Dmitry Vostokov @ DumpAnalysis.org + TraceAnalysis.org -
Posted in Books, C and C++, Computer Science, Education and Research, Hardware, Mac Crash Corner, Multithreading, Security, Software Architecture, Software Engineering, Software Generalist | No Comments »
Thursday, February 11th, 2010
This is a revised, edited, cross-referenced and thematically organized volume of selected DumpAnalysis.org blog posts about crash dump analysis and debugging written in July 2009 - January 2010 for software engineers developing and maintaining products on Windows platforms, quality assurance engineers testing software on Windows platforms and technical support and escalation engineers dealing with complex software issues. The fourth volume features:
- 13 new crash dump analysis patterns
- 13 new pattern interaction case studies
- 10 new trace analysis patterns
- 6 new Debugware patterns and case study
- Workaround patterns
- Updated checklist
- Fully cross-referenced with Volume 1, Volume 2 and Volume 3
- New appendixes
Product information:
- Title: Memory Dump Analysis Anthology, Volume 4
- Author: Dmitry Vostokov
- Language: English
- Product Dimensions: 22.86 x 15.24
- Paperback: 410 pages
- Publisher: Opentask (30 March 2010)
- ISBN-13: 978-1-906717-86-5
- Hardcover: 410 pages
- Publisher: Opentask (30 April 2010)
- ISBN-13: 978-1-906717-87-2

Back cover features memory space art image: Internal Process Combustion.
- Dmitry Vostokov @ DumpAnalysis.org + TraceAnalysis.org -
Posted in .NET Debugging, Aesthetics of Memory Dumps, Announcements, AntiPatterns, Art, Assembly Language, Books, C and C++, CDA Pattern Classification, CDF Analysis Tips and Tricks, Categorical Debugging, Certification, Citrix, Code Reading, Common Mistakes, Computer Science, Countefactual Debugging, Crash Analysis Report Environment (CARE), Crash Dump Analysis, Crash Dump Patterns, Crash Dumps for Dummies, DebugWare Patterns, Debugging, Debugging Slang, Education and Research, Escalation Engineering, Fun with Crash Dumps, Games for Debugging, Hardware, Horrors of Computation, Hyper-V, Kernel Development, Laws of Troubleshooting and Debugging, Mathematics of Debugging, Memiotics (Memory Semiotics), Memoidealism, Memoretics, Memory Analysis Culture, Memory Analysis Forensics and Intelligence, Memory Dreams, Memory Dump Analysis Jobs, Memory Dumps in Movies, Memory Space Art, Memory Visualization, Memuonics, Minidump Analysis, Multithreading, Music for Debugging, New Acronyms, New Words, Opcodism, Philosophy, Physicalist Art, Publishing, Science Fiction, Science of Memory Dump Analysis, Science of Software Tracing, Security, Software Architecture, Software Defect Construction, Software Engineering, Software Generalist, Software Maintenance Institute, Software Narratology, Software Technical Support, Software Trace Analysis, Software Trace Visualization, Software Tracing for Dummies, Software Victimology, Stack Trace Collection, Testing, Tools, Trace Analysis Patterns, Training and Seminars, Troubleshooting Methodology, Victimware, Virtualization, Vista, Visual Dump Analysis, WinDbg Scripts, WinDbg Tips and Tricks, WinDbg for GDB Users, Windows 7, Windows Server 2008, Windows System Administration, Workaround Patterns | No Comments »
Monday, January 18th, 2010
After exciting results of the previous year of debugging it is time to announce modest plans for this year, 0×7DA:
Release the first beta version of EasyDbg
Release the first beta version of CARE (Crash Analysis Report Environment) for a pattern-driven debugger log analyzer with standards for structured audience-driven reports
Release the first beta version of STARE (Software Trace Analysis Report Environment) for a pattern-driven software trace analyzer with corresponding standards for structured audience-driven reports
Publish the following books on dump analysis that address different audiences (general users, system administrators, support and escalation engineers, testers, software engineers, security and software defect researchers):
- Windows Debugging Notebook
- Crash Dump Analysis for System Administrators and Support Engineers
- Memory Dump Analysis Anthology, Volume 4
- Memory Dump Analysis Anthology, Volume 5
- Memory Dump Analysis Anthology Color Supplement
- Principles of Memory Dump Analysis
- My Computer Crashes and Freezes: A Non-technical Guide to Software and Hardware Errors
- Linux, FreeBSD and Mac OS X Debugging: Practical Foundations
- Encyclopedia of Crash Dump Analysis Patterns
- WinDbg In Use: Debugging Exercises
Publish articles related to memory dump analysis in Debugged! magazine
Update WinDbg Poster and Cards
- Dmitry Vostokov @ DumpAnalysis.org + TraceAnalysis.org -
Posted in Announcements, Books, Certification, Crash Dump Analysis, Debugging, Education and Research, Escalation Engineering, FreeBSD Crash Corner, Linux Crash Corner, Mac Crash Corner, New Acronyms, Publishing, Software Engineering, Software Technical Support, Software Trace Analysis | 1 Comment »
Thursday, January 14th, 2010
The Year of Debugging, 0×7D9, was a remarkable year for DumpAnalysis.org. Here is the list of achievements to report:
- Software Trace Analysis as a new discipline with its own set of patterns
- Unification of Memory Dump Analysis with Software Trace Analysis (DA+TA)
- New computer memory dump-based art movements: Opcodism and Physicalist Art
- Discovery of 3D computer memory visualization techniques
- Establishing Software Maintenance Institute
- Broadening software fault injection as Software Defect Construction discipline
- Establishing a new profession of a Software Defect Researcher
- Starting ambitious Dictionary of Debugging
- Publishing Windows Debugging: Practical Foundations book
- Publishing the first x86-free Windows debugging book: x64 Windows Debugging: Practical Foundations
- Establishing the new debugging magazine: Debugged! MZ/PE
- Publishing Memory Dump Analysis Anthology, Volume 3
- Cooperation with OpenTask to promote First Fault Software Problem Solving book
- Establishing Debugging Expert(s) Magazine Online
- Creating the first development process for debugging and software troubleshooting tools: RADII
- Publishing the first pattern-driven memory dump analysis troubleshooting methodology as a foundation for software debugging
- Proposal for an International Memory Analysts and Debuggers Day
- Almost completed Windows Debugging Notebook to be published soon
Now DumpAnalysis.org focuses on The Year of Dump Analysis, 0×7DA, as a foundation for the forthcoming debugging decade and reveals future plans this weekend.
I’m sure that many other organizations and individuals have no less remarkable accomplishments to report for 2009. I promise to track down and write about some of them in the forthcoming book:
The Science of Dr. Watson: An Illustrated History of Debugging (ISBN: 978-1906717070)
- Dmitry Vostokov @ DumpAnalysis.org + TraceAnalysis.org -
Posted in Announcements, Art, Books, Citrix, Crash Dump Analysis, Debugged! MZ/PE, Debugging, Dictionary of Debugging, History, Memory Visualization, Publishing, Software Defect Construction, Software Engineering, Software Maintenance Institute, Software Technical Support, Software Trace Analysis, Trace Analysis Patterns | 1 Comment »
Thursday, January 7th, 2010
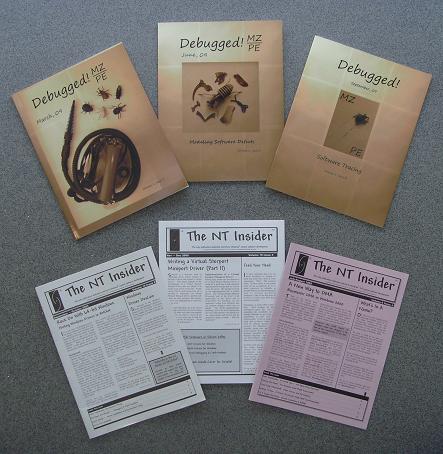
If you know any other please let us know. For example, MSDN is great too, there was also a Visual C++-oriented magazine I used to read in the past. May be it is still in print. I plan to make a wider perspective picture later on. Both pictured magazines (Debugged! MZ/PE and NT Insider) are mainly oriented towards unmanaged and native code respectively (the former with a timeless computer science slant) but Debugged! soon to cover native, virtualized, interpreted and managed code environments too and aims to become a “Complete Debugging Magazine” similar to kernel vs. user process vs. complete memory dump file differences.
- Dmitry Vostokov @ DumpAnalysis.org -
Posted in Announcements, Art, Crash Dump Analysis, Debugged! MZ/PE, Debugging, Education and Research, History, Publishing, Software Engineering | No Comments »