Archive for the ‘Software Engineering’ Category
Sunday, December 27th, 2009
Main topics of Debugged! MZ/PE magazine issues for June and September 2010:
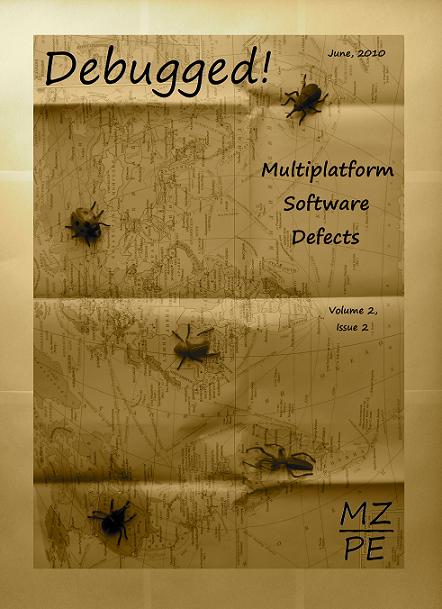
Debugged! MZ/PE: Multiplatform Software Defects, June, 2010 (Paperback, ISBN: 978-1906717902)
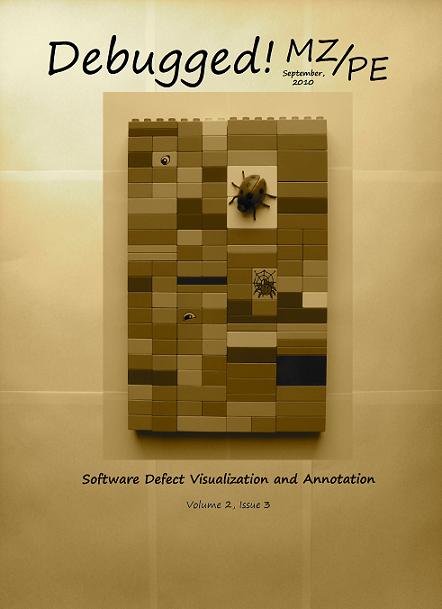
Debugged! MZ/PE: Software Defect Visualization and Annotation, September, 2010 (Paperback, ISBN: 978-1906717919)
Here are draft front covers designed today:
- Dmitry Vostokov @ DumpAnalysis.org -
Posted in Announcements, Books, Computer Science, Crash Dump Analysis, Debugged! MZ/PE, Debugging, Memory Visualization, Publishing, Software Engineering, Software Technical Support, Software Trace Analysis, Software Trace Visualization | No Comments »
Wednesday, December 23rd, 2009
See the greeting card on the portal together with New Year’s Eve code analysis puzzle:
DumpAnalysis.org Wishes Happy New Year 7DA!
- Dmitry Vostokov @ DumpAnalysis.org -
Posted in Announcements, Assembly Language, Code Reading, Crash Dump Analysis, Debugging, Fun with Crash Dumps, Games for Debugging, Software Engineering, Software Technical Support | No Comments »
Monday, December 21st, 2009
When looking at crash dumps it is good to keep an eye on new API that might surface on stack traces and in component relationships. Plan to order this book tomorrow and put my reading notes on Software Generalist blog:
Introducing Windows® 7 for Developers

- Dmitry Vostokov @ DumpAnalysis.org -
Posted in Books, Code Reading, Software Engineering, Windows 7 | No Comments »
Sunday, December 20th, 2009
“Memory dumps are facts.”
I’m very excited to announce that Volume 3 is available in paperback, hardcover and digital editions:
Memory Dump Analysis Anthology, Volume 3
Table of Contents
In two weeks paperback edition should also appear on Amazon and other bookstores. Amazon hardcover edition is planned to be available in January 2010.
The amount of information was so voluminous that I had to split the originally planned volume into two. Volume 4 should appear by the middle of February together with Color Supplement for Volumes 1-4.
- Dmitry Vostokov @ DumpAnalysis.org -
Posted in .NET Debugging, Aesthetics of Memory Dumps, Announcements, AntiPatterns, Art, Assembly Language, Books, Bugtations, C and C++, CDA Pattern Classification, CDF Analysis Tips and Tricks, Certification, Citrix, Code Reading, Common Mistakes, Computer Science, Crash Dump Analysis, Crash Dump Patterns, Crash Dumps for Dummies, DebugWare Patterns, Debugging, Debugging Slang, Deep Down C++, Education and Research, Escalation Engineering, Fun with Crash Dumps, Hardware, Horrors of Computation, Kernel Development, Mathematics of Debugging, Memiotics (Memory Semiotics), Memoidealism, Memoretics, Memory Analysis Culture, Memory Analysis Forensics and Intelligence, Memory Space Art, Memory Visualization, Minidump Analysis, Multithreading, Philosophy, Poetry, Publishing, Science of Memory Dump Analysis, Science of Software Tracing, Security, Software Architecture, Software Defect Construction, Software Engineering, Software Narratology, Software Technical Support, Software Trace Analysis, Software Trace Visualization, Software Tracing for Dummies, Software Victimology, Stack Trace Collection, Testing, Tools, Trace Analysis Patterns, Training and Seminars, Troubleshooting Methodology, Victimware, Virtualization, Vista, Visual Dump Analysis, WinDbg Scripts, WinDbg Tips and Tricks, WinDbg for GDB Users, Windows 7, Windows Server 2008, Windows System Administration | 1 Comment »
Friday, December 18th, 2009
I propose to celebrate it on 08.08 every year starting from The Year of Dump Analysis, 2010, 7DA at 8:00 (I prefer 8pm for MAD Day, moderation is important in debugging too).
What do you think? If you count things from 0 or favour user space there is an alternative date: 07.07
- Dmitry Vostokov @ DumpAnalysis.org -
Posted in Announcements, Crash Dump Analysis, Debugging, Software Engineering, Software Technical Support | 1 Comment »
Thursday, December 17th, 2009
Previously announced Software Maintenance Institute was finally registered in Ireland (Reg. No. 400906) and its certificate was received yesterday.
Here is the current component structure of various institutions (depicted in UML):
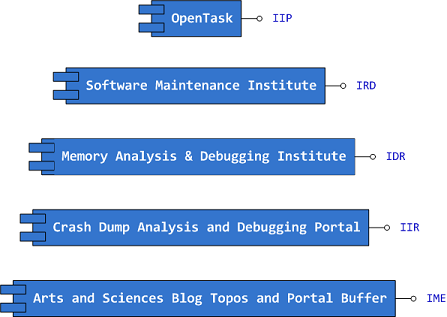
Interface Tags:
IIP Interface of Iterative Publishing

IRD Interface of Research and Development

IDR Interface of Defect Research

IIR Interface of Information Repository

IME Interface of Memetic Engineering
- Dmitry Vostokov @ DumpAnalysis.org -
Posted in Announcements, Art, Certification, Computer Science, Crash Dump Analysis, Debugging, Education and Research, Escalation Engineering, History, Memiotics (Memory Semiotics), Memoidealism, Memoretics, Memory Analysis Culture, Memory Analysis Forensics and Intelligence, Memory Auralization, Memory Visualization, Philosophy, Publishing, Science of Memory Dump Analysis, Science of Software Tracing, Security, Software Architecture, Software Engineering, Software Maintenance Institute, Software Technical Support, Software Trace Analysis, Software Victimology, Testing, Training and Seminars | No Comments »
Wednesday, December 9th, 2009
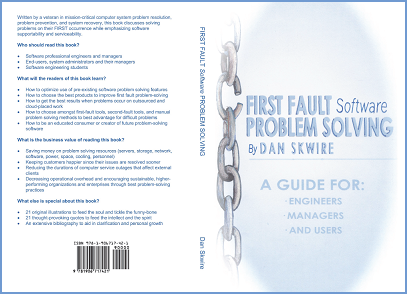
I’m very pleased to announce that Dan Skwire’s unique book has been published by OpenTask:
First Fault Software Problem Solving: A Guide for Engineers, Managers and Users
- Dmitry Vostokov @ DumpAnalysis.org -
Posted in Announcements, Books, Escalation Engineering, First Fault Problem Solving, Publishing, Software Engineering, Software Technical Support, Tools, Troubleshooting Methodology | 1 Comment »
Tuesday, December 8th, 2009
Advanced .NET Debugging (Addison-Wesley Microsoft Technology Series)

I’ve just started reading this book (see my notes on Software Generalist blog) and this review is written from the perspective of an unmanaged and native software engineer (the last phrase sounds funny). Being a member of a software support of a large software company I analyze crash dumps that have mscorwks.dll on their stack traces. So if you see them too this book helps you to understand what this DLL is all about and how to dig inside the hidden world of .NET it manages. I’m on page 26 and will update this review as soon as I finish the book in a few months. Please also see my review of the previous Mario’s (co-authored with Daniel Pravat) book: Advanced Windows Debugging. It is of great importance to know .NET world for Windows maintenance engineers and I originally planned a similar book Unmanaged Code: Escaping the Matrix of .NET but didn’t have time to finish it yet 
- Dmitry Vostokov @ DumpAnalysis.org -
Posted in .NET Debugging, Books, Crash Dump Analysis, Debugging, Reading Notebook, Reviewed on Amazon, Software Engineering | 3 Comments »
Friday, November 20th, 2009
By analogy with a security researcher profession I propose the new title of a software defect researcher as a unified profession combining relevant fields of security research, testing, debugging, memory dump analysis, software reverse engineering, construction and maintenance. At least I consider myself a software defect researcher. If you think you consider yourself too please write a comment to this post. Thank you in advance.
- Dmitry Vostokov @ DumpAnalysis.org -
Posted in Announcements, Crash Dump Analysis, Debugging, Memory Dump Analysis Jobs, Security, Software Engineering, Testing | 1 Comment »
Monday, November 16th, 2009
This weekend noticed that it is in stock and this means that I soon get it in the post:
Advanced .NET Debugging (Addison-Wesley Microsoft Technology Series)
I plan to start reading it as soon as it arrives and put notes on my Software Generalist blog.
- Dmitry Vostokov @ DumpAnalysis.org -
Posted in .NET Debugging, Announcements, Books, Crash Dump Analysis, Debugging, Software Engineering, WinDbg Tips and Tricks | 1 Comment »
Friday, October 30th, 2009
Suppose we want to write a support tool to troubleshoot a frequent software problem. Would we start with GUI? Most tools are command line tools and we therefore choose Tool Façade pattern to decouple GUI from CLI:
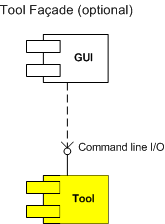
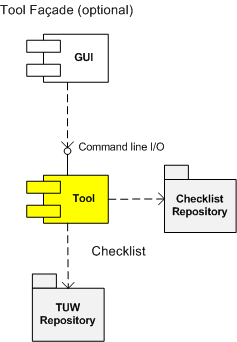
By making our GUI optional we postpone its development until later implementation phase when we want to beautify or simplify the tool user interface. The troubleshooting of software problem we want to automate is quite complex, scattered across several knowledge base articles, with many troubleshooting steps and various checks. We therefore treat different steps as TUWs, Troubleshooting Units of Work (aggregating related ones if necessary) and choose Checklist pattern to coordinate them:
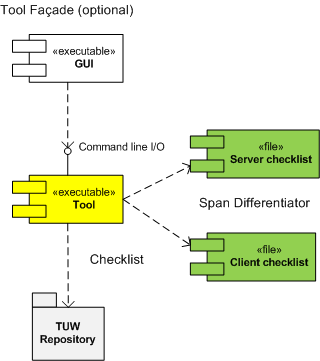
Initially we think that just one checklist is suffice but while studying the domain of troubleshooting we find that the problem usually spans client and server computers, where servers sometimes have client roles as well and different troubleshooting steps and checks are needed. In order to simplify the tool we apply Span Differentiator pattern and our architectural UML component diagram becomes more refined:
We also see that different TUW use similar operations like querying registry values or checking whether certain processes are running and factor them out into separate SMs, Supporting Modules:
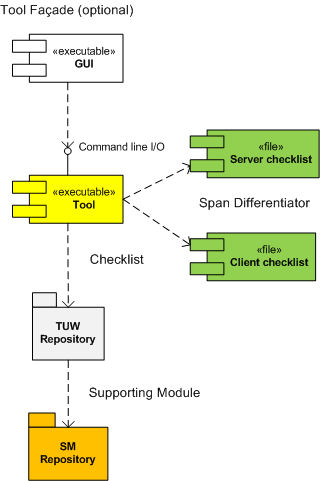
Deployment methods are important in troubleshooting where it is not always desirable to change configuration on production servers and we plan for optional Self Extractor pattern:
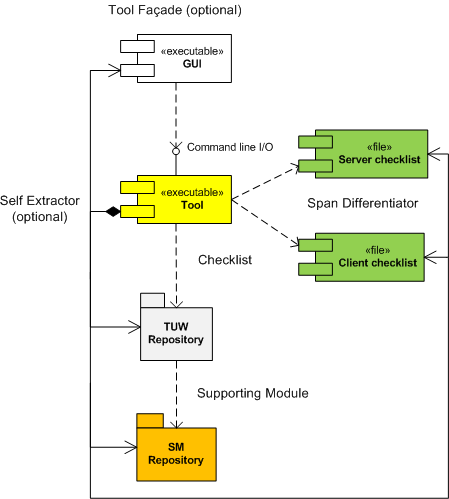
In diagrams we liberally mixed component and static UML diagramming elements. We also need to design a uniform interface that each TUW module exposes to the main tool coordinator module but we leave it for the part 2.
- Dmitry Vostokov @ DumpAnalysis.org -
Posted in DebugWare Patterns, Debugging, Software Architecture, Software Engineering, Software Technical Support | 1 Comment »
Thursday, October 29th, 2009
As a dual to my previous Resume and CV: As a Book (it actually has a “bug” on the cover, try to spot it) I plan to publish the long time memories in the following book next year:
My Failed Job Interviews: Reflections on 50 Percent (ISBN: 978-1906717889)
The recollections of my pre-memory dump analysis era span East and West, small and giant software companies, full time and part time, office and remote job positions, direct and recruitment company hiring, phone and on-site, technical and business interviews.
- Dmitry Vostokov @ DumpAnalysis.org -
Posted in Announcements, Books, History, Publishing, Software Engineering | No Comments »
Wednesday, October 28th, 2009
Support tools can be packaged for delivery as (not counting optional separate readme and EULA files):
- - A raw collection of modules
- - A single installation package
- - A single archived file
- - A single self-extractable component
The latter common packaging choice is a pattern itself that I call Self Extractor. Typical examples include sysinternals tools like Process Monitor. Here is a simple unorthodox UML diagram for a single platform tool combining elements from static and component diagrams to illustrate component embedding (not sharing):
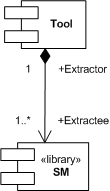
SM is a supporting module, for example, a driver, to carry out some task or receive notifications.
Some tools even extract different components depending on the processor architecture, for example, x86 and x64. This is illustrated on a more elaborate UML diagram:
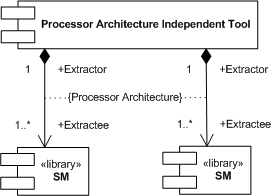
The typical example would be a backward compatible x86 Extractor that extracts an x64 driver (Extractee) for an x64 OS kernel that doesn’t load x86 drivers.
- Dmitry Vostokov @ DumpAnalysis.org -
Posted in DebugWare Patterns, Debugging, Software Architecture, Software Engineering, Software Technical Support, Tools | 2 Comments »
Friday, October 23rd, 2009
What prompted me to found this discipline (that is supposed to be a sister discipline of software criminology, software security, secure code construction and software defect construction) is understanding that some software components are innocent victims of other component coding mistakes or deliberate subversion and some start as a part of crimeware but eventually become victims themselves (they crash, hang, spike, leak, are dumped, subverted, etc.). I would also like to borrow and reuse the neglected term victimware here in a broad sense. More on this later as I have to switch to software trace analysis patterns.
- Dmitry Vostokov @ DumpAnalysis.org -
Posted in Code Reading, Crash Dump Analysis, Debugging, Memory Analysis Forensics and Intelligence, Security, Software Defect Construction, Software Engineering, Software Trace Analysis, Software Victimology, Victimware | 1 Comment »
Wednesday, October 21st, 2009
The domain of some troubleshooting and debugging tools sometimes spans several computers, for example, a client, a server, and a middleware server (or a frontware server like a web server). Because such tools are small, there is no need to devise yet another distributed architecture but force the tool to differentiate its functionality based on a command line parameters. For example, the following tool implements Checklist pattern and chooses the right checklist from a checklist repository based on a command line option:
c:\> GreatTool -client
c:\> GreatTool -server
This nicely fits with a case when a server is also a client to another server and we need to troubleshoot its client and server functionality on the same physical computer.
- Dmitry Vostokov @ DumpAnalysis.org -
Posted in DebugWare Patterns, Debugging, Software Architecture, Software Engineering, Software Technical Support, Tools | 1 Comment »
Tuesday, October 20th, 2009
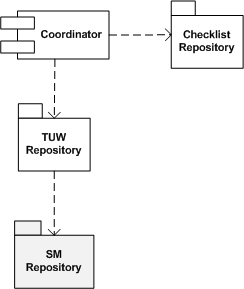
Many troubleshooting tools and their components (like TUW modules from checklists) reuse the same code over and over, for example, querying registry keys or environment variables. It is beneficial to have a package of supporting modules (or a library) for code reuse purposes, hence the name of this pattern, Supporting Module (SM). In the context of Checklist pattern we can refine its UML component diagram to highlight that TUWs are using some shared SM components:
- Dmitry Vostokov @ DumpAnalysis.org -
Posted in DebugWare Patterns, Debugging, Software Architecture, Software Engineering, Software Technical Support, Tools | No Comments »
Friday, October 16th, 2009
Memory Analysis and Debugging Institute (MA&DI), DA+TA Portal (DumpAnalysis.org + TraceAnalysis.org) and OpenTask establish
Software Maintenance Institute (SMI)
More details about R&D Institute of Software Maintenance will be announced soon.
- Dmitry Vostokov @ DumpAnalysis.org -
Posted in Announcements, Crash Dump Analysis, Debugging, Education and Research, Science of Memory Dump Analysis, Science of Software Tracing, Software Engineering, Software Maintenance Institute, Software Technical Support, Software Trace Analysis | 1 Comment »
Tuesday, October 13th, 2009
Threads in my process run very fast. Not long ago the watch variable had the value 5 and now it is 6:
switch (years_at_citrix)

{

  case 5:

    write_blog_post(”I’ve just passed 5 year mark … “);

    wait_for_certificate();

    write_blog_post(”Shortly after celebrating 5 years … “);

    break;

  case 6:

    write_blog_post(”Threads in my process run very fast. Not long ago … “);

    break;

  case 7:

    // … TBD
}
- Dmitry Vostokov @ DumpAnalysis.org -
Posted in Announcements, Citrix, Crash Dump Analysis, Debugging, History, Software Engineering, Software Technical Support, Software Trace Analysis | 1 Comment »
Monday, October 12th, 2009
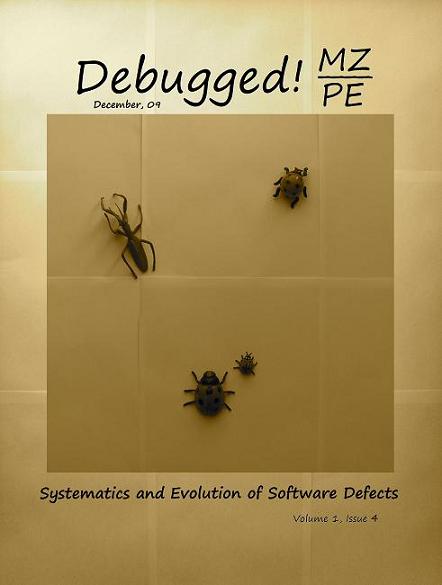
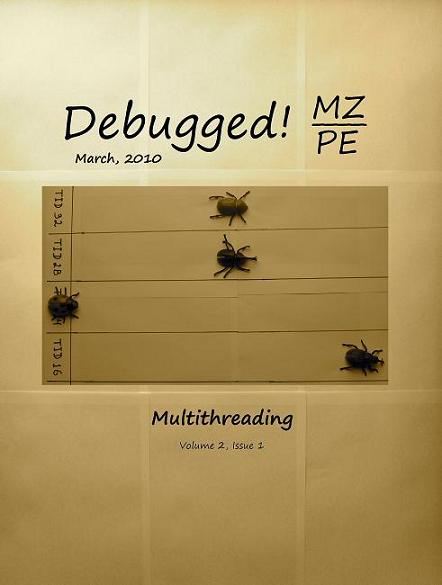
To commemorate 200 years since Darwin’s birth and 150 years since the publication of The Origin of Species, OpenTask plans to dedicate December, 2009 issue of Debugged! MZ/PE magazine to taxonomy and evolution of software defects and March, 2010 issue to multithreading (as natural selection).
Debugged! MZ/PE: Systematics and Evolution of Software Defects, December, 2009 (Paperback, ISBN: 978-1906717827)
Debugged! MZ/PE: Multithreading, March, 2010 (Paperback, ISBN: 978-1906717834)
Here are draft front covers designed during last weekend:
- Dmitry Vostokov @ DumpAnalysis.org -
Posted in Announcements, Books, CDA Pattern Classification, Computer Science, Crash Dump Analysis, Debugged! MZ/PE, Debugging, Multithreading, Publishing, Software Engineering, Software Technical Support | 2 Comments »
Monday, September 28th, 2009
Every PID has its twitter account. Processes emit short trace messages (STM) and others subscribe to them. This is the technical support of the future, the concept of SoftWeet (*):
www.SoftWeet.com
(*) to weet
to know; to wit (archaic)
- Dmitry Vostokov @ DumpAnalysis.org -
Posted in Announcements, Debugged! MZ/PE, Debugging, Software Architecture, Software Engineering, Software Technical Support, Software Trace Analysis, Tools, Troubleshooting Methodology | 1 Comment »