Archive for the ‘Security’ Category
Saturday, January 1st, 2011
With the new year starts the new initiative to integrate traditional multidisciplinary debugging approaches and methodologies with multiplatform pattern-driven software problem solving, unified debugging patterns, best practices in memory dump analysis and software tracing, computer security, economics, and the new emerging trends I’m going to write about during this year.
- Dmitry Vostokov @ DumpAnalysis.org + TraceAnalysis.org -
Posted in Announcements, Best Practices, Computer Forensics, Computer Science, Countefactual Debugging, Crash Analysis Report Environment (CARE), Crash Dump Analysis, Crash Dump Patterns, DebugWare Patterns, Debugging, Debugging Industry, Debugging Methodology, Debugging Trends, Dublin School of Security, Economics, Education and Research, Escalation Engineering, First Fault Problem Solving, Malware Analysis, Malware Patterns, Mathematics of Debugging, Memiotics (Memory Semiotics), Memoretics, Memory Analysis Forensics and Intelligence, Memory Analysis Report System, Memory Dump Analysis Services, Memory Systems Language, Memory Visualization, New Debugging School, Science of Memory Dump Analysis, Science of Software Tracing, Security, Software Behavior Patterns, Software Defect Construction, Software Engineering, Software Generalist, Software Maintenance Institute, Software Narratology, Software Trace Analysis, Software Trace Visualization, Software Tracing Implementation Patterns, Software Troubleshooting Patterns, Structural Memory Patterns, Structural Trace Patterns, Systems Thinking, Testing, Tool Objects, Tools, Trace Analysis Patterns, Training and Seminars, Troubleshooting Methodology, Unified Debugging Patterns, Victimware, Visual Dump Analysis, Webinars, Workaround Patterns | No Comments »
Monday, December 27th, 2010
Paraphrasing the title of Philip K. Dick’s novel Do Androids Dream of Electric Sheep? I’d like to tell the dream I had a few nights ago after starting my work on a computational security novel Session Zero (ISBN: 978-1908043092). I was in the hall of a building where Russian and American spies frequently intersect. Apparently, I was a technician there and everyone passing by was complaining about difficulties being a spy. I was listening and telling everyone that I wasn’t a spy, just a technician. Suddenly a thought came to my mind that if I were a real spy masquerading as a technician it would have made make a good novel plot… Then I met colleagues from one of my previous companies and I woke up.
- Dmitry Vostokov @ DumpAnalysis.org + TraceAnalysis.org -
Posted in Memory Analysis Forensics and Intelligence, Memory Dreams, Security | No Comments »
Friday, December 24th, 2010
Borrowing routine activity theory (RAT) from criminology I would like to introduce the similar approach to abnormal software behavior with patterning activities that adds additional unmotivated offenders to combine malware (software rats) with unintentional ordinary common bugware:
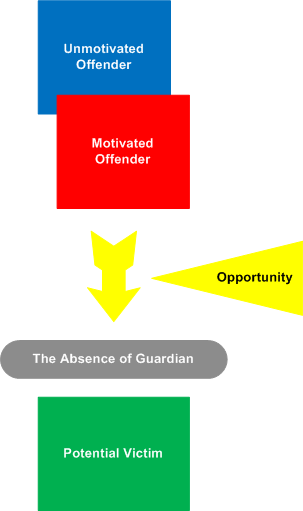
The application of RAT to software can be metaphorically named as Function Activity Theory (FAT).
- Dmitry Vostokov @ DumpAnalysis.org + TraceAnalysis.org -
Posted in Malware Analysis, Security, Software Behavior Patterns, Software Victimology, Structural Memory Patterns, Victimware | No Comments »
Friday, December 17th, 2010
As the new decade is approaching (2011-2020) we would like to make a few previews and predictions:
- Increased complexity of software will bring more methods from biological, social sciences and humanities in addition to existing methods of automated debugging and computer science techniques
- Focus on first fault software problem solving (when aspect)
- Focus on pattern-driven software problem solving (how aspect)
- Fusion of debugging and malware analysis into a unified structural and behavioral pattern framework
- Visual debugging, memory and software trace visualization techniques
- Software maintenance certification
- Focus on domain-driven troubleshooting and debugging tools as a service (debugware TaaS)
- Focus on security issues related to memory dumps and software traces
- New scripting languages and programming language extensions for debugging
- The maturation of the science of memory snapshots and software traces (memoretics)
Imagining is not not limited to the above and more to come and explain in the forthcoming parts.
- Dmitry Vostokov @ DumpAnalysis.org + TraceAnalysis.org -
Posted in Announcements, Anthropology, Archaeology of Computer Memory, Biology, Certification, Computer Science, Countefactual Debugging, Crash Analysis Report Environment (CARE), Crash Dump Analysis, Crash Dump Patterns, DebugWare Patterns, Debugging, Debugging Industry, Debugging Methodology, Debugging Trends, Dublin School of Security, EasyDbg, Economics, Escalation Engineering, Evolution, First Fault Problem Solving, Futuristic Memory Dump Analysis, General Memory Analysis, General Science, Geography, Hardware, Hermeneutics of Memory Dumps and Traces, History, Humanities, Language, Laws of Troubleshooting and Debugging, Logic, Malware Analysis, Malware Patterns, Mathematics of Debugging, Memiotics (Memory Semiotics), Memoretics, Memory Analysis Forensics and Intelligence, Memory Analysis Report System, Memory Dump Analysis and History, Memory Systems Language, Memory Visualization, Paleo-debugging, Pattern Models, Pattern Prediction, Physics, Psychology, Publishing, Science of Memory Dump Analysis, Science of Software Tracing, Security, Social Media, Social Sciences, Software Architecture, Software Behavior Patterns, Software Chorography, Software Chorology, Software Defect Construction, Software Engineering, Software Generalist, Software Maintenance Institute, Software Narrative Fiction, Software Narratology, Software Technical Support, Software Trace Analysis, Software Trace Analysis and History, Software Trace Deconstruction, Software Trace Linguistics, Software Trace Visualization, Software Troubleshooting Patterns, Software Victimology, Statistics, Structural Memory Analysis and Social Sciences, Structural Memory Patterns, Structural Trace Patterns, Systems Thinking, Testing, Tools, Trace Analysis Patterns, Troubleshooting Methodology, Unified Debugging Patterns, Uses of UML, Victimware, Virtualization, Visual Dump Analysis, Windows System Administration, Workaround Patterns | No Comments »
Tuesday, November 30th, 2010
MAaaS includes 2 complementary DA+TA services:
1. Dump Analysis as a Service (DAaaS)
2. Trace Analysis as a Service (TAaaS)
Memory Dump Analysis Services is the first organization to provide such a service at an audit and certification levels.
- Dmitry Vostokov @ DumpAnalysis.org + TraceAnalysis.org -
Posted in Certification, Complete Memory Dump Analysis, Crash Analysis Report Environment (CARE), Crash Dump Analysis, Crash Dump Patterns, Debugging, Dublin School of Security, Escalation Engineering, Malware Analysis, Malware Patterns, Memiotics (Memory Semiotics), Memoretics, Memory Analysis Forensics and Intelligence, Memory Analysis Report System, Memory Dump Analysis Services, Minidump Analysis, Security, Software Behavior Patterns, Software Technical Support, Software Trace Analysis, Software Trace Reading, Structural Memory Patterns, Structural Trace Patterns, Tools, Trace Analysis Patterns, Windows System Administration | No Comments »
Friday, November 12th, 2010
Five volumes of cross-disciplinary Anthology (dubbed by the author “The Summa Memorianica”) lay the foundation of the scientific discipline of Memoretics (study of computer memory snapshots and their evolution in time) that is also called Memory Dump and Software Trace Analysis.ca
The 5th volume contains revised, edited, cross-referenced, and thematically organized selected DumpAnalysis.org blog posts about crash dump, software trace analysis and debugging written in February 2010 - October 2010 for software engineers developing and maintaining products on Windows platforms, quality assurance engineers testing software on Windows platforms, technical support and escalation engineers dealing with complex software issues, and security researchers, malware analysts and reverse engineers. The fifth volume features:
- 25 new crash dump analysis patterns
- 11 new pattern interaction case studies (including software tracing)
- 16 new trace analysis patterns
- 7 structural memory patterns
- 4 modeling case studies for memory dump analysis patterns
- Discussion of 3 common analysis mistakes
- Malware analysis case study
- Computer independent architecture of crash analysis report service
- Expanded coverage of software narratology
- Metaphysical and theological implications of memory dump worldview
- More pictures of memory space and physicalist art
- Classification of memory visualization tools
- Memory visualization case studies
- Close reading of the stories of Sherlock Holmes: Dr. Watson’s observational patterns
- Fully cross-referenced with Volume 1, Volume 2, Volume 3, and Volume 4
Product information:
- Title: Memory Dump Analysis Anthology, Volume 5
- Author: Dmitry Vostokov
- Language: English
- Product Dimensions: 22.86 x 15.24
- Paperback: 400 pages
- Publisher: Opentask (10 December 2010)
- ISBN-13: 978-1-906717-96-4
- Hardcover: 400 pages
- Publisher: Opentask (10 December 2010)
- ISBN-13: 978-1-906717-97-1

Back cover features memory space art image Hot Computation: Memory on Fire.
- Dmitry Vostokov @ DumpAnalysis.org + TraceAnalysis.org -
Posted in Aesthetics of Memory Dumps, Announcements, Archaeology of Computer Memory, Art, Assembly Language, Books, C and C++, CDF Analysis Tips and Tricks, Categorical Debugging, Common Mistakes, Complete Memory Dump Analysis, Computer Science, Crash Analysis Report Environment (CARE), Crash Dump Analysis, Crash Dump De-analysis, Crash Dump Patterns, Debugging, Debugging Methodology, Debugging Slang, Deep Down C++, Dr. Watson, Dublin School of Security, Education and Research, Escalation Engineering, Fun with Crash Dumps, Fun with Debugging, Fun with Software Traces, General Memory Analysis, Hermeneutics of Memory Dumps and Traces, Images of Computer Memory, Kernel Development, Malware Analysis, Malware Patterns, Mathematics of Debugging, Memiotics (Memory Semiotics), Memoidealism, Memoretics, Memory Analysis Culture, Memory Analysis Forensics and Intelligence, Memory Analysis Report System, Memory Diagrams, Memory Dreams, Memory Dump Analysis Jobs, Memory Dump Analysis Services, Memory Dump Analysis and History, Memory Dumps in Movies, Memory Dumps in Myths, Memory Religion (Memorianity), Memory Space Art, Memory Systems Language, Memory Visualization, Memory and Glitches, Memuonics, Metaphysical Society of Ireland, Minidump Analysis, Movies and Debugging, Multithreading, Museum of Debugging, Music for Debugging, Music of Computation, New Acronyms, New Words, Paleo-debugging, Pattern Models, Pattern Prediction, Philosophy, Physicalist Art, Psychoanalysis of Software Maintenance and Support, Publishing, Science of Memory Dump Analysis, Science of Software Tracing, Security, Software Architecture, Software Behavior Patterns, Software Chorography, Software Chorology, Software Defect Construction, Software Engineering, Software Generalist, Software Maintenance Institute, Software Narratology, Software Technical Support, Software Trace Analysis, Software Trace Analysis and History, Software Trace Deconstruction, Software Trace Reading, Software Trace Visualization, Software Tracing for Dummies, Software Troubleshooting Patterns, Software Victimology, Stack Trace Collection, Structural Memory Analysis and Social Sciences, Structural Memory Patterns, Structural Trace Patterns, Systems Thinking, Testing, Theology, Tool Objects, Tools, Trace Analysis Patterns, Training and Seminars, Troubleshooting Methodology, Uses of UML, Victimware, Virtualization, Vista, Visual Dump Analysis, Webinars, WinDbg Scripts, WinDbg Tips and Tricks, WinDbg for GDB Users, Windows 7, Windows Server 2008, Windows System Administration, Workaround Patterns, x64 Windows | No Comments »
Saturday, November 6th, 2010
I’m pleased to announce that MDAA, Volume 4 is available in PDF format:
www.dumpanalysis.org/Memory+Dump+Analysis+Anthology+Volume+4
It features:
- 15 new crash dump analysis patterns
- 13 new pattern interaction case studies
- 10 new trace analysis patterns
- 6 new Debugware patterns and case study
- Workaround patterns
- Updated checklist
- Fully cross-referenced with Volume 1, Volume 2 and Volume 3
- Memory visualization tutorials
- Memory space art
Its table of contents is available here:
http://www.dumpanalysis.org/MDAA/MDA-Anthology-V4-TOC.pdf
Paperback and hardcover versions should be available in a week or two. I also started working on Volume 5 that should be available in December.
- Dmitry Vostokov @ DumpAnalysis.org + TraceAnalysis.org -
Posted in .NET Debugging, Aesthetics of Memory Dumps, Announcements, AntiPatterns, Art, Assembly Language, Books, C and C++, CDF Analysis Tips and Tricks, Categorical Debugging, Common Mistakes, Complete Memory Dump Analysis, Computer Science, Countefactual Debugging, Crash Dump Analysis, Crash Dump Patterns, DebugWare Patterns, Debugging, Debugging Slang, Deep Down C++, Education and Research, Escalation Engineering, Fun with Crash Dumps, Fun with Debugging, Images of Computer Memory, Kernel Development, Memiotics (Memory Semiotics), Memoidealism, Memoretics, Memory Space Art, Memory Visualization, Memuonics, Metaphysics of Memory Worldview, Multithreading, Opcodism, Philosophy, Physicalist Art, Publishing, Science Fiction, Science of Memory Dump Analysis, Science of Software Tracing, Security, Software Architecture, Software Behavior Patterns, Software Defect Construction, Software Engineering, Software Narratology, Software Technical Support, Software Trace Analysis, Software Trace Reading, Software Victimology, Stack Trace Collection, Testing, Tools, Trace Analysis Patterns, Troubleshooting Methodology, Uses of UML, Victimware, Virtualization, Vista, Visual Dump Analysis, WinDbg Scripts, WinDbg Tips and Tricks, Windows 7, Windows Server 2008, Windows System Administration, Workaround Patterns, x64 Windows | No Comments »
Saturday, October 30th, 2010
If you develop and debug user space applications (and/or doing crash dump analysis in user space) or specialize in user space security and you want to understand Windows kernel dumps and device drivers better (and probably start writing your own kernel tools) or understand malware rootkits better here is the reading list I found the most effective over the last 7 years:
0.0. Read and re-read Windows Internals book in parallel while reading all other books. I read all editions by the way. It will show you the big picture and useful WinDbg commands and techniques but you need to read device driver books to fill the gaps and be confident in kernel space:

0.1. Start with The Windows 2000 Device Driver Book: A Guide for Programmers . This short book will show you the basics and you can start writing your drivers and kernel tools immediately.

0.2. Next read Windows NT Device Driver Development book to consolidate your knowledge. This book has been reprinted by OSR (I own the original New Riders Press edition):

0.3. Don’t stop here. Read Developing Windows NT Device Drivers: A Programmer’s Handbook . This is the very good book explaining everything in great detail and good pictures. You will finally understand various buffering methods.

0.4. Continue with WDM drivers and modern presentation: Programming the Microsoft Windows Driver Model . Must read even if your drivers are not WDM.

0.5. Finally read Developing Drivers with the Windows Driver Foundation book. It also covers ETW (event tracing for Windows), WinDbg extensions, PREfast and static driver verifier.

0.6. There is a forthcoming book Windows 7 Device Driver at the time of this writing that also covers WDF so you might want to start with #0.6 and continue with #0.5 as a reference:

Additional reading (not including DDK Help which you will use anyway) can be done in parallel after finishing “Windows NT Device Driver Development” book:
1.1. OSR NT Insider articles. I have their full printed collection 1996 - 2006 plus all the latest issues (looks like print editions are discontinued and the new ones are only digital):
http://www.osronline.com/
1.2. Windows NT File System Internals reprinted by OSR (I have the original O’Reilly edition):

1.3. Windows NT/2000 Native API Reference is fun to browse occasionally and indispensable if you don’t have access to Windows source code:

1.4. Rootkits: Subverting the Windows Kernel book will show you Windows kernel from the hacker perspective. In addition you will find the overview of kernel areas not covered in other books.

1.5. The Rootkit Arsenal: Escape and Evasion in the Dark Corners of the System is another excellent book that is up to date and explains kernel staff from ab initio. I’m reading it at the time of this writing and recommend it to read first or in parallel to all other books:

Of course, you must know C language and its idioms really well. Really know it down to assembly language level! I’ll publish other reading lists soon including reverse engineering classics. Stay tuned.
- Dmitry Vostokov @ DumpAnalysis.org + TraceAnalysis.org -
Posted in Books, Crash Dump Analysis, Debugging, Kernel Development, Malware Analysis, Memory Analysis Forensics and Intelligence, Security, Software Architecture | 1 Comment »
Thursday, October 28th, 2010
Motivated by the existence of London School of Economics (LSE) I just founded DSS. The program to be communicated soon and includes general memory dump and software trace analysis as a foundation for security. I like the name very much because of its additional meaning:
DUmps Binary Logs INternals
- Dmitry Vostokov @ DumpAnalysis.org + TraceAnalysis.org -
Posted in Announcements, Dublin School of Security, Malware Analysis, Malware Patterns, Memoretics, Memory Analysis Forensics and Intelligence, Memory Analysis Report System, New Acronyms, Security | 1 Comment »
Saturday, October 23rd, 2010
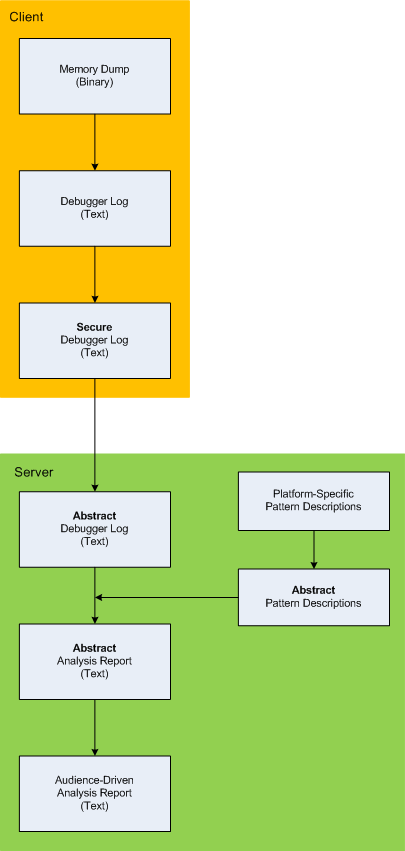
Here is the description of a high-level architecture of the previously announced project CARE (Crash Analysis Report Environment). To remind, the main idea of the project is to process memory dumps on a client to save debugger logs. They can be sent to a server for pattern-driven analysis of software behaviour. Textual logs can also be inspected by a client security team before sending. Certain sensitive information can be excluded or modified to have generic meaning according to the built-in processing rules like renaming (for example, server names and folders). Before processing, verified secured logs are converted to abstract debugger logs. Abstracting platform-specific debugger log format allows reuse of the same architecture for different computer platforms. We call it CIA (Computer Independent Architecture). Do not confuse it with ICA (Independent Computer Architecture) and CIA acronym is more appropriate for memory analysis (like similar MAFIA acronym, Memory Analysis Forensics and Intelligence Architecture). These abstract logs are checked for various patterns (in abstracted form) using abstract debugger commands and an abstract report is generated according to various checklists. Abstract reports are then converted to structured reports for the required audience level. Abstract memory analysis pattern descriptions are prepared from platform-specific pattern descriptions. In certain architectural component deployment configurations both client and server parts can reside on the same machine. Here’s the simple diagram depicting the flow of processing:
- Dmitry Vostokov @ DumpAnalysis.org + TraceAnalysis.org -
Posted in Announcements, Crash Analysis Report Environment (CARE), Crash Dump Analysis, Crash Dump Patterns, Debugging, Memory Analysis Forensics and Intelligence, New Acronyms, Security, Software Architecture, Software Behavior Patterns, Software Technical Support, Structural Memory Patterns, Tools | No Comments »
Friday, October 22nd, 2010
I detour for MARS expedition. You may also call it Memory Analysis Report System as malware analysis is always exploration of memory (in general). Why is this sudden change of course? After reading Gilles Deleuze I want to broaden the concept of “malware” and give it new orientation and direction of thinking. Beside that I also want new challenges after many years of research in pattern-driven memory dump and software trace analysis of abnormal software behaviour.
You may have also noticed small restructuring (rebranding) of this blog and DumpAnalysis.org headers.
See you there 
- Dmitry Vostokov @ DumpAnalysis.org + TraceAnalysis.org -
Posted in Announcements, Archaeology of Computer Memory, Assembly Language, Computer Science, Education and Research, General Memory Analysis, Malware Analysis, Malware Patterns, Memiotics (Memory Semiotics), Memoretics, Memory Analysis Forensics and Intelligence, Memory Analysis Report System, Memory Dump Analysis Services, New Acronyms, Philosophy, Science of Memory Dump Analysis, Science of Software Tracing, Security, Software Trace Analysis, Software Victimology, Structural Memory Patterns, Systems Thinking, Tools, Trace Analysis Patterns, Victimware, Windows System Administration | No Comments »
Wednesday, October 20th, 2010
As a practical example of applying behavioral and structural pattern analysis of computer memory and traces OpenTask plans to publish the following title next year:
- Title: Malware Patterns: Structure and Behavior of Computer Adware, Crimeware, Rootkits, Scareware, Spyware, Trojans, Viruses, Victimware and Worms
- Author: Dmitry Vostokov
- Paperback: 1200 pages
- Publisher: OpenTask (October 2011)
- ISBN-13: 978-1-908043-01-6
The inclusion of victimware is necessary because of the effects of defective malware.
- Dmitry Vostokov @ DumpAnalysis.org + TraceAnalysis.org -
Posted in Announcements, Books, Crash Dump Analysis, Crash Dump Patterns, Malware Analysis, Malware Patterns, Memiotics (Memory Semiotics), Memoretics, Memory Analysis Forensics and Intelligence, Publishing, Science of Memory Dump Analysis, Science of Software Tracing, Security, Software Behavior Patterns, Software Defect Construction, Software Trace Analysis, Software Victimology, Structural Memory Patterns, Trace Analysis Patterns, Victimware | No Comments »
Monday, October 18th, 2010
One of my home computers got infected. I confess that I don’t have an antivirus because I’m conscious while browsing Internet (the last infected machine I had was an MSDOS one) so perhaps one of my family members was less careful. I paid attention to the possible infection when IE started crashing when I was pushing a login button on one of online banking websites. However I didn’t pay enough attention because it was a heap corruption (see my previous case study) and simply switched to another non-crashing browser vendor such as Apple Safari. Since then IE was crashing periodically when I was pushing various admin buttons in WordPress but I didn’t pay much attention too because it was still heap corruption and I was thinking it was a script processing defect, waiting for a new IE update. Until one day explorer.exe crashed as well when I was entering a password for an ftp account. Here’s the stack trace that I got after opening a crash dump in WinDbg:
0:030> kL 100

ChildEBP RetAddr

0663e9c4 76f05610 ntdll!KiFastSystemCallRet

0663e9c8 7706a5d7 ntdll!NtWaitForMultipleObjects+0xc

0663ea64 7706a6f0 kernel32!WaitForMultipleObjectsEx+0×11d

0663ea80 770de2a5 kernel32!WaitForMultipleObjects+0×18

0663eaec 770de4d1 kernel32!WerpReportFaultInternal+0×16d

0663eb00 770bff4d kernel32!WerpReportFault+0×70

0663eb8c 76f17fc1 kernel32!UnhandledExceptionFilter+0×1b5

0663eb94 76ea9bdc ntdll!__RtlUserThreadStart+0×6f

0663eba8 76ea4067 ntdll!_EH4_CallFilterFunc+0×12

0663ebd0 76f05f79 ntdll!_except_handler4+0×8e

0663ebf4 76f05f4b ntdll!ExecuteHandler2+0×26

0663eca4 76f05dd7 ntdll!ExecuteHandler+0×24

0663eca4 93181a08 ntdll!KiUserExceptionDispatcher+0xf

WARNING: Frame IP not in any known module. Following frames may be wrong.

0663efa0 0321aaaf 0×93181a08

0663efac 6b887974 0×321aaaf

0663efbc 6b8973ad msieftp!InternetCloseHandleWrap+0×10

0663f810 6b897fbf msieftp!CFtpSite::_QueryServerFeatures+0×57

0663fa50 6b8981ae msieftp!CFtpSite::_LoginToTheServer+0×235

0663fa94 6b88b39e msieftp!CFtpSite::GetHint+0xe8

0663fab4 6b88b412 msieftp!CFtpDir::GetHint+0×1f

0663fae4 6b88ed38 msieftp!CFtpDir::WithHint+0×49

0663fb10 6b88eda4 msieftp!CFtpEidl::_Init+0×6e

0663fb2c 7584ecb4 msieftp!CFtpEidl::Next+0×41

0663fb64 7584f63b shell32!CEnumThread::_EnumFolder+0×65

0663fb80 7584f5ba shell32!CEnumThread::_RunEnum+0×6f

0663fb8c 7645c2c9 shell32!CEnumThread::s_EnumThreadProc+0×14

0663fc10 7706d0e9 shlwapi!WrapperThreadProc+0×11c

0663fc1c 76ee19bb kernel32!BaseThreadInitThunk+0xe

0663fc5c 76ee198e ntdll!__RtlUserThreadStart+0×23

0663fc74 00000000 ntdll!_RtlUserThreadStart+0×1b
Notice 0×321aaaf address. We see that wininet function was hooked by a code running in 0×0321XXXX range:
0:030> ub 6b887974

msieftp!InternetOpenWrap+0×46:

6b887963 cc              int     3

msieftp!InternetCloseHandleWrap:

6b887964 8bff            mov     edi,edi

6b887966 55              push    ebp

6b887967 8bec            mov     ebp,esp

6b887969 56              push    esi

6b88796a ff7508          push    dword ptr [ebp+8]

6b88796d 33f6            xor     esi,esi

6b88796f e82e610100      call    msieftp!InternetCloseHandle (6b89daa2)
0:030> u 6b89daa2

msieftp!InternetCloseHandle:

6b89daa2 ff2500278a6b    jmp     dword ptr [msieftp!_imp__InternetCloseHandle (6b8a2700)]

msieftp!_imp_load__InternetConnectW:

6b89daa8 b834278a6b      mov     eax,offset msieftp!_imp__InternetConnectW (6b8a2734)

6b89daad e9b4feffff      jmp     msieftp!_tailMerge_WININET_dll (6b89d966)

6b89dab2 cc              int     3

6b89dab3 cc              int     3

6b89dab4 cc              int     3

6b89dab5 cc              int     3

6b89dab6 cc              int     3
0:030> dp 6b8a2700 l1

6b8a2700  76dc9088
0:030> u 76dc9088

wininet!InternetCloseHandle:

76dc9088 e9031a458c      jmp     0321aa90

76dc908d 51              push    ecx

76dc908e 51              push    ecx

76dc908f 53              push    ebx

76dc9090 56              push    esi

76dc9091 57              push    edi

76dc9092 33db            xor     ebx,ebx

76dc9094 33ff            xor     edi,edi
0:030> u 0321aa90

0321aa90 55              push    ebp

0321aa91 8bec            mov     ebp,esp

0321aa93 837d0800        cmp     dword ptr [ebp+8],0

0321aa97 740c            je      0321aaa5

0321aa99 8b4508          mov     eax,dword ptr [ebp+8]

0321aa9c 50              push    eax

0321aa9d e82eedffff      call    032197d0

0321aaa2 83c404          add     esp,4
This address range was not on a loaded module list so I used image scanning command to detect Hidden Module:
0:030> .imgscan

MZ at 00080000, prot 00000002, type 01000000 - size 2cd000

Name: explorer.exe

MZ at 003d0000, prot 00000002, type 00040000 - size 2000

MZ at 018a0000, prot 00000008, type 00040000 - size 7000

MZ at 031c0000, prot 00000008, type 00040000 - size 3000

MZ at 031d0000, prot 00000002, type 01000000 - size c000

Name: DLAAPI_W.DLL

MZ at 03210000, prot 00000040, type 00020000 - size 1d000

[…]
!dh command was not showing any useful hints so I dumped the whole address range of that Unknown Component and found strange strings inside:
0:030> db 03210000 03210000+1d000

[...]

032246d0  2a 00 00 00 2a 00 00 00-42 6c 61 63 6b 77 6f 6f  *...*...Blackwoo

032246e0  64 50 52 4f 00 00 00 00-46 69 6e 61 6d 44 69 72  dPRO....FinamDir

032246f0  65 63 74 00 47 72 61 79-42 6f 78 00 4d 62 74 50  ect.GrayBox.MbtP

03224700  52 4f 00 00 4c 61 73 65-72 00 00 00 4c 69 67 68  RO..Laser...Ligh

03224710  74 53 70 65 65 64 00 00-4c 54 47 72 6f 75 70 00  tSpeed..LTGroup.

03224720  4d 62 74 00 53 63 6f 74-54 72 61 64 65 72 00 00  Mbt.ScotTrader..

03224730  53 61 78 6f 54 72 61 64-65 72 00 00 00 00 00 00  SaxoTrader......

03224740  50 72 6f 67 72 61 6d 3a-20 20 20 25 73 0d 0a 55  Program:   %s..U

03224750  73 65 72 6e 61 6d 65 3a-20 20 25 73 0d 0a 50 61  sername:  %s..Pa

03224760  73 73 77 6f 72 64 3a 20-20 25 73 0d 0a 41 63 63  ssword:  %s..Acc

03224770  6f 75 6e 74 4e 4f 3a 20-25 73 0d 0a 53 65 72 76  ountNO: %s..Serv

03224780  65 72 3a 20 20 20 20 25-73 0d 0a 00 5c 00 00 00  er:    %s...\...

03224790  25 73 20 25 73 00 00 00-25 73 00 00 50 52 4f 43  %s %s...%s..PROC

032247a0  45 53 53 4f 52 5f 49 44-45 4e 54 49 46 49 45 52  ESSOR_IDENTIFIER

032247b0  00 00 00 00 25 64 00 00-25 30 32 58 00 00 00 00  ....%d..%02X....

032247c0  30 00 00 00 2c 00 00 00-25 30 32 58 00 00 00 00  0...,...%02X....

[...]

03225000  01 01 00 00 5c 00 63 00-68 00 6b 00 6e 00 74 00  ....\.c.h.k.n.t.

03225010  66 00 73 00 2e 00 65 00-78 00 65 00 00 00 00 00  f.s...e.x.e.....

03225020  5c 00 63 00 68 00 6b 00-6e 00 74 00 66 00 73 00  \.c.h.k.n.t.f.s.

03225030  2e 00 64 00 61 00 74 00-00 00 00 00 a6 b7 04 5e  ..d.a.t........^

[...]
I didn’t pay attention to chkntfs.exe but did a search for SaxoTrader string in all files using findstr command and found chkntfs.exe as a system file in Start Menu \ Programs \ Startup folder in roaming user AppData. I couldn’t remove it so I had to boot in command line mode to do that. The crashes were gone since that. I double checked various iexplore.exe crash dumps saved previously and found the same module loaded, for example:
0:005> .imgscan

MZ at 00040000, prot 00000040, type 00020000 - size 1d000

MZ at 00340000, prot 00000002, type 01000000 - size 9c000

Name: iexplore.exe

[…]
Here we consider IE and Explorer as victimware of malware.
- Dmitry Vostokov @ DumpAnalysis.org + TraceAnalysis.org -
Posted in Crash Dump Analysis, Crash Dump Patterns, Malware Analysis, Memory Analysis Forensics and Intelligence, Security, Victimware, Victimware Analysis | 2 Comments »
Monday, September 27th, 2010
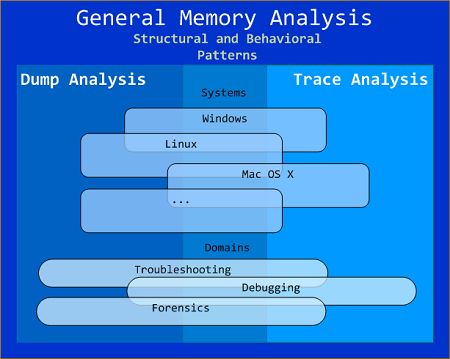
General Memory Analysis is another name for Memoretics, a discipline that studies memory snapshots including their similarities and differences on different system platforms such as Windows, Linus, Mac OS X, embedded and mobile systems, historical architectures, etc. The analysis of memory helps solve problems in various domains such as software troubleshooting and debugging, computer forensic analysis, etc.
The current focus of interdisciplinary research is to build a unified memory pattern language that covers both behavioral and structural patterns and also to study the possibility of building memory systems from below, not from requirements -> architecture -> design -> implementation -> compilation -> linking -> loading -> execution but from directly modeling and assembling memory systems using memory patterns.
- Dmitry Vostokov @ DumpAnalysis.org + TraceAnalysis.org -
Posted in Announcements, Crash Dump Analysis, Debugging, General Memory Analysis, Memiotics (Memory Semiotics), Memoretics, Memory Analysis Forensics and Intelligence, Memory Systems Language, Security, Software Behavior Patterns, Software Technical Support, Software Trace Analysis, Structural Memory Patterns, Trace Analysis Patterns | No Comments »
Sunday, September 26th, 2010
Sending process crash dumps can lead to the exposure of passwords and other sensitive information especially if they were saved before a process was trying to send entered user data over a secure protocol. Here’s an incident that happened to me this morning. I was trying to login to an online banking system to check my balances and when I entered my user id and password in IE and clicked Continue button the system experienced a small delay and then a WER dialog box appeared asking me to either check online for a solution, debug or close the program. I chose Close the program and a full process memory dump was saved because I have already set up LocalDumps on my old Vista system (the problem was also reproducible).
I opened the crash dump and found that it was a heap corruption:
0:004> kL 100

ChildEBP RetAddr

02c9cb18 77815620 ntdll!KiFastSystemCallRet

02c9cb1c 77843c62 ntdll!NtWaitForSingleObject+0xc

02c9cba0 77843d4b ntdll!RtlReportExceptionEx+0x14b

02c9cbe0 7785fa87 ntdll!RtlReportException+0x3c

02c9cbf4 7785fb0d ntdll!RtlpTerminateFailureFilter+0x14

02c9cc00 777b9bdc ntdll!RtlReportCriticalFailure+0x6b

02c9cc14 777b4067 ntdll!_EH4_CallFilterFunc+0x12

02c9cc3c 77815f79 ntdll!_except_handler4+0x8e

02c9cc60 77815f4b ntdll!ExecuteHandler2+0x26

02c9cd10 77815dd7 ntdll!ExecuteHandler+0x24

02c9cd10 7785faf8 ntdll!KiUserExceptionDispatcher+0xf

02c9d084 77860704 ntdll!RtlReportCriticalFailure+0x5b

02c9d094 778607f2 ntdll!RtlpReportHeapFailure+0×21

02c9d0c8 7782b1a5 ntdll!RtlpLogHeapFailure+0xa1

02c9d110 7781730a ntdll!RtlpCoalesceFreeBlocks+0×4b9

02c9d208 77817545 ntdll!RtlpFreeHeap+0×1e2

02c9d224 76277e4b ntdll!RtlFreeHeap+0×14e

02c9d26c 760f7277 kernel32!GlobalFree+0×47

02c9d280 76594a1f ole32!ReleaseStgMedium+0×124

02c9d294 765f7feb urlmon!ReleaseBindInfo+0×4c

02c9d2a4 765b9a87 urlmon!CINet::ReleaseCNetObjects+0×3d

02c9d2bc 765b93f0 urlmon!CINetHttp::OnWininetRequestHandleClosing+0×60

02c9d2d0 77582078 urlmon!CINet::CINetCallback+0×2de

02c9d418 77588f5d wininet!InternetIndicateStatus+0xfc

02c9d448 7758937a wininet!HANDLE_OBJECT::~HANDLE_OBJECT+0xc9

02c9d464 7758916b wininet!INTERNET_CONNECT_HANDLE_OBJECT::~INTERNET_CONNECT_HANDLE_OBJECT+0×209

02c9d470 77588d5e wininet!HTTP_REQUEST_HANDLE_OBJECT::`vector deleting destructor’+0xd

02c9d480 77584e72 wininet!HANDLE_OBJECT::Dereference+0×22

02c9d48c 77589419 wininet!DereferenceObject+0×21

02c9d4b4 77589114 wininet!_InternetCloseHandle+0×9d

02c9d4d4 0004aaaf wininet!InternetCloseHandle+0×11e

WARNING: Frame IP not in any known module. Following frames may be wrong.

02c9d4e0 765a5d25 0×4aaaf

02c9d4fc 765a5c1b urlmon!CINet::TerminateRequest+0×82

02c9d50c 765a5a3c urlmon!CINet::MyTerminate+0×7b

02c9d51c 765a5998 urlmon!CINetProtImpl::Terminate+0×13

02c9d538 765a5b92 urlmon!CINetEmbdFilter::Terminate+0×17

02c9d548 765b9bc1 urlmon!CINet::Terminate+0×23

02c9d55c 765979f2 urlmon!CINetHttp::Terminate+0×48

02c9d574 7659766b urlmon!COInetProt::Terminate+0×1d

02c9d598 765979c0 urlmon!CTransaction::Terminate+0×12d

02c9d5b8 76597a2d urlmon!CBinding::ReportResult+0×92

02c9d5d0 76596609 urlmon!COInetProt::ReportResult+0×1a

02c9d5f8 76596322 urlmon!CTransaction::DispatchReport+0×1d9

02c9d624 7659653e urlmon!CTransaction::DispatchPacket+0×31

02c9d644 765a504b urlmon!CTransaction::OnINetCallback+0×92

02c9d65c 7741fd72 urlmon!TransactionWndProc+0×28

02c9d688 7741fe4a user32!InternalCallWinProc+0×23

02c9d700 7742018d user32!UserCallWinProcCheckWow+0×14b

02c9d764 7742022b user32!DispatchMessageWorker+0×322

02c9d774 7094c1d5 user32!DispatchMessageW+0xf

02c9f87c 708f337e ieframe!CTabWindow::_TabWindowThreadProc+0×54c

02c9f934 7647426d ieframe!LCIETab_ThreadProc+0×2c1

02c9f944 7627d0e9 iertutil!CIsoScope::RegisterThread+0xab

02c9f950 777f19bb kernel32!BaseThreadInitThunk+0xe

02c9f990 777f198e ntdll!__RtlUserThreadStart+0×23

02c9f9a8 00000000 ntdll!_RtlUserThreadStart+0×1b
So I quicky enable full page heap for iexpolore.exe and tried to login again. The crash happened after the same GUI sequence and the new dump was saved again with the following stack trace:
0:004> kL 100

ChildEBP RetAddr

04c590cc 77815610 ntdll!KiFastSystemCallRet

04c590d0 7627a5d7 ntdll!NtWaitForMultipleObjects+0xc

04c5916c 7627a6f0 kernel32!WaitForMultipleObjectsEx+0x11d

04c59188 762ee2a5 kernel32!WaitForMultipleObjects+0x18

04c591f4 762ee4d1 kernel32!WerpReportFaultInternal+0x16d

04c59208 762cff4d kernel32!WerpReportFault+0x70

04c59294 77827fc1 kernel32!UnhandledExceptionFilter+0x1b5

04c5929c 777b9bdc ntdll!__RtlUserThreadStart+0x6f

04c592b0 777b4067 ntdll!_EH4_CallFilterFunc+0x12

04c592d8 77815f79 ntdll!_except_handler4+0x8e

04c592fc 77815f4b ntdll!ExecuteHandler2+0x26

04c593ac 77815dd7 ntdll!ExecuteHandler+0x24

04c593ac 0004a058 ntdll!KiUserExceptionDispatcher+0xf

WARNING: Frame IP not in any known module. Following frames may be wrong.

04c596b4 0004a12e 0x4a058

04c596d4 765bb7b1 0×4a12e

04c59714 765bb32b urlmon!CINetHttp::INetAsyncSendRequest+0×347

04c59f34 765bb4c8 urlmon!CINetHttp::INetAsyncOpenRequest+0×2cf

04c59f48 765bac97 urlmon!CINet::INetAsyncConnect+0×24b

04c59f60 765a6af9 urlmon!CINet::INetAsyncOpen+0×11b

04c59f70 765a6aaa urlmon!CINet::INetAsyncStart+0×1a

04c59f8c 765a693f urlmon!CINet::StartCommon+0×198

04c59fa8 765a6b5e urlmon!CINet::StartEx+0×1c

04c59fdc 76598e84 urlmon!COInetProt::StartEx+0xc2

04c5a02c 76599411 urlmon!CTransaction::StartEx+0×3e1

04c5a0b4 76599022 urlmon!CBinding::StartBinding+0×602

04c5a0f8 76599fc0 urlmon!CUrlMon::StartBinding+0×169

04c5a120 6ca4eac6 urlmon!CUrlMon::BindToStorage+0×90

04c5a14c 6ca4e9cb mshtml!CStreamProxy::Bind+0xce

04c5a3ec 6ca4b277 mshtml!CDwnBindData::Bind+0×74b

04c5a414 6ca4b118 mshtml!NewDwnBindData+0×15f

04c5a464 6c9cf0aa mshtml!CDwnLoad::Init+0×121

04c5a4b8 6ca4aa61 mshtml!CHtmLoad::Init+0×1fe

04c5a4dc 6ca4a967 mshtml!CDwnInfo::SetLoad+0×119

04c5a4fc 6c9ce021 mshtml!CDwnCtx::SetLoad+0×7a

04c5a514 6c9cec7b mshtml!CHtmCtx::SetLoad+0×13

04c5a534 6c9c25c9 mshtml!CMarkup::Load+0×167

04c5a738 6cb6f395 mshtml!CMarkup::LoadFromInfo+0xb5a

04c5a910 6cb6f532 mshtml!CDoc::DoNavigate+0×1508

04c5aa30 6cde557e mshtml!CDoc::FollowHyperlink2+0xda7

04c5aaf8 6cde5170 mshtml!CFormElement::DoSubmit+0×405

04c5ab0c 6ca01bc5 mshtml!CFormElement::submit+0×11

04c5ab28 6ca8adc3 mshtml!Method_void_void+0×75

04c5ab9c 6ca96e11 mshtml!CBase::ContextInvokeEx+0×5d1

04c5abec 6cb89057 mshtml!CElement::ContextInvokeEx+0×9d

04c5ac28 6ca8a7c1 mshtml!CFormElement::VersionedInvokeEx+0xf0

04c5ac78 6d1f392a mshtml!PlainInvokeEx+0xea

04c5acb8 6d1f3876 jscript!IDispatchExInvokeEx2+0xf8

04c5acf4 6d1f4db6 jscript!IDispatchExInvokeEx+0×6a

04c5adb4 6d1f4d10 jscript!InvokeDispatchEx+0×98

04c5ade8 6d1f2bfd jscript!VAR::InvokeByName+0×135

04c5ae34 6d1f40c5 jscript!VAR::InvokeDispName+0×7a

04c5ae64 6d1f4e23 jscript!VAR::InvokeByDispID+0xce

04c5b000 6d1f123b jscript!CScriptRuntime::Run+0×2abe

04c5b0e8 6d1f1175 jscript!ScrFncObj::CallWithFrameOnStack+0xff

04c5b134 6d1f493c jscript!ScrFncObj::Call+0×8f

04c5b1b8 6d1f2755 jscript!NameTbl::InvokeInternal+0×137

04c5b1ec 6d1f2fa4 jscript!VAR::InvokeByDispID+0×17c

04c5b388 6d1f123b jscript!CScriptRuntime::Run+0×29e0

04c5b470 6d1f1175 jscript!ScrFncObj::CallWithFrameOnStack+0xff

04c5b4bc 6d1f0fa3 jscript!ScrFncObj::Call+0×8f

04c5b538 6d1d3ea3 jscript!CSession::Execute+0×175

04c5b584 6d1d552f jscript!COleScript::ExecutePendingScripts+0×1c0

04c5b5e8 6d1d5345 jscript!COleScript::ParseScriptTextCore+0×29a

04c5b610 6c9ca304 jscript!COleScript::ParseScriptText+0×30

04c5b668 6cb954c2 mshtml!CScriptCollection::ParseScriptText+0×219

04c5d700 6cb7a568 mshtml!CWindow::ExecuteScriptUri+0×19f

04c5d748 6cb95810 mshtml!CWindow::NavigateEx+0×5a

04c5d7b4 6cb956b5 mshtml!CDoc::ExecuteScriptUri+0×262

04c5d7f0 6cc66b68 mshtml!CDoc::ExecuteScriptURL+0×4e

04c5d844 6cad41a7 mshtml!CHyperlink::ClickAction+0×269

04c5d854 6cad416e mshtml!CAnchorElement::ClickAction+0×10

04c5d888 6cb296c5 mshtml!CElement::DoClick+0×155

04c5d8b8 6cad01ff mshtml!CAnchorElement::DoClick+0×6d

04c5d954 6cbae941 mshtml!CDoc::PumpMessage+0xf63

04c5dacc 6cad4408 mshtml!CDoc::OnMouseMessage+0×55d

04c5dbf8 6caa9241 mshtml!CDoc::OnWindowMessage+0×9d9

04c5dc24 7741fd72 mshtml!CServer::WndProc+0×78

04c5dc50 7741fe4a user32!InternalCallWinProc+0×23

04c5dcc8 7742018d user32!UserCallWinProcCheckWow+0×14b

04c5dd2c 7742022b user32!DispatchMessageWorker+0×322

04c5dd3c 7094c1d5 user32!DispatchMessageW+0xf

04c5fe44 708f337e ieframe!CTabWindow::_TabWindowThreadProc+0×54c

04c5fefc 7647426d ieframe!LCIETab_ThreadProc+0×2c1

04c5ff0c 7627d0e9 iertutil!CIsoScope::RegisterThread+0xab

04c5ff18 777f19bb kernel32!BaseThreadInitThunk+0xe

04c5ff58 777f198e ntdll!__RtlUserThreadStart+0×23

04c5ff70 00000000 ntdll!_RtlUserThreadStart+0×1b
We see that IE was trying to send an HTTP request:
 0:004> ub 765bb7b1

urlmon!CINetHttp::INetAsyncSendRequest+0x31f:

765bb799 8bce            mov     ecx,esi

765bb79b e8ef000000      call    urlmon!CINetHttp::SetOptionUserAgent (765bb88f)

765bb7a0 ff75f0          push    dword ptr [ebp-10h]

765bb7a3 ff75ec          push    dword ptr [ebp-14h]

765bb7a6 53              push    ebx

765bb7a7 53              push    ebx

765bb7a8 ff767c          push    dword ptr [esi+7Ch]

765bb7ab ff1544a06576    call    dword ptr [urlmon!_imp__HttpSendRequestW (7665a044)]
From MSDN we get the following function prototype:
BOOL HttpSendRequest(

  __in  HINTERNET hRequest,

  __in  LPCTSTR lpszHeaders,

  __in  DWORD dwHeadersLength,

  __in  LPVOID lpOptional,

  __in  DWORD dwOptionalLength

);
So we check raw stack for parameters:
0:004> dps 04c596d4

04c596d4  04c59714

04c596d8  765bb7b1 urlmon!CINetHttp::INetAsyncSendRequest+0x347

04c596dc  00cc000c ; hRequest

04c596e0  1122cd58 ; lpszHeaders

04c596e4  ffffffff ; dwHeadersLength (-1)

04c596e8  11152e88 ; lpOptional

04c596ec  00000179 ; dwOptionalLength

04c596f0  00000001

04c596f4  77583302 wininet!InternetSetOptionA

04c596f8  110f6d68

04c596fc  0000000b

04c59700  11152e88

04c59704  00000178

04c59708  00000000

04c5970c  11230fe8

04c59710  00000000

04c59714  04c59f34

04c59718  765bb32b urlmon!CINetHttp::INetAsyncOpenRequest+0×2cf

04c5971c  00cc0008

04c59720  110f6d68

04c59724  00000000

04c59728  112d2fe8

04c5972c  112d4fe8

04c59730  112d6fe0
lpszHeaders points to this string:
0:004> du 1122cd58

1122cd58  "Referer: https://www.[...XXX...].ie/o"

1122cd98  "nline/login.aspx..Accept-Languag"

1122cdd8  "e: en-ie..User-Agent: Mozilla/4."

1122ce18  "0 (compatible; MSIE 8.0; Windows"

1122ce58  " NT 6.0; Trident/4.0; MathPlayer"

1122ce98  " 2.10d; SLCC1; .NET CLR 2.0.5072"

1122ced8  "7; Media Center PC 5.0; .NET CLR"

1122cf18  " 3.5.30729; .NET CLR 3.0.30729)."

1122cf58  ".Content-Type: application/x-www"

1122cf98  "-form-urlencoded..Accept-Encodin"

1122cfd8  "g: gzip, deflate"
But lpOptional points to a string that contains the login id and password:
0:004> da 11152e88

11152e88  "__EVENTTARGET=lbtnContinue&__EVE"

11152ea8  "NTARGUMENT=&__VIEWSTATE=%2FwEPDw"

[...]

11152fc8  "u7j7pXFuOFg1%2B&txtLogin=0123456”

11152fe8  “789&txtPassword=password???????”
- Dmitry Vostokov @ DumpAnalysis.org + TraceAnalysis.org -
Posted in Crash Dump Analysis, Crash Dump Patterns, Security | 1 Comment »
Friday, September 24th, 2010
Now it’s time to divide memory analysis patterns discerned so far as mostly abnormal software behavior memory dump and software trace patterns into behavioral and structural catalogues. The goal is to account for normal system-independent structural entities and relationships visible in memory like modules, threads, processes and so on.
The first pattern (and also a super-pattern) we discuss in this part is called Memory Snapshot. It is further subdivided into Structured Memory Snapshot and BLOB Memory Snapshot. Structured sub-pattern includes:
- Contiguous memory dump files with artificially generated headers (for example, physical or process virtual space memory dump)
- Software trace messages with imposed internal structure
BLOB sub-pattern variety includes address range snapshots without any externally imposed structure, for example, saved by .writemem WinDbg command or ReadProcessMemory API and contiguous buffer and raw memory dumps saved by various memory acquisition tools.
Behavioral patterns that relate to Memory Snapshot pattern are:
I strive initially to publish at least one such pattern every day to fill the gap of normal patterns in memory analysis and later add more multi-platform details and examples from other platforms like Linux, Mac OS X, embedded and selected important historical architectures.
- Dmitry Vostokov @ DumpAnalysis.org + TraceAnalysis.org -
Posted in Crash Dump Analysis, Crash Dump Patterns, Debugging, General Memory Analysis, Memiotics (Memory Semiotics), Memoretics, Memory Analysis Forensics and Intelligence, Memory Systems Language, Science of Memory Dump Analysis, Science of Software Tracing, Security, Software Behavior Patterns, Software Trace Analysis, Structural Memory Patterns | 1 Comment »
Wednesday, August 4th, 2010
Sometimes we get memory dumps that are difficult to analyze in full because some if not most of information was omitted during saving. These are usually small memory dumps (contrasted with kernel and complete) and user process minidumps. We can easily recognize that when we open a dump:
User Mini Dump File: Only registers, stack and portions of memory are available
or
Mini Kernel Dump File: Only registers and stack trace are available
The same also applies to user dumps where thread times information is omitted so it is not possible to use !runaway WinDbg command or to a dump saved with various options of .dump command (including privacy-aware) instead of /ma or deprecated /f option. On the contrary, manually erased data in crash dumps looks more like an example of another pattern called Lateral Damage.
The similar cases of abridged dumps are discussed in Wrong Dump and Missing Space antipatterns.
Anyway, we shouldn’t dismiss such dumps and should try to analyze them. For example, some approaches (including using image binaries) are listed in kernel minidump analysis series. We can even see portions of raw stack data in search of execution residue:
0: kd> !thread

GetPointerFromAddress: unable to read from 81d315b0

THREAD 82f49020  Cid 0004.0034  Teb: 00000000 Win32Thread: 00000000 RUNNING on processor 0

IRP List:

    Unable to read nt!_IRP @ 8391e008

Not impersonating

GetUlongFromAddress: unable to read from 81d0ad90

Owning Process            82f00ab0       Image:         System

Attached Process          N/A            Image:         N/A

ffdf0000: Unable to get shared data

Wait Start TickCount      4000214

Context Switch Count      21886

ReadMemory error: Cannot get nt!KeMaximumIncrement value.

UserTime                  00:00:00.000

KernelTime                00:00:00.000

Win32 Start Address nt!ExpWorkerThread (0x81c78ea3)

Stack Init 85be0000 Current 85bdf7c0 Base 85be0000 Limit 85bdd000 Call 0

Priority 14 BasePriority 12 PriorityDecrement 0 IoPriority 2 PagePriority 5

[…]
0: kd> dps 85bdd000 85be0000

85bdd000  ????????

85bdd004  ????????

85bdd008  ????????

85bdd00c  ????????

85bdd010  ????????

85bdd014  ????????

85bdd018  ????????

85bdd01c  ????????

85bdd020  ????????

85bdd024  ????????

85bdd028  ????????

[...]

85bdf8c4  ????????

85bdf8c8  ????????

85bdf8cc  ????????

85bdf8d0  0000000a

85bdf8d4  a112883e

85bdf8d8  0000001b

85bdf8dc  00000000

85bdf8e0  81c28750 nt!KeSetEvent+0x4d

85bdf8e4  85bdf8e8

85bdf8e8  85bdf970

85bdf8ec  81c28750 nt!KeSetEvent+0x4d

85bdf8f0  badb0d00

85bdf8f4  00000000

85bdf8f8  00000000

85bdf8fc  81cf4820 nt!KiInitialPCR+0x120

85bdf900  00000000

85bdf904  85bdf938

85bdf908  81cf4820 nt!KiInitialPCR+0x120

85bdf90c  00000000

85bdf910  81d32300 nt!IopTimerLock

85bdf914  00000000

85bdf918  81fa0000 nt!_NULL_IMPORT_DESCRIPTOR <PERF> (nt+0x3a0000)

85bdf91c  85bd0023

85bdf920  00000023

85bdf924  00000000

85bdf928  81d323c0 nt!KiDispatcherLock

85bdf92c  a1128828

85bdf930  85bdf9b4

85bdf934  85bdfdb0

85bdf938  00000030

85bdf93c  84ca6f40

85bdf940  84ca6f38

85bdf944  00000001

85bdf948  85bdf970

85bdf94c  00000000

85bdf950  81c28750 nt!KeSetEvent+0x4d

85bdf954  00000008

85bdf958  00010246

85bdf95c  00000000

85bdf960  84ca68a0

[...]

85bdfd2c  82f49020

85bdfd30  835ca4d0

85bdfd34  a6684538

85bdfd38  81cfde7c nt!ExWorkerQueue+0x3c

85bdfd3c  00000001

85bdfd40  00000000

85bdfd44  85bdfd7c

85bdfd48  81c78fa0 nt!ExpWorkerThread+0xfd

85bdfd4c  835ca4d0

85bdfd50  00000000

85bdfd54  82f49020

85bdfd58  00000000

85bdfd5c  00000000

85bdfd60  0069000b

85bdfd64  00000000

85bdfd68  00000001

85bdfd6c  00000000

85bdfd70  835ca4d0

85bdfd74  81da9542 nt!PnpDeviceEventWorker

85bdfd78  00000000

85bdfd7c  85bdfdc0

85bdfd80  81e254e0 nt!PspSystemThreadStartup+0x9d

85bdfd84  835ca4d0

85bdfd88  85bd4680

85bdfd8c  00000000

85bdfd90  00000000

85bdfd94  00000000

85bdfd98  00000002

85bdfd9c  00000000

85bdfda0  00000000

85bdfda4  00000001

85bdfda8  85bdfd88

85bdfdac  85bdfdbc

85bdfdb0  ffffffff

85bdfdb4  81c8aad5 nt!_except_handler4

85bdfdb8  81c9ddb8 nt!`string'+0x4

85bdfdbc  00000000

85bdfdc0  00000000

85bdfdc4  81c9159e nt!KiThreadStartup+0x16

85bdfdc8  81c78ea3 nt!ExpWorkerThread

85bdfdcc  00000001

85bdfdd0  00000000

85bdfdd4  00000000

85bdfdd8  002e0069

85bdfddc  006c0064

85bdfde0  004c006c

85bdfde4  00000000

85bdfde8  000007f0

85bdfdec  00010000

85bdfdf0  0000027f

85bdfdf4  00000000

85bdfdf8  00000000

85bdfdfc  00000000

85bdfe00  00000000

85bdfe04  00000000

85bdfe08  00001f80

85bdfe0c  0000ffff

85bdfe10  00000000

85bdfe14  00000000

85bdfe18  00000000

[...]

85bdffe4  00000000

85bdffe8  00000000

85bdffec  00000000

85bdfff0  00000000

85bdfff4  00000000

85bdfff8  00000000

85bdfffc  00000000

85be0000  ????????
User minidumps are similar here:
0:001> k

ChildEBP RetAddr

099bfe147c90daaa ntdll!KiFastSystemCallRet

099bfe18 77e765e3 ntdll!NtReplyWaitReceivePortEx+0xc

099bff80 77e76caf rpcrt4!LRPC_ADDRESS::ReceiveLotsaCalls+0×12a

099bff88 77e76ad1 rpcrt4!RecvLotsaCallsWrapper+0xd

099bffa8 77e76c97 rpcrt4!BaseCachedThreadRoutine+0×79

099bffb4 7c80b729 rpcrt4!ThreadStartRoutine+0×1a

099bffec 00000000 kernel32!BaseThreadStart+0×37
0:001> dd 099bfe14

099bfe14  099bfe24 7c90daaa 77e765e3 00000224

099bfe24  099bff74 00000000 2db87ae8 099bff48

099bfe34  fbf58e18 00000040 fd629338 b279dbbc

099bfe44  fd5928b8 fbf58ebc b279dbbc e0c1e002

099bfe54  00000000 00000006 00000001 00000000

099bfe64  e637d218 00000000 00000006 00000006

099bfe74  00000006 e1f79698 e39b8b60 00000000

099bfe84  fbe33c40 00000001 e5ce12f8 b279db9c
0:001> dd 099bfe14-20

099bfdf4  ???????? ???????? ???????? ????????

099bfe04  ???????? ???????? ???????? ????????

099bfe14  099bfe24 7c90daaa 77e765e3 00000224

099bfe24  099bff74 00000000 2db87ae8 099bff48

099bfe34  fbf58e18 00000040 fd629338 b279dbbc

099bfe44  fd5928b8 fbf58ebc b279dbbc e0c1e002

099bfe54  00000000 00000006 00000001 00000000

099bfe64  e637d218 00000000 00000006 00000006
As a warning here it is possible to conclude that minidumps can also reveal private information especially when ASCII or Unicode buffers are seen on raw stack data.
I was thinking how to name this pattern and Oxford Thesaurus of English suggested the following name: Abridged Dump by analogy with an abridged book.
- Dmitry Vostokov @ DumpAnalysis.org + TraceAnalysis.org -
Posted in Crash Dump Analysis, Crash Dump Patterns, Debugging, Minidump Analysis, Security | 1 Comment »
Sunday, July 18th, 2010

Memory Dump Analysis Services (DumpAnalysis.com) organizes a free webinar
Date: 18th of August 2010
Time: 21:00 (BST) 16:00 (Eastern) 13:00 (Pacific)
Duration: 90 minutes
Topics include:
- User vs. kernel vs. physical (complete) memory space
- Challenges of complete memory dump analysis
- Common WinDbg commands
- Patterns
- Common mistakes
- Fiber bundles
- Hands-on exercise: a complete memory dump analysis
- A guide to DumpAnalysis.org case studies
Prerequisites: working knowledge of basic user process and kernel memory dump analysis or live debugging using WinDbg
The webinar link will be posted before 18th of August on DumpAnalysis.com
- Dmitry Vostokov @ DumpAnalysis.org + TraceAnalysis.org -
Posted in Announcements, Common Mistakes, Common Questions, Complete Memory Dump Analysis, Crash Dump Analysis, Crash Dump Patterns, Debugging, Escalation Engineering, Memory Dump Analysis Services, Pattern Models, Security, Software Architecture, Software Behavior Patterns, Software Defect Construction, Software Engineering, Software Technical Support, Stack Trace Collection, Testing, Tools, Training and Seminars, Troubleshooting Methodology, Virtualization, Vista, Webinars, WinDbg Scripts, WinDbg Tips and Tricks, Windows 7, Windows Server 2008, Windows System Administration, x64 Windows | 1 Comment »
Sunday, July 11th, 2010
Our future sponsor has been registered in Ireland and has its own independent website and logo: DumpAnalysis.com

More information will be available later this month.
- Dmitry Vostokov @ DumpAnalysis.org + TraceAnalysis.org -
Posted in Announcements, Crash Analysis Report Environment (CARE), Crash Dump Analysis, Crash Dump De-analysis, Debugging, Education and Research, Escalation Engineering, Hardware, Kernel Development, Linux Crash Corner, Mac Crash Corner, Memory Analysis Forensics and Intelligence, Memory Dump Analysis Services, Minidump Analysis, Security, Software Engineering, Software Technical Support, Software Trace Analysis, Testing, Tools, Training and Seminars, Vista, Windows 7, Windows Server 2008, Windows System Administration, x64 Windows | No Comments »