Archive for the ‘CDF Analysis Tips and Tricks’ Category
Sunday, April 15th, 2012
In a week this short full color book should appear in online bookstores:
- Title: Software Narratology: An Introduction to the Applied Science of Software Stories
- Authors: Dmitry Vostokov, Memory Dump Analysis Services
- Description: This is a transcript of Memory Dump Analysis Services Webinar about Software Narratology: an exciting new discipline and a field of research founded by DumpAnalysis.org. When software executes it gives us its stories in the form of UI events, software traces and logs. Such stories can be analyzed for their structure and patterns for troubleshooting, debugging and problem resolution purposes. Topics also include software narremes and their types, anticipatory software construction and software diagnostics.
- Publisher: OpenTask (April 2012)
- Language: English
- Product Dimensions: 28.0 x 21.6
- Paperback: 26 pages
- ISBN-13: 978-1908043078

- Dmitry Vostokov @ DumpAnalysis.org + TraceAnalysis.org -
Posted in Announcements, Books, CDF Analysis Tips and Tricks, Code Reading, Computer Science, Debugging, Debugging Methodology, Debugging Trends, Education and Research, Escalation Engineering, Event Tracing for Windows (ETW), Hermeneutics of Memory Dumps and Traces, Ideas, Narralog Programming Language, New Debugging School, Pattern-Driven Debugging, Pattern-Driven Software Support, Presentations, Publishing, Root Cause Analysis, SPDL, Science of Software Tracing, Software Behavior DNA, Software Behavior Patterns, Software Behavioral Genome, Software Diagnostics, Software Engineering, Software Narrative Fiction, Software Narrative Science, Software Narratology, Software Narremes, Software Problem Description Patterns, Software Problem Solving, Software Technical Support, Software Trace Analysis, Software Trace Analysis and History, Software Trace Deconstruction, Software Trace Linguistics, Software Trace Modeling, Software Trace Reading, Software Trace Visualization, Software Tracing Implementation Patterns, Software Troubleshooting Patterns, Structural Trace Patterns, Systems Thinking, Testing, Tools, Trace Analysis Patterns, Training and Seminars, Troubleshooting Methodology, UI Problem Analysis Patterns, Unified Debugging Patterns, Unified Software Diagnostics, Webinars | No Comments »
Sunday, April 1st, 2012
Software trace analysis is notoriously difficult so a bit of folk music is needed to make debugging sessions less boring. The following album came to my attention in a local library and after listening to it I recommend it for software log analysis sessions:
Make It Through This World

Here’s my own track title interpretation:
1. Dream Away The Defects
2. This I’d Analyze
3. A Magnifier
4. Make It Through This Trace
5. Don’t Let It Go Unanalyzed
6. Request-Reply Pair
7. I Love It When It’s Short
8. No Higher Specs
9. Said, Said.
10. When I Think Of You, My Customers
11. Close to The Defect
12. A Debugger For You Now
- Dmitry Vostokov @ DumpAnalysis.org + TraceAnalysis.org -
Posted in CDF Analysis Tips and Tricks, Escalation Engineering, Fun with Debugging, Fun with Software Traces, Music for Debugging, Software Engineering, Software Technical Support, Software Trace Analysis | No Comments »
Thursday, March 22nd, 2012
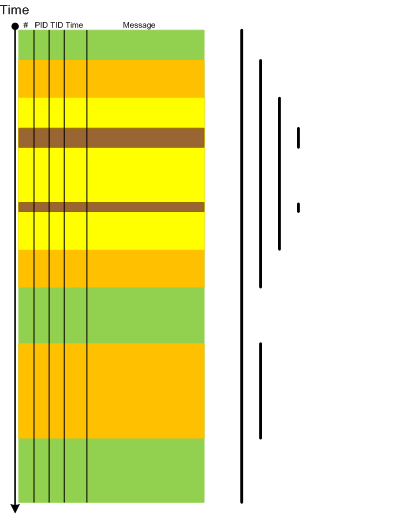
Narrative theory distinguishes between frame types such as (Fludernik, McHale, Nelles, Wolf):
- introductory framing (missing end frame) [—————————-
- terminal framing (missing opening frame) —————————-]
- [—————————-]
- interpolated framing [—-[ ]—-[ ]——–]
At the level of the software trace or an adjoint thread as a whole the first 3 types correspond to various types of this pattern Partition: Head, Prologue, Core, Epilogue, Tail where certain parts are missing. The first 2 types can also be instances of Truncated Trace pattern. Interpolated framing can be an instance of multiple discontinuities. All 4 types also correspond to foreground component messages and in general we have multiple Trace Frames as depicted:
- Dmitry Vostokov @ DumpAnalysis.org + TraceAnalysis.org -
Posted in CDF Analysis Tips and Tricks, Debugging, Software Narratology, Software Trace Analysis, Software Trace Reading, Trace Analysis Patterns | No Comments »
Sunday, December 18th, 2011
This is the first initiative for the year of software trace analysis: the first and unique software trace and log analysis training based entirely on patterns of software behavior. No longer you will be frustrated when opening a software trace with millions of messages from hundreds of software components, threads and processes.
Memory Dump Analysis Services (DumpAnalysis.com) organizes a training course:
Learn how to efficiently and effectively analyze software traces and logs from complex software environments. Covered popular software logs and trace formats from Microsoft and Citrix products and tools including Event Tracing for Windows (ETW) and Citrix Common Diagnostics Format (CDF). Learn how to use pioneering and innovative pattern-driven software problem behavior analysis to troubleshoot and debug software incidents.
If your are registered you are allowed to optionally submit your software traces and logs before the training. This will allow us in addition to the carefully constructed problems tailor additional examples to the needs of the attendees.
The training consists of 2 two-hour sessions and additional homework exercises. When you finish the training you additionally get:
- A full transcript in PDF format (retail price $200)
- 6 volumes of Memory Dump Analysis Anthology in PDF format (retail price $120)
- A personalized attendance certificate with unique CID (PDF format)
- Free Dump Analysis World Network membership including updates to full PDF transcript Q&A section
Prerequisites: Basic Windows troubleshooting.
Audience: Software technical support and escalation engineers, software maintenance engineers, system administrators.
Session 1: October 12, 2012 4:00 PM - 6:00 PM BST
Session 2: October 15, 2012 4:00 PM - 6:00 PM BST
Price: 210 USD
Space is limited.
Reserve your remote training seat now at:
https://student.gototraining.com/r/5287623225237732608

- Dmitry Vostokov @ DumpAnalysis.org + TraceAnalysis.org -
Posted in Announcements, CDF Analysis Tips and Tricks, Debugging, Software Technical Support, Software Trace Analysis, Software Trace Reading, Tools, Trace Analysis Patterns, Training and Seminars, Troubleshooting Methodology, Windows System Administration | No Comments »
Saturday, December 17th, 2011
The number of software trace analysis patterns approaches the critical mass of 50 and we have decided to focus on software tracing and logging in the forthcoming year. Some books on tracing including Volume 7 of Memory Dump Analysis Anthology will be published by OpenTask during that year and our efforts will be to further advance software narratology, software trace linguistics, and software trace analysis in the context of memory dump analysis, generative debugging and modeling software behavior.
- Dmitry Vostokov @ DumpAnalysis.org + TraceAnalysis.org -
Posted in Announcements, CDF Analysis Tips and Tricks, Debugging, Generative Debugging, Memoretics, Science of Software Tracing, Software Behavior DNA, Software Behavior Patterns, Software Behavioral Genome, Software Narratology, Software Trace Analysis, Software Trace Analysis and History, Software Trace Deconstruction, Software Trace Linguistics, Software Trace Reading, Software Trace Visualization, Software Tracing Implementation Patterns, Software Tracing for Dummies, Trace Analysis Patterns | No Comments »
Wednesday, November 2nd, 2011
Sometimes we have Linked Messages through some common parameter or attribute. One such example can be found in ETW traces related to kernel process creation notifications. Here we got adjoint thread for module PIDNotify:
#      Module    PID  TID  Time         Message

[...]

128762 PIDNotify 1260 6208 15:53:15.691 Create: ParentID 0x000004EC PID 0×000018D4

[…]

128785 PIDNotify 6356 6388 15:53:15.693 Load: ImageName \Device\HarddiskVolume1\Windows\System32\abscript.exe PID 0×000018D4

[…]

131137 PIDNotify 6356 4568 15:53:15.936 Create: ParentID 0×000018D4 PID 0×00001888

[…]

131239 PIDNotify 6280 6376 15:53:15.958 Load: ImageName \Device\HarddiskVolume1\Windows\System32\wscript.exe PID 0×00001888

[…]

132899 PIDNotify 6356 5704 15:53:16.462 Create: ParentID 0×000018D4 PID 0×00001FD0

[…]

132906 PIDNotify 8144 7900 15:53:16.464 Load: ImageName \Device\HarddiskVolume1\Windows\System32\cmd.exe PID 0×00001FD0

[…]
We see that messages 128762 and 128785 are linked through PID parameter and linked to messages 131137 and 132899 through PID - ParentID parameter relationship. Similar linkages exist for messages 131137 / 131239 and 132899 / 132906.
- Dmitry Vostokov @ DumpAnalysis.org + TraceAnalysis.org -
Posted in CDF Analysis Tips and Tricks, Debugging, Software Trace Analysis, Trace Analysis Patterns | 1 Comment »
Wednesday, September 14th, 2011
Original Message pattern deals with software trace messages where certain activity is repeated several times but the only the first message occurrence or specific message vocabulary has significance for analysis activity. Typical example from CDF/ETW tracing is module load events:
#     Module  PID   TID   Time         Message

[...]

35835 ModuleA 11000 11640 17:27:28.720 LoadImageEvent: \Device\HarddiskVolume2\Windows\System32\userinit.exe PId 5208

[…]

37684 ModuleA 12332 9576  17:27:29.063 LoadImageEvent: \Windows\System32\userinit.exe PId 573C

[…]

37687 ModuleA 12332 9576  17:27:29.064 LoadImageEvent: \Windows\System32\userinit.exe PId 573C

[…]
What we are looking here is for message invariant like “.exe” but interested in the occurrence of specific path structures like \Device\HarddiskVolume because in our troubleshooting context they signify process launch sequence during terminal session initialization.
- Dmitry Vostokov @ DumpAnalysis.org + TraceAnalysis.org -
Posted in CDF Analysis Tips and Tricks, Debugging, Software Trace Analysis, Software Trace Reading, Trace Analysis Patterns | No Comments »
Thursday, July 28th, 2011
UI Message pattern is very useful for troubleshooting system-wide issues because we can map visual behaviour to various activity regions and consider such messages as significant events.
#    Module  PID  TID  Time         Message

[...]

2782 ModuleA 2124 5648 10:58:03.356 CreateWindow: Title "..." Class "..."

[...]

3512 ModuleA 2124 5648 10:58:08.154 Menu command: Save Data

[...]

3583 ModuleA 2124 5648 10:58:08.155 CreateWindow: Title "Save As" Class "Dialog"

[... Data update and replication related messages ...]

4483 ModuleA 2124 5648 10:58:12.342 DestroyWindow: Title "Save As" Class "Dialog"

[...]
By filtering the emitting module we can create an adjoint thread:
#    Module  PID  TID  Time         Message

[...]

2782 ModuleA 2124 5648 10:58:03.356 CreateWindow: Title "..." Class "..."

3512 ModuleA 2124 5648 10:58:08.154 Menu command: Save Data

3583 ModuleA 2124 5648 10:58:08.155 CreateWindow: Title "Save As" Class "Dialog"

4483 ModuleA 2124 5648 10:58:12.342 DestroyWindow: Title "Save As" Class "Dialog"

[...]
- Dmitry Vostokov @ DumpAnalysis.org + TraceAnalysis.org -
Posted in CDF Analysis Tips and Tricks, Debugging, Software Trace Analysis, Software Trace Reading, Trace Analysis Patterns | 4 Comments »
Sunday, May 1st, 2011
Most of the time software trace messages coming from the same source code fragment (PLOT) contain invariant parts such as function and variable names, descriptions, and mutable parts such as pointer values and error codes. Message Invariant is a pattern useful for comparative analysis of several trace files where we are interested in message differences. For example, in one troubleshooting scenario certain objects were not created correctly for one user. We suspected a different object version was linked to a user profile. Separate application debug traces were recorded for each user and we could see version 0×4 for the problem user and 0×5 for all other normal users:
#    Module  PID  TID  Time         Message

[...]

2782 ModuleA 2124 5648 10:58:03.356 CreateObject: pObject 0×00A83D30 data ([…]) version 0×4

[…]
#    Module  PID  TID  Time         Message

[...]

4793 ModuleA 2376 8480 09:22:01.947 CreateObject: pObject 0×00BA4E20 data ([…]) version 0×5

[…]
- Dmitry Vostokov @ DumpAnalysis.org + TraceAnalysis.org -
Posted in CDF Analysis Tips and Tricks, Debugging, Software Trace Analysis, Software Trace Reading, Structural Trace Patterns, Trace Analysis Patterns | No Comments »
Sunday, April 17th, 2011
I’m pleased to announce that MDAA, Volume 5 is available in PDF format:
www.dumpanalysis.org/Memory+Dump+Analysis+Anthology+Volume+5
It features:
- 25 new crash dump analysis patterns
- 11 new pattern interaction case studies (including software tracing)
- 16 new trace analysis patterns
- 7 structural memory patterns
- 4 modeling case studies for memory dump analysis patterns
- Discussion of 3 common analysis mistakes
- Malware analysis case study
- Computer independent architecture of crash analysis report service
- Expanded coverage of software narratology
- Metaphysical and theological implications of memory dump worldview
- More pictures of memory space and physicalist art
- Classification of memory visualization tools
- Memory visualization case studies
- Close reading of the stories of Sherlock Holmes: Dr. Watson’s observational patterns
- Fully cross-referenced with Volume 1, Volume 2, Volume 3, and Volume 4
Its table of contents is available here:
www.dumpanalysis.org/MDAA/MDA-Anthology-V5-TOC.pdf
Paperback and hardcover versions should be available in a week or two. I also started working on Volume 6 that should be available in November-December.
- Dmitry Vostokov @ DumpAnalysis.org + TraceAnalysis.org -
Posted in Aesthetics of Memory Dumps, Analysis Notation, Announcements, AntiPatterns, Archaeology of Computer Memory, Art, Assembly Language, Best Practices, Books, C and C++, CDF Analysis Tips and Tricks, Categorical Debugging, Citrix, Common Mistakes, Common Questions, Complete Memory Dump Analysis, Computer Forensics, Computer Science, Crash Analysis Report Environment (CARE), Crash Dump Analysis, Crash Dump De-analysis, Crash Dump Patterns, Crash Dumps for Dummies, Cyber Warfare, Debugging, Debugging Bureau, Debugging Industry, Debugging Methodology, Debugging Slang, Debugging Trends, Deep Down C++, Dr. Watson, Dublin School of Security, Education and Research, Escalation Engineering, Fun with Crash Dumps, Fun with Debugging, Fun with Software Traces, General Memory Analysis, Hermeneutics of Memory Dumps and Traces, Images of Computer Memory, Kernel Development, Malware Analysis, Mathematics of Debugging, Memiotics (Memory Semiotics), Memory Analysis Forensics and Intelligence, Memory Diagrams, Memory Dump Analysis Services, Memory Dumps in Myths, Memory Space Art, Memory Systems Language, Memory Visualization, Memory and Glitches, Metaphysics of Memory Worldview, Multithreading, Music for Debugging, New Acronyms, New Debugging School, New Words, Pattern Models, Philosophy, Physicalist Art, Publishing, Reverse Engineering, Science of Memory Dump Analysis, Science of Software Tracing, Security, Software Architecture, Software Behavior Patterns, Software Chorography, Software Chorology, Software Defect Construction, Software Engineering, Software Generalist, Software Maintenance Institute, Software Narratology, Software Technical Support, Software Trace Analysis, Software Trace Reading, Software Trace Visualization, Software Tracing for Dummies, Software Troubleshooting Patterns, Software Victimology, Structural Memory Patterns, Structural Trace Patterns, Systems Thinking, Testing, The Way of Philip Marlowe, Tools, Trace Analysis Patterns, Training and Seminars, Troubleshooting Methodology, Victimware, Vista, Webinars, WinDbg Scripting Extensions, WinDbg Scripts, WinDbg Tips and Tricks, WinDbg for GDB Users, Windows 7, Windows Server 2008, Windows System Administration, Workaround Patterns, x64 Windows | No Comments »
Tuesday, April 12th, 2011
I’m to present pattern-driven software trace analysis with examples from application and desktop delivery environments featuring Memory Dump Analysis Services at the forthcoming E2E Virtualization Conference (PubForum) in Dublin on 13th of May, 2011. Topics include a case study covering simultaneous analysis of software traces and memory dumps.

- Dmitry Vostokov @ DumpAnalysis.org + TraceAnalysis.org -
Posted in Announcements, CDF Analysis Tips and Tricks, Crash Dump Analysis, Crash Dump Patterns, Debugging, Presentations, Software Technical Support, Software Trace Analysis, Software Trace Reading, Tools, Trace Analysis Patterns | 1 Comment »
Monday, April 11th, 2011
Adjoint Thread invariants like PID can be reused giving rise to curious CDF (ETW) traces where two separate execution entities are glued together in one trace. For example, in one trace we see AppA and AppB sharing the same PID
#      Module  PID  TID   Time         Message

[…]

242583 ProcMon 5492 9476  11:04:33.398 LoadImageEvent for ImageName: …\AppA.exe PID: 5492

256222 ProcMon 5492 9476  11:04:50.036 ProcessDestroyEvent for PPID: 12168 PID: 5492

274887 ProcMon 5492 10288 11:05:18.235 LoadImageEvent for ImageName: …\AppB.exe PID: 5492

[…]
Other similar examples might include different instances of components sharing the same name, source code or even, in general, periodic tracing sessions appended to the end of the same trace file although we are thinking that the latter should be a separate pattern. We named this pattern Glued Activity by an analogy of different thread strings glued together (in general, manifiolds glued along their boundaries). Another name might be along the line of adjoint thread ID reuse (ATID Reuse).
- Dmitry Vostokov @ DumpAnalysis.org + TraceAnalysis.org -
Posted in CDF Analysis Tips and Tricks, Debugging, Software Trace Analysis, Trace Analysis Patterns | No Comments »
Thursday, March 10th, 2011
Because the number of software trace patterns is growing I’m starting another checklist in addition to memory dump analysis checklist. The goal is to help experienced engineers not to miss any important information. The checklist doesn’t prescribe any specific steps, just lists all possible points to double check when looking at a software trace. Of course, it is not complete at the moment and any suggestions are welcome. This post will be modified on the ongoing basis.
General:
• Check overall trace time delta
• Check no trace metafile message density
• Check whether a trace is a multi-part or a circular
• Check for basic facts and the story (software narrative)
• Check for any exceptions, non-false positive errors and periodic errors
• Check for significant events
• Check for discontinuities in the time domain
• Check for message current and acceleration in the frequency domain
- Dmitry Vostokov @ DumpAnalysis.org + TraceAnalysis.org -
Posted in CDF Analysis Tips and Tricks, Debugging, Debugging Methodology, Escalation Engineering, Software Technical Support, Software Trace Analysis, Software Trace Reading, Trace Analysis Patterns, Troubleshooting Methodology | No Comments »
Tuesday, February 8th, 2011
This pattern has a funny name Gossip. I thought originally to call it Duplicated Message but gave it the new name allowing for the possibility of semantics of the same message to be distorted in subsequent trace messages from different adjoint threads. Typical ETW / CDF trace example (distortion free) of the same message content seen in different modules (some columns like Date and Time are omitted):
#     Module  PID  TID  Message[...]26875 ModuleA

2172 5284 LoadImageEvent: ImageName(\Device\HarddiskVolume2\Windows\System32\notepad.exe) ProcessId(0x000000000000087C)26876 ModuleB

2172 5284 LoadImageEvent: ImageName(\Device\HarddiskVolume2\Windows\System32\notepad.exe), ProcessId(2172)26877 ModuleC

2172 5284 ImageLoad: fileName=notepad.exe, pid: 000000000000087C[...]
In such cases, when constructing event sequence order it is recommended to choose messages from the one source instead of mixing events from different sources, for example:
#     Module  PID  TID  Message[...]26875 ModuleA

2172 5284 LoadImageEvent: ImageName(\Device\HarddiskVolume2\Windows\System32\notepad.exe) ProcessId(0×000000000000087C)[…]33132 ModuleA

4180 2130 LoadImageEvent: ImageName(\Device\HarddiskVolume2\Windows\System32\calc.exe) ProcessId(0×0000000000001054)[…]
- Dmitry Vostokov @ DumpAnalysis.org + TraceAnalysis.org -
Posted in CDF Analysis Tips and Tricks, Debugging, Software Trace Analysis, Software Trace Reading, Trace Analysis Patterns | No Comments »
Sunday, January 30th, 2011
When reading and analyzing software traces we always compare them to Master Trace. Another name for this pattern borrowed from narrative theory is Archetype. When looking at the software trace from a system we either know the correct sequence of Activity Regions, expect certain Background and Foreground Components, Event Sequence Order or mentally construct a model based on our experience and Implementation Discourse. For the latter example software engineers internalize software master narratives when they construct code and write tracing code for supportability. For the former example it is important to have a repository of traces corresponding to master traces. This helps in finding deviations after Bifurcation Point. Consider such comparisons similar to regression testing when we check the computation output against the expected prerecorded sequence.
- Dmitry Vostokov @ DumpAnalysis.org + TraceAnalysis.org -
Posted in CDF Analysis Tips and Tricks, Debugging, Software Narratology, Software Trace Analysis, Software Trace Reading, Testing, Trace Analysis Patterns | 2 Comments »
Saturday, January 22nd, 2011
Software trace analysis is difficult and it is very common to hear “couldn’t see anything …”. One of advantages of software trace analysis patterns is that we can use that pattern language to write analysis reports. Here I provide an example for an analysis of a CDF trace from Citrix XenApp server. Instead of replying “didn’t find anything suspicious …” an engineer identified the following patterns:
Seeing the list of patterns it was much easier to ask questions to aid in further troubleshooting.
- Dmitry Vostokov @ DumpAnalysis.org + TraceAnalysis.org -
Posted in CDF Analysis Tips and Tricks, Software Behavior Patterns, Software Trace Analysis, Software Trace Reading, Structural Trace Patterns, Trace Analysis Patterns | No Comments »
Friday, December 24th, 2010
News Value is a pattern that assigns relative importance to software traces for problem solving purposes especially when related to problem description, recent incidents and timestamps of other supporting artifacts (memory dumps, other traces, etc.). For example, in one scenario, an ETW trace was provided with 3 additional log files:
# Source PID  TID  Date       Time         Message

0 Header 1260 1728 12/14/2010 06:48:56.289 ?????

[…]

215301 Unknown 640 808 12/14/2010 07:22:57.508 ?????  Unknown( 16): GUID=[…] (No Format Information found).
// LogA

05/11/10 18:28:15.1562 : Service() - entry

[...]

14/12/10 10:31:58.0381 : Notification: sleep

* Start of new log *

14/12/10 10:34:38.4687 : Service() - entry

[…]

14/12/10 11:53:35.2729 : Service.CleanUp complete

* Start of new log *

14/12/10 11:56:11.7031 : Service() - entry

[…]

14/12/10 15:25:23.3004 : Notification: sleep
// LogB

[   1] 12/14 10:34:29:890   Entry: ctor

[…]

[   2] 12/14 11:53:30:866   Exit: COMServer.Server.DeleteObject
// LogC

[   1] 12/14 11:56:03:359   Entry: ctor

[…]

[  20] 12/14 15:30:20:110   Exit: Kernel32.Buffer.Release
From the description of the problem we expected LogB and LogC to be logs from two subsequent process executions where the first launch fails (LogB) and the second launch succeeds (LogC). Looking at their start and end times we see that they make sense from the problem description perspective but we have to dismiss ETW trace and most of LogA as recorded earlier and having no value for Inter-Correlation analysis of the more recent logs. We also see that portions of LogA overlap with LogB and LogC and therefore having analysis value for us.
- Dmitry Vostokov @ DumpAnalysis.org + TraceAnalysis.org -
Posted in CDF Analysis Tips and Tricks, Debugging, Software Trace Analysis, Software Trace Reading, Trace Analysis Patterns | No Comments »
Tuesday, December 7th, 2010
If we look at any non-trivial trace we would see different Implementation Discourses. Components are written in different languages and adhere to different runtime environments, binary models and interface frameworks. All these implementation variations influence the structure, syntax and semantics of trace messages. For example, .NET debugging traces differ from file system driver or COM debugging messages. Therefore we establish the new field of Software Trace Linguistics as a science of software trace languages. Some parallels can be drawn here towards software linguistics (the science of software languages) although we came to that conclusion independently while thinking about applying “ethnography of speaking” to software trace narration. More on this in the following posts.
- Dmitry Vostokov @ DumpAnalysis.org + TraceAnalysis.org -
Posted in CDF Analysis Tips and Tricks, Debugging, Software Narratology, Software Trace Analysis, Software Trace Linguistics, Software Trace Reading, Trace Analysis Patterns | No Comments »
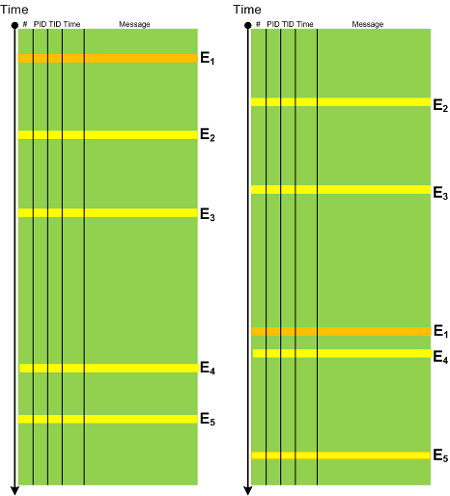
Wednesday, November 24th, 2010
In any system there is an expected Event Sequence Order as a precondition to its normal behaviour. Any out-of-order events should raise the suspicion bar as they might result or lead to synchronization problems. It need not be a sequence of trace messages from different threads but also between processes, for example, image load events in CDF / ETW traces can indicate a misconfiguration in service startup order. The following diagram depicts a possible pattern scenario:
- Dmitry Vostokov @ DumpAnalysis.org + TraceAnalysis.org -
Posted in CDF Analysis Tips and Tricks, Debugging, Software Trace Analysis, Trace Analysis Patterns | No Comments »
Monday, November 15th, 2010
This is a synthesized case study with the simplified ETW trace output based on real events (consider it as an exercise in a software narrative fiction). In a client-server environment a server session was always active regardless of whether a client was active or not. There was a workaround to enable a registry key to force checking for user activity via CheckActivity registry key. Unfortunately this didn’t help and a software trace was recorded for the offline analysis. First, we checked for Basic Facts and found the correspondence that confirmed the registry key setting:
#      PID  TID  Message

[...]

3200   1428 5476 CheckActivity = 1

[...]
There was also Periodic Errors throughout the whole trace fabric:
#       PID  TID  Message

[...]

119097  2468 476  Security check failed

[...]
Although such errors happened in a number of support incidents we see a message text we have never seen and couldn’t even find in our database of incidents (Defamiliarizing Effect):
#      PID  TID  Message

[...]

119090 2468 476  Calling the third party security information provider

119091 2468 476  Get security information: failed

[...]
Therefore we advised to test with the 3rd party security provider disabled. The software story continues…
- Dmitry Vostokov @ DumpAnalysis.org + TraceAnalysis.org -
Posted in CDF Analysis Tips and Tricks, Debugging, Software Narrative Fiction, Software Trace Analysis, Trace Analysis Patterns | No Comments »