Archive for the ‘CDF Analysis Tips and Tricks’ Category
Friday, November 12th, 2010
Five volumes of cross-disciplinary Anthology (dubbed by the author “The Summa Memorianica”) lay the foundation of the scientific discipline of Memoretics (study of computer memory snapshots and their evolution in time) that is also called Memory Dump and Software Trace Analysis.ca
The 5th volume contains revised, edited, cross-referenced, and thematically organized selected DumpAnalysis.org blog posts about crash dump, software trace analysis and debugging written in February 2010 - October 2010 for software engineers developing and maintaining products on Windows platforms, quality assurance engineers testing software on Windows platforms, technical support and escalation engineers dealing with complex software issues, and security researchers, malware analysts and reverse engineers. The fifth volume features:
- 25 new crash dump analysis patterns
- 11 new pattern interaction case studies (including software tracing)
- 16 new trace analysis patterns
- 7 structural memory patterns
- 4 modeling case studies for memory dump analysis patterns
- Discussion of 3 common analysis mistakes
- Malware analysis case study
- Computer independent architecture of crash analysis report service
- Expanded coverage of software narratology
- Metaphysical and theological implications of memory dump worldview
- More pictures of memory space and physicalist art
- Classification of memory visualization tools
- Memory visualization case studies
- Close reading of the stories of Sherlock Holmes: Dr. Watson’s observational patterns
- Fully cross-referenced with Volume 1, Volume 2, Volume 3, and Volume 4
Product information:
- Title: Memory Dump Analysis Anthology, Volume 5
- Author: Dmitry Vostokov
- Language: English
- Product Dimensions: 22.86 x 15.24
- Paperback: 400 pages
- Publisher: Opentask (10 December 2010)
- ISBN-13: 978-1-906717-96-4
- Hardcover: 400 pages
- Publisher: Opentask (10 December 2010)
- ISBN-13: 978-1-906717-97-1

Back cover features memory space art image Hot Computation: Memory on Fire.
- Dmitry Vostokov @ DumpAnalysis.org + TraceAnalysis.org -
Posted in Aesthetics of Memory Dumps, Announcements, Archaeology of Computer Memory, Art, Assembly Language, Books, C and C++, CDF Analysis Tips and Tricks, Categorical Debugging, Common Mistakes, Complete Memory Dump Analysis, Computer Science, Crash Analysis Report Environment (CARE), Crash Dump Analysis, Crash Dump De-analysis, Crash Dump Patterns, Debugging, Debugging Methodology, Debugging Slang, Deep Down C++, Dr. Watson, Dublin School of Security, Education and Research, Escalation Engineering, Fun with Crash Dumps, Fun with Debugging, Fun with Software Traces, General Memory Analysis, Hermeneutics of Memory Dumps and Traces, Images of Computer Memory, Kernel Development, Malware Analysis, Malware Patterns, Mathematics of Debugging, Memiotics (Memory Semiotics), Memoidealism, Memoretics, Memory Analysis Culture, Memory Analysis Forensics and Intelligence, Memory Analysis Report System, Memory Diagrams, Memory Dreams, Memory Dump Analysis Jobs, Memory Dump Analysis Services, Memory Dump Analysis and History, Memory Dumps in Movies, Memory Dumps in Myths, Memory Religion (Memorianity), Memory Space Art, Memory Systems Language, Memory Visualization, Memory and Glitches, Memuonics, Metaphysical Society of Ireland, Minidump Analysis, Movies and Debugging, Multithreading, Museum of Debugging, Music for Debugging, Music of Computation, New Acronyms, New Words, Paleo-debugging, Pattern Models, Pattern Prediction, Philosophy, Physicalist Art, Psychoanalysis of Software Maintenance and Support, Publishing, Science of Memory Dump Analysis, Science of Software Tracing, Security, Software Architecture, Software Behavior Patterns, Software Chorography, Software Chorology, Software Defect Construction, Software Engineering, Software Generalist, Software Maintenance Institute, Software Narratology, Software Technical Support, Software Trace Analysis, Software Trace Analysis and History, Software Trace Deconstruction, Software Trace Reading, Software Trace Visualization, Software Tracing for Dummies, Software Troubleshooting Patterns, Software Victimology, Stack Trace Collection, Structural Memory Analysis and Social Sciences, Structural Memory Patterns, Structural Trace Patterns, Systems Thinking, Testing, Theology, Tool Objects, Tools, Trace Analysis Patterns, Training and Seminars, Troubleshooting Methodology, Uses of UML, Victimware, Virtualization, Vista, Visual Dump Analysis, Webinars, WinDbg Scripts, WinDbg Tips and Tricks, WinDbg for GDB Users, Windows 7, Windows Server 2008, Windows System Administration, Workaround Patterns, x64 Windows | No Comments »
Saturday, November 6th, 2010
I’m pleased to announce that MDAA, Volume 4 is available in PDF format:
www.dumpanalysis.org/Memory+Dump+Analysis+Anthology+Volume+4
It features:
- 15 new crash dump analysis patterns
- 13 new pattern interaction case studies
- 10 new trace analysis patterns
- 6 new Debugware patterns and case study
- Workaround patterns
- Updated checklist
- Fully cross-referenced with Volume 1, Volume 2 and Volume 3
- Memory visualization tutorials
- Memory space art
Its table of contents is available here:
http://www.dumpanalysis.org/MDAA/MDA-Anthology-V4-TOC.pdf
Paperback and hardcover versions should be available in a week or two. I also started working on Volume 5 that should be available in December.
- Dmitry Vostokov @ DumpAnalysis.org + TraceAnalysis.org -
Posted in .NET Debugging, Aesthetics of Memory Dumps, Announcements, AntiPatterns, Art, Assembly Language, Books, C and C++, CDF Analysis Tips and Tricks, Categorical Debugging, Common Mistakes, Complete Memory Dump Analysis, Computer Science, Countefactual Debugging, Crash Dump Analysis, Crash Dump Patterns, DebugWare Patterns, Debugging, Debugging Slang, Deep Down C++, Education and Research, Escalation Engineering, Fun with Crash Dumps, Fun with Debugging, Images of Computer Memory, Kernel Development, Memiotics (Memory Semiotics), Memoidealism, Memoretics, Memory Space Art, Memory Visualization, Memuonics, Metaphysics of Memory Worldview, Multithreading, Opcodism, Philosophy, Physicalist Art, Publishing, Science Fiction, Science of Memory Dump Analysis, Science of Software Tracing, Security, Software Architecture, Software Behavior Patterns, Software Defect Construction, Software Engineering, Software Narratology, Software Technical Support, Software Trace Analysis, Software Trace Reading, Software Victimology, Stack Trace Collection, Testing, Tools, Trace Analysis Patterns, Troubleshooting Methodology, Uses of UML, Victimware, Virtualization, Vista, Visual Dump Analysis, WinDbg Scripts, WinDbg Tips and Tricks, Windows 7, Windows Server 2008, Windows System Administration, Workaround Patterns, x64 Windows | No Comments »
Wednesday, October 20th, 2010
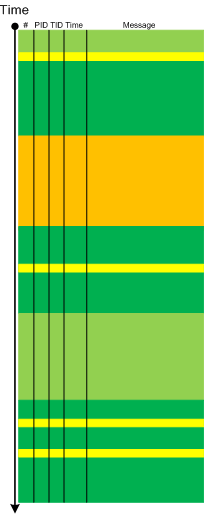
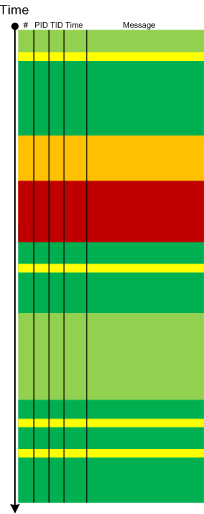
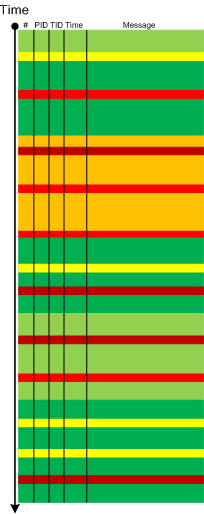
The next pattern with the name borrowed from historiography is Layered Periodization. This periodization of software trace messages includes individual messages, then aggregated messages from threads, then processes as wholes and finally individual computers (in client-server or similar sense). This is best illustrated graphically.
Message layer:
Thread layer (different colors correspond to different TID):
Process layer (different colors correspond to different PID):
Please note that it is also possible to have a periodization based on modules, functions and individual messages but it might be complicated because different threads can enter the same module or function and here other patterns more appropriate like Activity Region, Characteristic Message Block, and Background and Foreground Components.
- Dmitry Vostokov @ DumpAnalysis.org + TraceAnalysis.org -
Posted in CDF Analysis Tips and Tricks, Debugging, Software Trace Analysis, Software Trace Analysis and History, Software Trace Reading, Trace Analysis Patterns | No Comments »
Wednesday, October 13th, 2010
Sometimes, when we find an Anchor Message related to our problem description (for example, a COM port error) we are interested in its evolution throughout a software narrative:
#       PID     TID     Message

[...]

126303  5768    1272    OpenComPort returns Status = 0x0

[...]

231610  3464    1576    OpenComPort returns Status = 0x0

[...]

336535  5768    4292    OpenComPort returns Status = 0×0

[…]

423508  5252    2544    OpenComPort returns Status = 0xc000000f

[…]

531247  5768    5492    OpenComPort returns Status = 0xc000000f

[…]

639039  772     3404    OpenComPort returns Status = 0xc000000f

[…]
Then we can check activity between changes. We call this pattern Message Change.
- Dmitry Vostokov @ DumpAnalysis.org + TraceAnalysis.org -
Posted in CDF Analysis Tips and Tricks, Debugging, Software Trace Analysis, Trace Analysis Patterns | No Comments »
Tuesday, October 5th, 2010
The choice of webinars below mostly reflects my personal preferences and long time desire to speak on topics like systems thinking, troubleshooting tool design and development. The other topic about BSOD minidump analysis was requested by participants in an ongoing survey. There will be more topics in 2011. All forthcoming webinars will be hosted by Memory Dump Analysis Services. The planning list includes:
Systems Thinking in Memory Dump and Software Trace Analysis
Software Troubleshooting and Debugging Tools: Objects, Components, Patterns and Frameworks with UML
- UML basics
- DebugWare patterns
- Unified Troubleshooting Framework
- RADII software development process
- Hands-on exercise: designing and building a tool
Blue Screen Of Death Analysis Done Right: Minidump Investigation for System Administrators
- Making sense of !analyze –v output
- Get extra troubleshooting information with additional WinDbg commands
- Guessing culprits with raw stack analysis
- Who’s responsible: hardware or software?
- Checklist and patterns
- Including hands-on exercises: send your own minidumps
More detailed information will be available soon.
- Dmitry Vostokov @ DumpAnalysis.org + TraceAnalysis.org -
Posted in Announcements, CDF Analysis Tips and Tricks, Common Mistakes, Common Questions, Crash Analysis Report Environment (CARE), Crash Dump Analysis, Crash Dump De-analysis, Crash Dump Patterns, Crash Dumps for Dummies, DebugWare Patterns, Debugging, Debugging Industry, Debugging Methodology, Escalation Engineering, General Memory Analysis, Hermeneutics of Memory Dumps and Traces, Memory Systems Language, Minidump Analysis, Software Architecture, Software Behavior Patterns, Software Engineering, Software Technical Support, Software Trace Analysis, Software Tracing for Dummies, Structural Memory Patterns, Systems Thinking, Tools, Trace Analysis Patterns, Training and Seminars, Troubleshooting Methodology, Vista, Webinars, WinDbg Tips and Tricks, Windows 7, Windows Server 2008, Windows System Administration, x64 Windows | No Comments »
Monday, September 20th, 2010
Sometimes, when comparing normal, expected (working) and abnormal (non-working) traces we can get a clue for further troubleshooting and debugging by looking at module load events. For example, when we see an unexpected module loaded in our non-working trace, its function (and sometimes even module name) can signify some difference to pay attention to:
#     PID  TID  Time         Message

[...]

14492 6908 6912 11:06:41.953 LoadImageEvent: ImageName(\WINDOWS\system32\3rdPartySso.dll)

[...]
I call this pattern Guest Component and it is a different from Missing Component. Although in the latter pattern a missing component in one trace may appear in another but the component name is known apriori and expected. In the former pattern the component is unexpected. For example, in the trace above, its partial name fragment “Sso” may trigger a suggestion to relate differences in authentication where in a non-working case SSO (single sign-on) was configured.
- Dmitry Vostokov @ DumpAnalysis.org + TraceAnalysis.org -
Posted in CDF Analysis Tips and Tricks, Debugging, Software Trace Analysis, Trace Analysis Patterns | No Comments »
Sunday, September 19th, 2010
Finally, after the delay, the issue is available in print on Amazon and through other sellers:
Debugged! MZ/PE: Multithreading

- Dmitry Vostokov @ DumpAnalysis.org + TraceAnalysis.org -
Posted in .NET Debugging, Announcements, CDF Analysis Tips and Tricks, Citrix, Computer Science, Debugged! MZ/PE, Debugging, Memory Dump Analysis Services, Multithreading, Publishing, Science of Software Tracing, Software Trace Analysis, Software Trace Visualization, Tools, Trace Analysis Patterns, WinDbg Tips and Tricks | No Comments »
Monday, September 13th, 2010
Often we see errors in software traces recorded during deviant software behavior (often called non-working software traces) and when we double check their presence in normal expected software behavior traces (often called working traces) we find them there too. This pattern is called False Positive Error. I already mentioned similar false positives when I introduced the first software trace analysis pattern called Periodic Error. Here is an example from the real trace. In a non-working trace we found this error in an adjoint thread of a foreground component:
OpenProcess error 5
However, we found the same error in the working trace so we continued looking and found several other errors:
Message request report: last error 1168, …

[…]

GetMsg result -2146435043
The last one if converted to a hex status is 8010001D but, unfortunately, the same errors were present in the working trace too in the same activity regions.
After that we started comparing both traces looking for a bifurcation point and we found the error that was only present in a non-working trace with a significant trace differences after that:
Error reading from the named pipe: 800700E9
My favourite tool (WinDbg) to convert error and status values gave this description:
0:000> !error 800700E9

Error code: (HRESULT) 0x800700e9 (2147942633) - No process is on the other end of the pipe.
- Dmitry Vostokov @ DumpAnalysis.org + TraceAnalysis.org -
Posted in CDF Analysis Tips and Tricks, Debugging, Software Trace Analysis, Software Trace Reading, Trace Analysis Patterns, WinDbg Tips and Tricks | No Comments »
Friday, August 27th, 2010
Like in a literature (and in a narratology in general) we have components that trace themselves and components that tell the story of a computation including status updates they query about other components and subsystems. This pattern gets its name Diegetic Messages from diegesis. Here’s the difference between diegetic (in blue bold) and non-diegetic trace messages:
PID    TID    TIME          MESSAGE

11864  11912  06:34:53.598  ModuleA: foo called bar. Status OK.

11620  10372  06:34:59.754  ModuleB: ModuleA integrity check. Status OK.
Some modules may emit messages that tell about their status but from their message text we know the larger computation story like in a process startup sequence example.
- Dmitry Vostokov @ DumpAnalysis.org + TraceAnalysis.org -
Posted in CDF Analysis Tips and Tricks, Debugging, Software Narratology, Software Trace Analysis, Software Trace Reading, Trace Analysis Patterns | 1 Comment »
Tuesday, August 10th, 2010
Sometimes a software trace is truncated when the trace session was stopped prematurely, often when a problem didn’t manifest itself visually. We can diagnose such traces by their short time duration, missing anchor messages or components necessary for analysis. My favourite example is user session initialization in a Citrix terminal services environment when problem effects are visible only after the session is fully initialized and an application is launched but a truncated CDF trace only shows the launch of winlogon.exe despite the presence of a process creation trace provider or other components that record the process launch sequence and the trace itself lasts only a few seconds after that.
- Dmitry Vostokov @ DumpAnalysis.org + TraceAnalysis.org -
Posted in CDF Analysis Tips and Tricks, Debugging, Software Narratology, Software Trace Analysis, Software Trace Reading, Trace Analysis Patterns | 1 Comment »
Sunday, July 4th, 2010
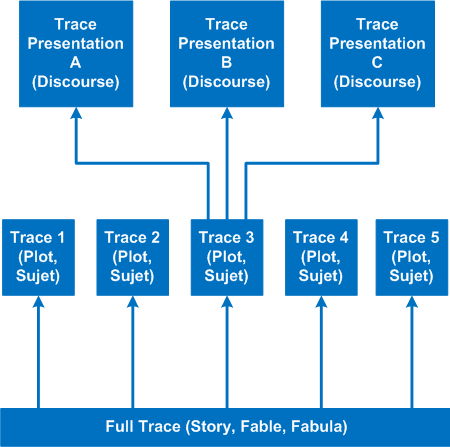
It’s time to introduce a conceptual software narratological framework for viewing software traces (using rich ETW / CDF tracing as our main focus). Here we consider a software story (fabula) as a full trace when every component was selected for tracing and emits debug messages during code execution paths. However, during viewing we can filter on and off certain modules, threads, processes, messages, etc. (adjoint threading) and see a different sub-story or plot (sujet). Every software plot (please do not confuse with PLOT acronym) can be presented differently (using appropriate discourse). Some presentational examples include temporal rearrangement, collapse of repetitive regions, source code hypertext (lexia) and allegorical devices such as message tool-tip comments. Here is a diagram that depicts story (fable, fabula) - plot (sujet) - presentation (discourse):
- Dmitry Vostokov @ DumpAnalysis.org + TraceAnalysis.org -
Posted in CDF Analysis Tips and Tricks, Debugging, Science of Software Tracing, Software Narratology, Software Trace Analysis, Software Trace Reading, Software Trace Visualization | No Comments »
Sunday, May 30th, 2010
Finally, after careful consideration, I’ve come up with the topic that has been neglected so far but at the same time important for both camps (kernel space and user space, including managed space): complete memory dump and software trace analysis. I plan to publish the first webinar agenda early in July and deliver the webinar in August (the date should be finalized by mid July).
PS. Sailing memory spaces under an RGB flag 

- Dmitry Vostokov @ DumpAnalysis.org + TraceAnalysis.org -
Posted in Announcements, CDF Analysis Tips and Tricks, Crash Analysis Report Environment (CARE), Crash Dump Analysis, Crash Dump Patterns, Debugging, DumpAnalysis and TraceAnalysis Logos, Escalation Engineering, Software Behavior Patterns, Software Technical Support, Software Trace Analysis, Software Troubleshooting Patterns, Tools, Trace Analysis Patterns, Training and Seminars, WinDbg Scripts, WinDbg Tips and Tricks | 2 Comments »
Tuesday, May 25th, 2010
Finally Citrix has published a tool (written by my colleague Colm Naish, lead escalation engineer) that allows controlled injection of events into CDF (ETW) trace message stream. This is useful in many troubleshooting scenarios where we need to rely on Significant Event and Anchor Message analysis patterns to partition traces into artificial Activity Regions to start our analysis with. This is also analogous for the imposition of the external time on the stream of tracing events from software narratology perspective:
CDFMarker On Demand - For XenApp and XenDesktop
- Dmitry Vostokov @ DumpAnalysis.org + TraceAnalysis.org -
Posted in Announcements, CDF Analysis Tips and Tricks, Citrix, Debugging, Escalation Engineering, Software Engineering, Software Narratology, Software Technical Support, Software Trace Analysis, Software Trace Reading, Tools, Trace Analysis Patterns | 1 Comment »
Monday, May 10th, 2010
This pattern is similar to No Component Symbols memory analysis pattern and is called No Trace Metafile:
#     Module    PID  TID  Time        Message

21372 \src\dllA 2968 5476 3:55:10.004 Calling foo()

21373 Unknown   2968 5476 3:55:10.004 ????? Unknown( 27): GUID=1EF56EBD-A7FC-4892-8DBA-00AD813F8A24 (No Format Information found).

21374 Unknown   2968 5476 3:55:10.004 ????? Unknown( 27): GUID=1EF56EBD-A7FC-4892-8DBA-00AD813F8A24 (No Format Information found).

21375 Unknown   2968 5476 3:55:10.004 ????? Unknown( 27): GUID=1EF56EBD-A7FC-4892-8DBA-00AD813F8A24 (No Format Information found).

21376 Unknown   2968 5476 3:55:10.004 ????? Unknown( 28): GUID=1EF56EBD-A7FC-4892-8DBA-00AD813F8A24 (No Format Information found).

21377 Unknown   2968 5476 3:55:10.004 ????? Unknown( 23): GUID=1EF56EBD-A7FC-4892-8DBA-00AD813F8A24 (No Format Information found).

21378 \src\dllA 2968 5476 3:55:10.004 Calling bar()
In some case when we don’t have TMF files it is possible to detect broad behavioral patterns such as:
By looking at Thread of Activity we can also sometimes infer the possible component name based on surrounding trace messages with present TMF files, escpecially when we have source code access. For example, in the trace above it can be dllA or any other module that foo function calls.
- Dmitry Vostokov @ DumpAnalysis.org + TraceAnalysis.org -
Posted in CDF Analysis Tips and Tricks, Debugging, Software Trace Analysis, Trace Analysis Patterns | No Comments »
Thursday, May 6th, 2010
Befind every trace and its messages is source code:
Borrowing the acronym PLOT (Program Lines of Trace) we now try to discern basic source code patterns that give rise to simple message patterns in software traces. There are only a few distinct PLOTs and the ability to mentally map trace statements to source code is crucial to software trace reading and comprehension. More about that in subsequent parts. More complex message patterns (for example, specific message blocks or correlated messages) arise from supportable and maintainable realizations of architectural, design and implementation patterns and will be covered in another post series.
I was thinking about acronym SLOT (Source Lines of Trace) but decided to use PLOT because it metaphorically bijects into literary theory and narrative plots.
Forthcoming CDF and ETW Software Trace Analysis: Practical Foundations
- Dmitry Vostokov @ DumpAnalysis.org + TraceAnalysis.org
Posted in C and C++, CDF Analysis Tips and Tricks, Code Reading, Debugging, Science of Software Tracing, Software Architecture, Software Engineering, Software Narratology, Software Trace Analysis, Software Trace Reading | 2 Comments »
Sunday, April 18th, 2010
OpenTask to offer first 3 volumes of Memory Dump Analysis Anthology in one set:


The set is available exclusively from OpenTask e-Commerce web site starting from June. Individual volumes are also available from Amazon, Barnes & Noble and other bookstores worldwide.
Product information:
- Title: Modern Memory Dump and Software Trace Analysis: Volumes 1-3
- Author: Dmitry Vostokov
- Language: English
- Product Dimensions: 22.86 x 15.24
- Paperback: 1600 pages
- Publisher: Opentask (31 May 2010)
- ISBN-13: 978-1-906717-99-5
Information about individual volumes:
- Dmitry Vostokov @ DumpAnalysis.org + TraceAnalysis.org -
Posted in .NET Debugging, Aesthetics of Memory Dumps, Announcements, AntiPatterns, Art, Assembly Language, Books, Bugchecks Depicted, C and C++, CDA Pattern Classification, CDF Analysis Tips and Tricks, Categorical Debugging, Certification, Citrix, Code Reading, Common Mistakes, Computational Ghosts and Bug Hauntings, Computer Science, Countefactual Debugging, Crash Analysis Report Environment (CARE), Crash Dump Analysis, Crash Dump Patterns, Crash Dumps for Dummies, Data Recovery, DebugWare Patterns, Debugging, Debugging Methodology, Debugging Slang, Deep Down C++, Dictionary of Debugging, Dr. Watson, Education and Research, Escalation Engineering, Fun with Crash Dumps, Futuristic Memory Dump Analysis, GDB for WinDbg Users, Hardware, History, Horrors of Computation, Hyper-V, Intelligent Memory Movement, Kernel Development, Laws of Troubleshooting and Debugging, Mathematics of Debugging, Memiotics (Memory Semiotics), Memoidealism, Memoretics, Memory Analysis Culture, Memory Analysis Forensics and Intelligence, Memory Auralization, Memory Dump Analysis Jobs, Memory Religion (Memorianity), Memory Space Art, Memory Space Music, Memory Systems Language, Memory Visualization, Memuonics, Minidump Analysis, Multithreading, Music for Debugging, Music of Computation, New Acronyms, New Words, Occult Debugging, Philosophy, Psi-computation, Publishing, Science of Memory Dump Analysis, Science of Software Tracing, Security, Software Architecture, Software Defect Construction, Software Engineering, Software Generalist, Software Maintenance Institute, Software Narratology, Software Technical Support, Software Trace Analysis, Software Trace Visualization, Software Tracing for Dummies, Software Victimology, Stack Trace Collection, Testing, Tools, Trace Analysis Patterns, Training and Seminars, Troubleshooting Methodology, Victimware, Virtualization, Vista, Visual Dump Analysis, WinDbg Scripts, WinDbg Tips and Tricks, WinDbg for GDB Users, Windows 7, Windows Server 2008, Windows System Administration | No Comments »
Monday, April 12th, 2010
When a software trace is lengthy it is useful to partition it into several regions based on a sequence of Anchor Messages. The choice of them can be determined by a Vocabulary Index or an Adjoint Thread of Activity. For example, an ETW trace with almost 900,000 messages recorded during a desktop connection for 6 minutes can be split into 14 segments by the adjoint thread of DLL_PROCESS_ATTACH message (the message was generated by DllMain of an injected module, not shown in the trace output for formatting clarity):
#      PID  TID  Time         Message

24226  2656 3480 10:41:05.774 AppA.exe: DLL_PROCESS_ATTACH

108813 4288 4072 10:41:05.774 AppB.exe: DLL_PROCESS_ATTACH

112246 4180 3836 10:41:05.940 DllHost.exe: DLL_PROCESS_ATTACH

135473 2040 3296 10:41:12.615 AppC.exe: DLL_PROCESS_ATTACH

694723 1112 1992 10:44:23.393 AppD.exe: DLL_PROCESS_ATTACH

703962 5020 1080 10:44:42.014 DllHost.exe: DLL_PROCESS_ATTACH

705511 4680 3564 10:44:42.197 DllHost.exe: DLL_PROCESS_ATTACH

705891 1528 2592 10:44:42.307 regedit.exe: DLL_PROCESS_ATTACH

785231 2992 4912 10:45:26.516 AppE.exe: DLL_PROCESS_ATTACH

786523 3984 1156 10:45:26.605 powershell.exe: DLL_PROCESS_ATTACH

817979 4188 4336 10:45:48.707 wermgr.exe: DLL_PROCESS_ATTACH

834875 3976 1512 10:45:52.342 LogonUI.exe: DLL_PROCESS_ATTACH

835229 4116 3540 10:45:52.420 AppG.exe: DLL_PROCESS_ATTACH
Each region can be analyzed independently for any anomalies, for example, to look for the answer to the question why wermgr.exe was launched. An example of partitioning is illustrated on the following schematic diagram:
It is also possible to make another trace segmentation by interleaving regions above with another set of anchor messages comprising of the adjoint thread of DLL_PROCESS_DETACH message:
- Dmitry Vostokov @ DumpAnalysis.org + TraceAnalysis.org -
Posted in CDF Analysis Tips and Tricks, Debugging, Software Trace Analysis, Trace Analysis Patterns | 3 Comments »
Friday, April 9th, 2010
Plan to start providing training and seminars in my free time. If you are interested please answer these questions (you can either respond here in comments or use this form for private communication http://www.dumpanalysis.org/contact):
- Are you interested in on-site training, prefer traveling or attending webinars?
- Are you interested in software trace analysis as well?
- What specific topics are you interested in?
- What training level (beginner, intermediate, advanced) are you interested in? (please provide an example, if possible)
Additional topics of expertise that can be integrated into training include Source Code Reading and Analysis, Debugging, Windows Architecture, Device Drivers, Troubleshooting Tools Design and Implementation, Multithreading, Deep Down C and C++, x86 and x64 Assembly Language Reading.
Looking forward to your responses. Any suggestions are welcome.
- Dmitry Vostokov @ DumpAnalysis.org + TraceAnalysis.org -
Posted in .NET Debugging, Announcements, AntiPatterns, Assembly Language, Bugchecks Depicted, C and C++, CDA Pattern Classification, CDF Analysis Tips and Tricks, Certification, Code Reading, Common Mistakes, Crash Analysis Report Environment (CARE), Crash Dump Analysis, Crash Dump Patterns, Crash Dumps for Dummies, Data Recovery, DebugWare Patterns, Debugging, Debugging Methodology, Deep Down C++, Education and Research, Escalation Engineering, FreeBSD Crash Corner, GDB for WinDbg Users, Hardware, Hyper-V, Java Debugging, Kernel Development, Laws of Troubleshooting and Debugging, Linux Crash Corner, Mac Crash Corner, Memory Analysis Forensics and Intelligence, Memory Visualization, Minidump Analysis, Multithreading, Security, Software Architecture, Software Defect Construction, Software Engineering, Software Generalist, Software Maintenance Institute, Software Narratology, Software Technical Support, Software Trace Analysis, Software Trace Visualization, Software Tracing for Dummies, Software Victimology, Stack Trace Collection, Testing, Tools, Trace Analysis Patterns, Training and Seminars, Troubleshooting Methodology, Victimware, Virtualization, Vista, Visual Dump Analysis, WinDbg Scripts, WinDbg Tips and Tricks, WinDbg for GDB Users, Windows 7, Windows Server 2008, Windows System Administration, Workaround Patterns | No Comments »
Thursday, April 8th, 2010
“Capturing delicate moments, one gives birth to a poetry of traces …”
Ange Leccia, Motionless Journeys, by Fabien Danesi
More patterns from software narratology. Now we illustrate Defamiliarizing Effect where we see sudden unfamiliar trace statements across familiar landscape of characteristic blocks and activity regions:
/familar traces/
/new trace from a problem system/
- Dmitry Vostokov @ DumpAnalysis.org + TraceAnalysis.org -
Posted in CDF Analysis Tips and Tricks, Citrix, Debugging, Software Narratology, Software Trace Analysis, Software Trace Visualization, Trace Analysis Patterns | 1 Comment »
Thursday, April 8th, 2010
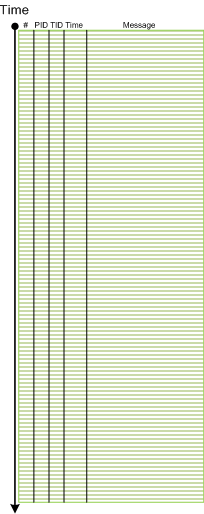
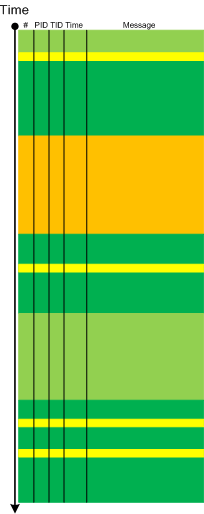
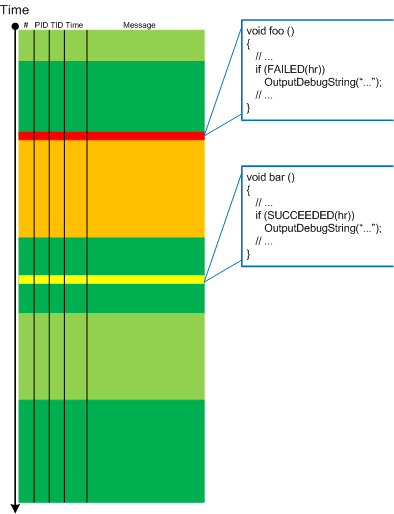
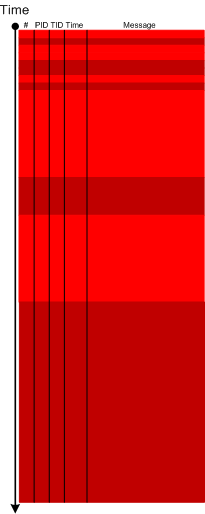
Metaphorical bijection from literary narratology to software narratology provides a pattern of Background and Foreground Components. This can be easily illustrated on pseudo-trace color diagrams. Suppose we troubleshoot a graphical issue using an ETW trace containing the output from all components of the problem system. Graphic components and their messages are foreground for a trace viewer (a person) against numerous background components (for example, database, file and registry access, shown in shades of green):
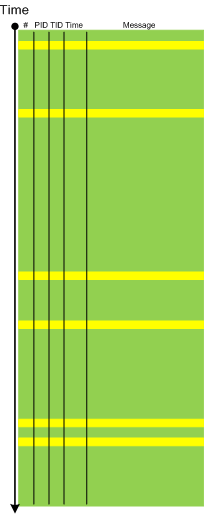
Trace viewers (for example, CDFAnalyzer) can filter out background component messages and present only foreground components (that I propose to call component foregrounding):
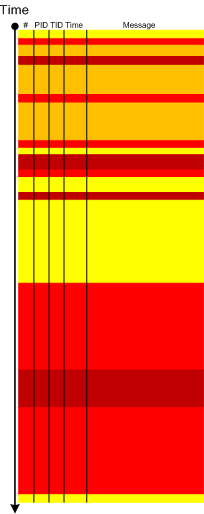
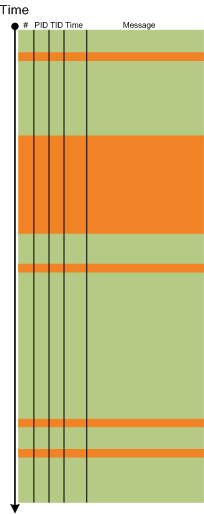
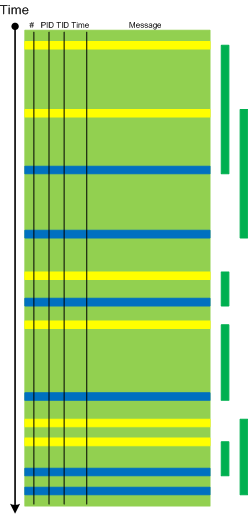
Of course, this process is iterative and parts of what once was foreground become background and candidates for further filtering:
- Dmitry Vostokov @ DumpAnalysis.org + TraceAnalysis.org -
Posted in CDF Analysis Tips and Tricks, Citrix, Debugging, Software Narratology, Software Trace Analysis, Software Trace Visualization, Tools, Trace Analysis Patterns | 2 Comments »