Archive for the ‘CDF Analysis Tips and Tricks’ Category
Sunday, November 16th, 2014
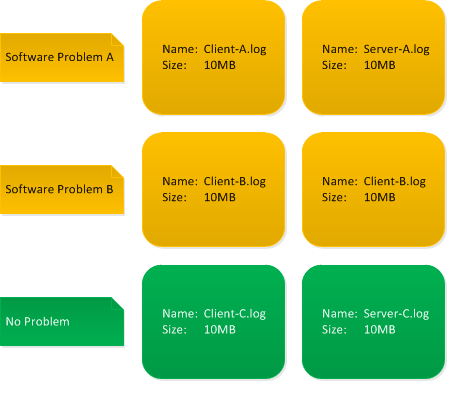
Trace and log analysis starts with assessment of artifact File Size, especially with multiple logging scenarios in distributed systems. If all log files are of the same size we might have either Circular Traces or Truncated Traces. Both point to wrong trace timing plan or just using default tracing tool configuration.
- Dmitry Vostokov @ DumpAnalysis.org + TraceAnalysis.org -
Posted in CDF Analysis Tips and Tricks, Software Trace Analysis, Software Trace Analysis Tips and Tricks, Trace Acquisition Patterns, Trace Analysis Patterns, Trace Analysis and Topology | No Comments »
Tuesday, November 11th, 2014
Trace messages may correspond to specific implementation code such as recording the status of an operation, dumping data values, printing errors, or they may correspond to higher levels of software design and architecture, and even to use case stories. We call such messages Milestones by analogy with project management. Alternative names can be Chapter Messages, Summary Messages, Checkpoints, or Use Case Messages. These are different from Macrofunctions which are collections messages grouped by some higher function. Milestone messages are specifically designed distinct trace statements:
They can also be a part of Significant Events, serve the role of Anchor Messages, and be a part of Basic Facts and Vocabulary Index.
- Dmitry Vostokov @ DumpAnalysis.org + TraceAnalysis.org -
Posted in CDF Analysis Tips and Tricks, Software Narratology, Software Trace Analysis, Software Trace Reading, Software Tracing Design, Trace Analysis Patterns | No Comments »
Sunday, November 9th, 2014
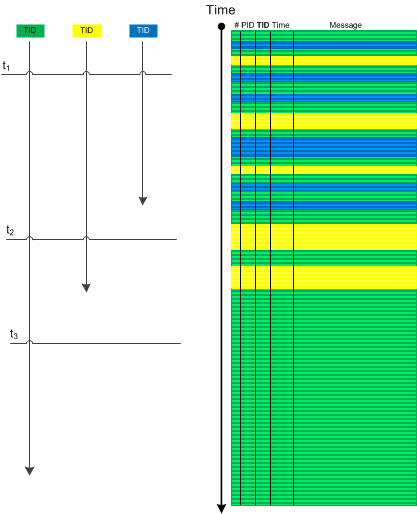
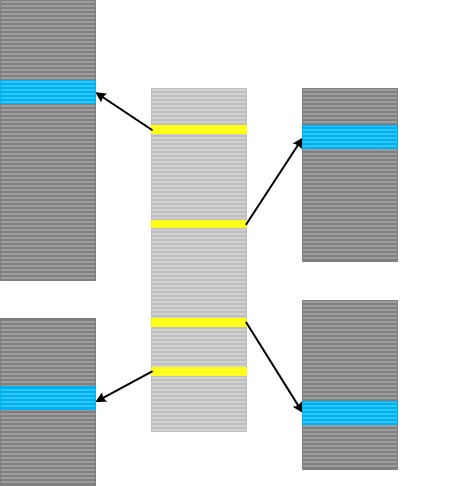
Sometimes we have several use case instances traced in one log file. Messages and Activity Regions from many Use Case Trails intermingle and make analysis difficult especially with the absence of UCID (Use Case ID), any other identification tags, or Message Links. However, initially most of the time we are interested in a sequence of Significant Events. After finding Anchor Messages we can use Time Deltas to differentiate between trace statements from different Use Case Trails. Here we assume correct Event Sequence Order. We call this pattern Event Sequence Phase by analogy with wave phases (all such individual “waves” may have different “shapes” due to various delays between different stages of their use case and implementation narratives):
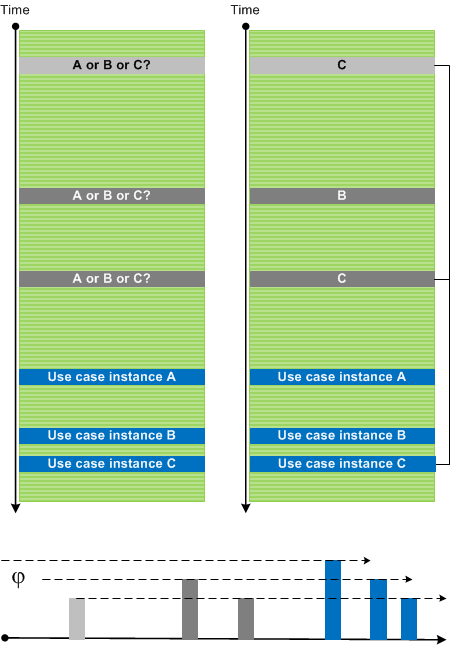
In the picture above we also identified Dominant Event Sequence for use case instance C.
- Dmitry Vostokov @ DumpAnalysis.org + TraceAnalysis.org -
Posted in CDF Analysis Tips and Tricks, Software Trace Analysis, Software Trace Analysis Tips and Tricks, Software Trace Reading, Trace Analysis Patterns, Trace Analysis and Physics | No Comments »
Sunday, November 9th, 2014
Use cases are implemented in various components such as subsystems, processes, modules, and source code files. Most of the time with good tracing implementation we are able to see Use Case Trails: log messages corresponding to use case scenarios. For simple systems one log may fully correspond to just one use case, but for complex systems, especially distributed client-server ones, there may be several use case instances present simultaneously in one log. One way to disentangle them in the absence of UCID (Use Case ID) or some other grouping tag is to use Event Sequence Phase, the subject of the next pattern.
Master Traces may also correspond to use cases but they should ideally correspond to only one use case instance.
- Dmitry Vostokov @ DumpAnalysis.org + TraceAnalysis.org -
Posted in CDF Analysis Tips and Tricks, Debugging, Log Analysis, Software Architecture, Software Trace Analysis, Software Trace Deconstruction, Software Trace Reading, Trace Analysis Patterns | No Comments »
Thursday, June 26th, 2014
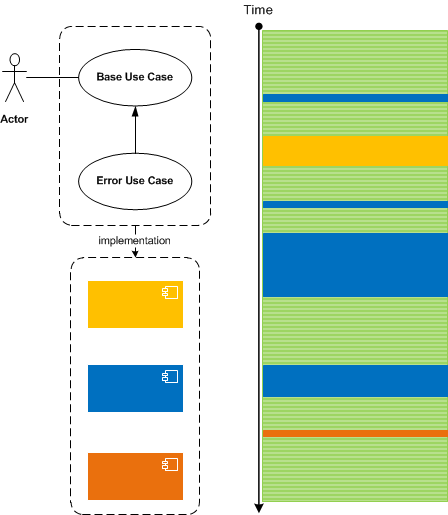
Usually when we analyse traces and find an Anchor or Error Message we do backtracking using a combination of Data Flow and Message Sets and selecting appropriate log messages to form Back Trace leading to a possible root cause message:
This pattern is different from Error Thread pattern which just backtracks messages having the same TID (or in general ATID). It is also different from Exception Stack Trace pattern which is just a serialized stack trace from memory snapshot.
- Dmitry Vostokov @ DumpAnalysis.org + TraceAnalysis.org -
Posted in CDF Analysis Tips and Tricks, Debugging, Log Analysis, Software Trace Analysis, Trace Analysis Patterns | No Comments »
Sunday, May 25th, 2014
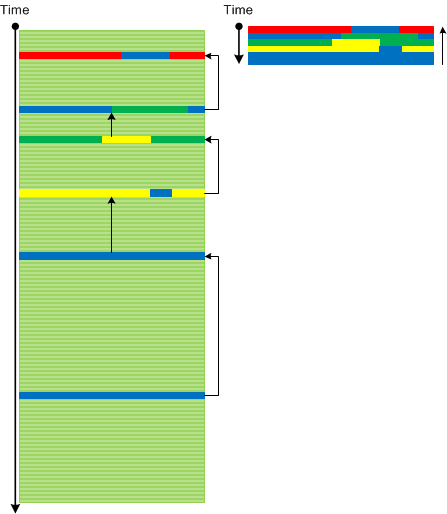
Sometimes we have several Threads of Activity (for example, from the same process) visible for a certain period of time and then suddenly we see only one such thread till the end of a trace (or even none). This may be an indication of an application hang or some other abnormal behaviour if several active threads doing logging are normal. If we consider such activities (including Adjoint Threads) as vectors running through some temporal “surface” we can use an analogy of a divergence and call this analysis pattern Activity Divergence:
- Dmitry Vostokov @ DumpAnalysis.org + TraceAnalysis.org -
Posted in CDF Analysis Tips and Tricks, Log Analysis, Software Trace Analysis, Trace Analysis Patterns | 1 Comment »
Tuesday, May 20th, 2014
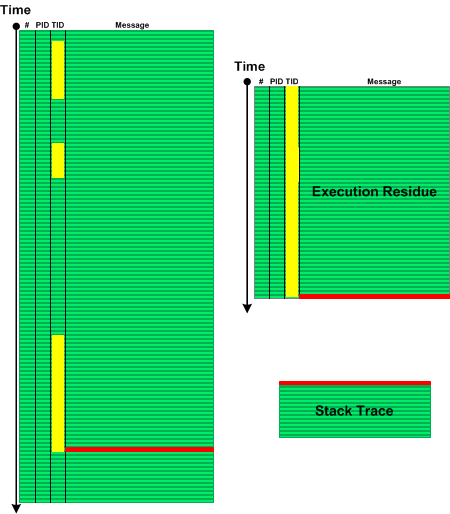
When we see Error Message or Exception Stack Trace in a log file we might want to explore the sequence of messages from the same Thread of Activity that led to the error. Such Message Set has an analogy with memory analysis patterns such as Execution Residue (of partial stack traces without overwrites) and Stack Trace (where the error message is a top stack frame) and we call this pattern Error Thread:
- Dmitry Vostokov @ DumpAnalysis.org + TraceAnalysis.org -
Posted in CDF Analysis Tips and Tricks, Crash Dump Patterns, Debugging, Log Analysis, Software Trace Analysis, Software Trace Reading, Trace Analysis Patterns | No Comments »
Monday, May 12th, 2014
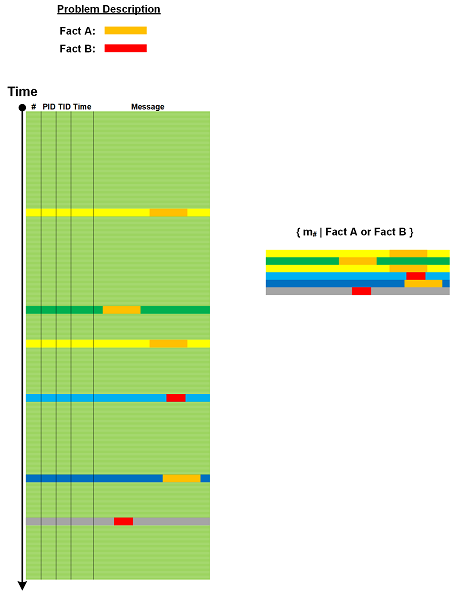
Most of the time, especially for large software logs, we need to select messages based on some criteria be it a set of Error Messages, a set of messages containing Basic Facts, or some other predicate. Then we can use selected messages from that Message Set as Anchor Messages or reverse Pivot Messages as an aid in further analysis.
- Dmitry Vostokov @ DumpAnalysis.org + TraceAnalysis.org -
Posted in CDF Analysis Tips and Tricks, Log Analysis, Software Trace Analysis, Software Trace Reading, Trace Analysis Patterns | No Comments »
Sunday, December 22nd, 2013
Activity Regions or blocks of messages having the same TID or PID usually follow each other in a typical complex software trace. Such following can be completely random and independent or it may be linear based on IPC or some inter-thread communication mechanism. For example, after filtering out Background Components we my find that an RPC client call setup is followed by messages from an RPC server:
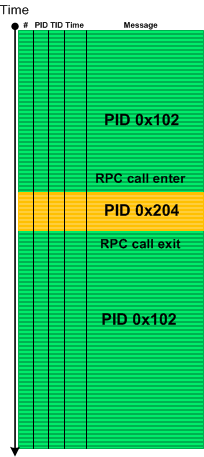
Using a coordinate approach with message number and PID axes we can reformat this minimal trace diagram:
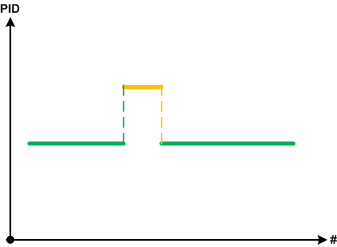
We call such pattern Piecewise Activity where we borrowed the concept of a piecewise linear function in mathematics (and piecewise continuity). In some problem software behaviour scenarios where we encountered such analysis pattern it was complemented by Discontinuity pattern. For example, an RPC call may be blocked and we don’t see client messages after that break till the end of the trace. In such cases we always recommended forcing a complete memory dump to check for wait chain memory analysis patterns.
- Dmitry Vostokov @ DumpAnalysis.org + TraceAnalysis.org -
Posted in CDF Analysis Tips and Tricks, Crash Dump Analysis, Crash Dump Patterns, Log Analysis, Software Trace Analysis, Trace Analysis Patterns | 1 Comment »
Tuesday, May 21st, 2013
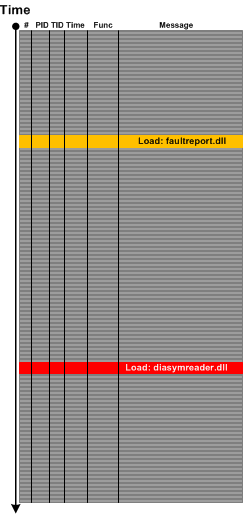
Sometimes we look at a trace or log and instead of Error Messages we only see their “signs” such as a DLL load event for an error or fault reporting module or a module that is related to symbol files such diasymreader.dll. We call this pattern Hidden Error by an analogy to Hidden Exception in memory dump analysis pattern catalogue although sometimes we can see such modules in memory dump Module Collection. For example, the presence of diasymreader module may signify an unreported .NET exception and suggest a dump collection strategy.
- Dmitry Vostokov @ DumpAnalysis.org + TraceAnalysis.org -
Posted in .NET Debugging, CDF Analysis Tips and Tricks, Log Analysis, Process Monitor Log Analysis, Software Trace Analysis, Software Trace Reading, Trace Analysis Patterns | No Comments »
Saturday, May 4th, 2013
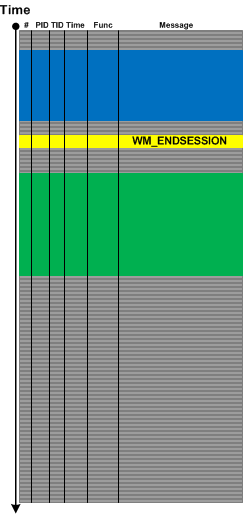
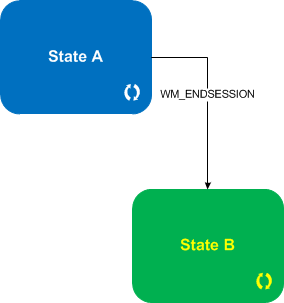
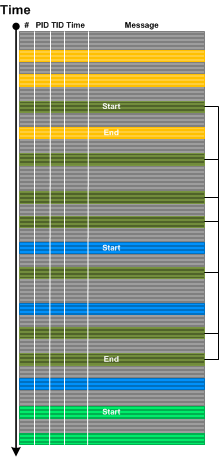
For event- or message-driven architectures it is important to differentiate between event and state messages (including state transition). For example, a system may be doing some work while being in some particular state with a lot of tracing and respond to various external events with each of them having a corresponding trace message. Upon such an event the system transitions to some other state with its own set of possible trace messages. We call such a pattern State and Event. Typical example here is a windowing terminal services system and WM_ENDSESSION event illustrated in the following abstract trace diagram with a corresponding state transition diagram below it:
- Dmitry Vostokov @ DumpAnalysis.org + TraceAnalysis.org -
Posted in CDF Analysis Tips and Tricks, Log Analysis, Software Trace Analysis, Software Trace Reading, Trace Analysis Patterns | No Comments »
Wednesday, March 20th, 2013
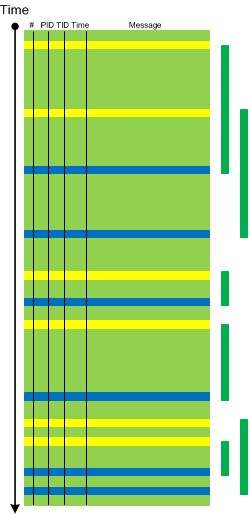
Sometimes we have insufficiently detailed problem description and/or there are several similar parallel user activities going on simultaneously, for example, several session are launched in a terminal services environment. In such cases when tracing is done for the duration of specific user activity Dominant Event Sequence pattern may help. Here we select the most full sequence of events or event sequence based on some Basic Facts. For example, if session id was missing in problem description we can choose the most long and full process launch seqence and assume that its session id was the one missing:
- Dmitry Vostokov @ DumpAnalysis.org + TraceAnalysis.org -
Posted in CDF Analysis Tips and Tricks, Software Trace Analysis, Software Trace Reading, Trace Analysis Patterns | No Comments »
Friday, February 8th, 2013
Indexical Trace pattern describes an Inter-Correlation pattern variant when we have a trace that has messages of interest pointing to specific activity regions in another trace. The latter trace can be very huge, from another computer and split into many parts (Split Trace). This pattern is very helpful when the problem needs to be diagnosed in the large split trace but we don’t know when it happened. Then an index trace that may have recorded software execution account (for example, in the case of a broker-like architecture) and can point to the right trace fragment from the split trace.
- Dmitry Vostokov @ DumpAnalysis.org + TraceAnalysis.org -
Posted in CDF Analysis Tips and Tricks, Debugging, Software Architecture, Software Trace Analysis, Software Trace Reading, Trace Analysis Patterns | No Comments »
Thursday, December 13th, 2012
Some tracing tools such as Citrix CDFControl have an option to split software traces and logs into several files during long recording. Although this should be done judiciously it is really necessary sometimes. We call this pattern Split Trace. What to do if we get several trace files and we want to use some other analysis tool such as Citrix CDFAnalyzer? If we know that the problem happened just before the tracing was stopped we can look at the last few such files from the file sequence (although we recommend a circular trace here). Otherwise we can convert them into CVS files and import into Excel which also supports adjoint threading.
- Dmitry Vostokov @ DumpAnalysis.org + TraceAnalysis.org -
Posted in CDF Analysis Tips and Tricks, Debugging, Software Trace Analysis, Software Trace Analysis Tips and Tricks, Software Trace Reading, Trace Analysis Patterns | No Comments »
Tuesday, December 11th, 2012
We have decided to factor out Anchor Messages example of message interleave into another pattern called Message Interleave. It covers superposition of different anchor messages, for example, process launch and exit, or DLL load and unload:
- Dmitry Vostokov @ DumpAnalysis.org + TraceAnalysis.org -
Posted in CDF Analysis Tips and Tricks, Debugging, Software Trace Analysis, Software Trace Analysis Tips and Tricks, Trace Analysis Patterns | No Comments »
Saturday, December 8th, 2012
Sometimes we don’t see anything in the trace or see very little because particular source code fragment was not covered by trace statements (see also PLOTs):
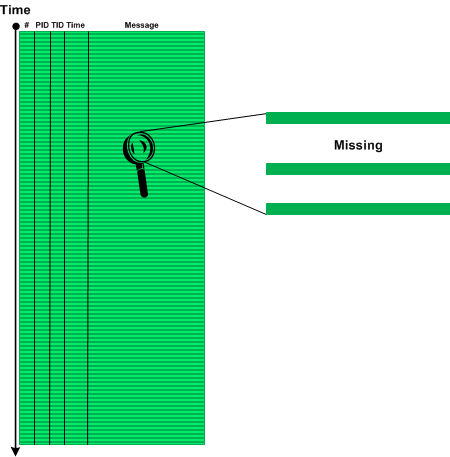
We call this pattern Sparse Trace and this is different from Missing Component pattern where some modules were not included for tracing explicitly although there is tracing code there or Visibility Limit pattern where tracing is intrinsically impossible. Often technical support and escalation engineers request to add more trace statements and software engineers extend tracing coverage iteratively as needed.
- Dmitry Vostokov @ DumpAnalysis.org + TraceAnalysis.org -
Posted in CDF Analysis Tips and Tricks, Debugging, Software Trace Analysis, Software Trace Reading, Trace Analysis Patterns | No Comments »
Tuesday, November 13th, 2012
Most of the time it is not possible to trace from the beginning. Obviously, internal application tracing cannot trace anything before that application start and its early initialization. The same is for system wide tracing which cannot trace before the tracing subsystem or service starts. Therefore, each log has its Visibility Limit in addition to possible truncation or missing components:

One of solutions would be to use different tracing tools and inter-correlation to glue activities, for example, Process Monitor and CDFControl.
- Dmitry Vostokov @ DumpAnalysis.org + TraceAnalysis.org -
Posted in CDF Analysis Tips and Tricks, Software Trace Analysis, Trace Analysis Patterns | 1 Comment »
Sunday, October 21st, 2012
Empty Trace is another trivial missing pattern that we need to add to make software log analysis pattern system complete. It ranges from a totally empty trace message list where only a meta-trace header (if any) describing overall trace structure is present to a few messages where we expect thousands. This is also an extreme case of Truncated Trace, No Activity and Missing Component patterns for a trace taken as a whole. Note, that an empty trace file doesn’t necessarily have a zero file size because a tracing architecture may preallocate some file space for block data writing.
- Dmitry Vostokov @ DumpAnalysis.org + TraceAnalysis.org -
Posted in CDF Analysis Tips and Tricks, Software Technical Support, Software Trace Analysis, Trace Analysis Patterns | No Comments »
Sunday, October 21st, 2012
While working on Accelerated Windows Software Trace Analysis training I discovered some missing patterns needed for completeness despite their triviality. One of them is called Error Message. Here an error is reported either explicitly (”operation failed”) or implicitly as an operation status result such as 0xC00000XX. Sometimes, a trace message designer specifies that the number value was supplied for information only and should be ignored. Some error messages may contain information that is not relevant for the current software incident, the so called false positive errors. Some tracing architectures and tools include message information category for errors, such as Citrix CDF (ETW-based) where you filter by error category to get an adjoint thread. Note, that the association of a trace statement with an error category is left at the discretion of an engineer writing code and information category messages may contain implicit errors such as last error and return status reports.
- Dmitry Vostokov @ DumpAnalysis.org + TraceAnalysis.org -
Posted in CDF Analysis Tips and Tricks, Debugging, Software Trace Analysis, Trace Analysis Patterns | 2 Comments »
Tuesday, July 3rd, 2012
When depicting trace analysis patterns I used two-dimensional diagrams based on CDF (ETW) traces such as this one for a bifurcation point:

While working today on a new pattern I needed a new expressive way to graphically illustrate the same idea of trace bifurcation points but without too much drawing. Traces from particle chambers and scattering diagrams came to my imagination after draw the first few diagrams illustrating bifurcation points:

Time directional arrow end can be omitted:

Trace variation after a bifurcation point can be indicated by angle partition:

The case when a variation also happens before is illustrated on this diagram:

and the case with several bifurcations:

Are N-bifurcations like on the diagram below possible?

Yes, they are, if the course of execution depends on some non-binary trace message parameter such as a loaded module that implements a required interface differently.
- Dmitry Vostokov @ DumpAnalysis.org + TraceAnalysis.org -
Posted in CDF Analysis Tips and Tricks, Event Tracing for Windows (ETW), Science of Software Tracing, Software Narratology, Software Trace Analysis, Software Trace Diagramming, Software Trace Visualization, Trace Analysis Patterns | 1 Comment »