In one complete memory dump taken from the system refusing user connections but not hung completely we can see the signs of past pool allocation failures (see Insufficient Memory):
0: kd> !vm

[...]

       PagedPool Usage:       47391 (    189564 Kb)

       PagedPool Maximum:     67584 (    270336 Kb)
       ********** 981 pool allocations have failed **********

[…]
We check paged pool usage but the output is inconsistent (shown in magenta color):
0: kd> !poolused 4

   Sorting by  Paged Pool Consumed
  Pool Used:

            NonPaged            Paged

 Tag    Allocs     Used    Allocs     Used

 LSmi        0        0        -1 4294967240 BlockTypeMisc

 PpEE        0        0        -1 4294967040 PNP_DEVICE_EVENT_ENTRY_TAG , Binary: nt!pnp

 CM         58     2320        -1 4294967000 Configuration Manager (registry) , Binary: nt!cm

 SeSc        0        0       -65 4294966112 Captured Security Descriptor , Binary: nt!se

 RxMs        1     1096       -99 4294947312 misc.

 CM38        0        0        -2 4294942720 Internal Configuration manager allocations , Binary: nt!cm

 RxFc        0        0        -8 4294879664 FCB

 Lfs         0        0      -907 4294872976 Lfs allocations

 xSMB        0        0      -179 4293500928 IFSKIT sample SMB mini-redirector , Binary: smbmrx.sys

 AAAA        4      224       581 51639048 UNKNOWN pooltag ‘AAAA’, please update pooltag.txt

 BBBB        2    65664      2582 16362984 UNKNOWN pooltag ‘BBBB’, please update pooltag.txt

 MmSt        0        0     10718 14944776 Mm section object prototype ptes , Binary: nt!mm

[…]
However we see that drivers using AAAA and BBBB consumed almost 65Mb and we can search for them as described here.
Dumping processes we notice signs of possible handle leak:
0: kd> !process 0 0

[...]

PROCESS 89ac09c0  SessionId: 0  Cid: 04b0    Peb: 7ffd5000  ParentCid: 0480

    DirBase: cc210000  ObjectTable: e13991a0  HandleCount: 3329.

    Image: csrss.exe
PROCESS 89ae4508  SessionId: 0  Cid: 07a8    Peb: 7ffdf000  ParentCid: 04f4

    DirBase: cb330000  ObjectTable: e115c220  HandleCount: 4476.

    Image: svchost.exe
PROCESS 868d1d88  SessionId: 0  Cid: 4120    Peb: 7ffd8000  ParentCid: 04f4

    DirBase: 95558000  ObjectTable: e1135428  HandleCount: 2255.

    Image: AppC.exe

[…]
We see lots of threads in the process 89ae4508 waiting for LPC reply:
0: kd> !thread 86b64388 1f

THREAD 86b64388  Cid 07a8.0fbc  Teb: 7ff73000 Win32Thread: bc173ac0 WAIT: (Unknown) UserMode Non-Alertable

    86b64574  Semaphore Limit 0x1

Waiting for reply to LPC MessageId 06345018:

Current LPC port e169dd90

Impersonation token:  e492a6c0 (Level Impersonation)

DeviceMap                 e1603ce8

Owning Process            89ae4508       Image:         svchost.exe

Wait Start TickCount      148053822      Ticks: 23982406 (4:08:05:25.093)

Context Switch Count      11                 LargeStack

UserTime                  00:00:00.000

KernelTime                00:00:00.000

Win32 Start Address DllA!ThreadEntry (0×752e27fe)

Start Address kernel32!BaseThreadStartThunk (0×77e6b5f3)

Stack Init 901e5000 Current 901e4c08 Base 901e5000 Limit 901e2000 Call 0

Priority 10 BasePriority 8 PriorityDecrement 0

Kernel stack not resident.
Now we follow LPC wait chain:
0: kd> !lpc message 06345018

Searching message 6345018 in threads ...

Client thread 86b64388 waiting a reply from 6345018

    Server thread 87f0d790 is working on message 6345018

[…]
0: kd> !thread 87f0d790 1f

THREAD 87f0d790  Cid 0de4.5b2c  Teb: 7ff8f000 Win32Thread: 00000000 WAIT: (Unknown) UserMode Non-Alertable

    87f0d97c  Semaphore Limit 0x1

Waiting for reply to LPC MessageId 0634501d:

Current LPC port eb2e6450

Impersonation token:  e93ff870 (Level Impersonation)

DeviceMap                 e1603ce8

Owning Process            89c36690       Image:         AppA.exe

Wait Start TickCount      113650910      Ticks: 58385318 (10:13:24:30.593)

Context Switch Count      373

UserTime                  00:00:00.015

KernelTime                00:00:00.000

Win32 Start Address 0×06345018

LPC Server thread working on message Id 6345018

Start Address kernel32!BaseThreadStartThunk (0×77e6b5f3)

Stack Init 8b0e6000 Current 8b0e5c08 Base 8b0e6000 Limit 8b0e3000 Call 0

Priority 11 BasePriority 8 PriorityDecrement 0

Kernel stack not resident.
0: kd> !lpc message 0634501d

Searching message 634501d in threads ...

Client thread 87f0d790 waiting a reply from 634501d

    Server thread 89137780 is working on message 634501d

[…]
0: kd> !thread 89137780 1f

THREAD 89137780  Cid 1884.41f8  Teb: 7ff90000 Win32Thread: 00000000 WAIT: (Unknown) UserMode Non-Alertable

    8913796c  Semaphore Limit 0x1

Waiting for reply to LPC MessageId 064aa11b:

Current LPC port ea3fc860

Impersonation token:  e93ff870 (Level Impersonation)

DeviceMap                 e1603ce8

Owning Process            8a608020       Image:         AppB.exe

Wait Start TickCount      148002015      Ticks: 24034213 (4:08:18:54.578)

Context Switch Count      700

UserTime                  00:00:00.015

KernelTime                00:00:00.000

Win32 Start Address 0×0634501d

LPC Server thread working on message Id 634501d

Start Address kernel32!BaseThreadStartThunk (0×77e6b5f3)

Stack Init 8b749000 Current 8b748c08 Base 8b749000 Limit 8b746000 Call 0

Priority 10 BasePriority 8 PriorityDecrement 0

Kernel stack not resident.
0: kd> !lpc message 064aa11b

Searching message 64aa11b in threads ...

Client thread 89137780 waiting a reply from 64aa11b

    Server thread 87acb728 is working on message 64aa11b

[…]
0: kd> !thread 87acb728 1f

THREAD 87acb728  Cid 4120.4078  Teb: 7ff3f000 Win32Thread: 00000000 WAIT: (Unknown) UserMode Non-Alertable

    87acb914  Semaphore Limit 0x1

Waiting for reply to LPC MessageId 064aa127:

Current LPC port e7ec63f0

Not impersonating

DeviceMap                 e1003910

Owning Process            868d1d88       Image:         AppC.exe

Wait Start TickCount      147996856      Ticks: 24039372 (4:08:20:15.187)

Context Switch Count      440

UserTime                  00:00:00.812

KernelTime                00:00:00.015

Win32 Start Address 0×064aa11b

LPC Server thread working on message Id 64aa11b

Start Address kernel32!BaseThreadStartThunk (0×77e6b5f3)

Stack Init 8ba35000 Current 8ba34c08 Base 8ba35000 Limit 8ba32000 Call 0

Priority 13 BasePriority 8 PriorityDecrement 0

Kernel stack not resident.
0: kd> !lpc message 064aa127

Searching message 64aa127 in threads ...

    Server thread 899e1750 is working on message 64aa127

Client thread 87acb728 waiting a reply from 64aa127

[…]
0: kd> !thread 899e1750 1f

THREAD 899e1750  Cid 0a0c.6cfc  Teb: 7ff16000 Win32Thread: 00000000 WAIT: (Unknown) UserMode Non-Alertable

    89293390  Mutant - owning thread 89a9dc38

Not impersonating

DeviceMap                 e1003910

Owning Process            892b8a38       Image:         svchost.exe

Wait Start TickCount      148115996      Ticks: 23920232 (4:07:49:13.625)

Context Switch Count      166

UserTime                  00:00:00.000

KernelTime                00:00:00.000

Win32 Start Address 0×064aa127

LPC Server thread working on message Id 64aa127

Start Address kernel32!BaseThreadStartThunk (0×77e6b5f3)

Stack Init 8c7b1000 Current 8c7b0c60 Base 8c7b1000 Limit 8c7ae000 Call 0

Priority 13 BasePriority 8 PriorityDecrement 0

Kernel stack not resident.
We finally come to a thread waiting for a mutant and we inspect its owner:
0: kd> !thread 89a9dc38 1f

THREAD 89a9dc38  Cid 0a0c.185c  Teb: 7ff8d000 Win32Thread: 00000000 WAIT: (Unknown) UserMode Non-Alertable

    89a9de24  Semaphore Limit 0x1

Waiting for reply to LPC MessageId 064a90f1:

Current LPC port e15992a8

Not impersonating

DeviceMap                 e1003910

Owning Process            892b8a38       Image:         svchost.exe

Wait Start TickCount      148115996      Ticks: 23920232 (4:07:49:13.625)

Context Switch Count      29043

UserTime                  00:00:01.046

KernelTime                00:00:00.968

Win32 Start Address 0×064a8fb6

LPC Server thread working on message Id 64a8fb6

Start Address kernel32!BaseThreadStartThunk (0×77e6b5f3)

Stack Init 92201000 Current 92200c08 Base 92201000 Limit 921fe000 Call 0

Priority 10 BasePriority 8 PriorityDecrement 0

Kernel stack not resident.
We see it is waiting for an LPC reply from the thread waiting for the mutant we already saw:
0: kd> !lpc message 064a90f1

Searching message 64a90f1 in threads ...

Client thread 89a9dc38 waiting a reply from 64a90f1

    Server thread 88806a28 is working on message 64a90f1

[…]
0: kd> !thread 88806a28 1f

THREAD 88806a28  Cid 0a0c.10b8  Teb: 7ff82000 Win32Thread: 00000000 WAIT: (Unknown) UserMode Non-Alertable

    89293390  Mutant - owning thread 89a9dc38

Not impersonating

DeviceMap                 e1003910

Owning Process            892b8a38       Image:         svchost.exe

Wait Start TickCount      148115996      Ticks: 23920232 (4:07:49:13.625)

Context Switch Count      532

UserTime                  00:00:00.000

KernelTime                00:00:00.015

Win32 Start Address 0×064a90f1

LPC Server thread working on message Id 64a90f1

Start Address kernel32!BaseThreadStartThunk (0×77e6b5f3)

Stack Init 94ef3000 Current 94ef2c60 Base 94ef3000 Limit 94ef0000 Call 0

Priority 10 BasePriority 8 PriorityDecrement 0

Kernel stack not resident.
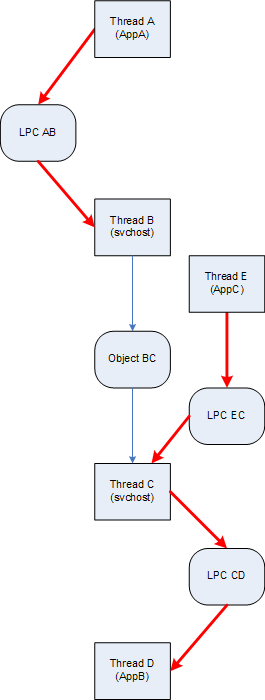
We have
… -> Thread(899e1750) -> Mutant(89293390) Thread(89a9dc38) -> LPC(064a90f1) Thread(88806a28) -> Mutant(89293390) Thread(89a9dc38)
This looks like a deadlock although we cannot examine stack traces which are not resident (stack data resides in a page file).
We also notice the system uptime which might suggest that all these abnormalities had been gradually accumulated (see Overaged System):
0: kd> version
[…]
System Uptime: 61 days 3:40:01.122
[…]
- Dmitry Vostokov @ DumpAnalysis.org -