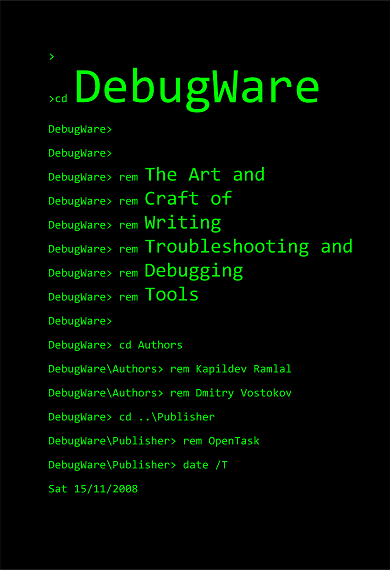
Front Cover for DebugWare Book
January 10th, 2009Finally designed a conceptual cover for DebugWare book using command-line theme:
- Dmitry Vostokov @ DumpAnalysis.org -
Finally designed a conceptual cover for DebugWare book using command-line theme:
- Dmitry Vostokov @ DumpAnalysis.org -
Part 1 focused on using a debugger to extract a computer name from memory dumps. Here is a very simple approach for user dumps using built-in command line tools:
C:\UserDumps>findstr "COMPUTERNAME=" new_0200_2008-04-28_14-11-54-937_0cb0.dmp
Most of the time the last portion of output contains something like this:
..CommonProgramW6432=C:\Program Files\Common Files..COM

PUTERNAME=HOME-PC....ComSpec=C:\W2K3\system32\cmd.exe..

..♀.FP_NO_HOST_CHECK=NO...♂.HOMEDRIVE=C:......HOMEPATH=

\Documents and Settings\User...........................

.LOGONSERVER=\\SERVER..∩...NUMBER_OF_PROCESSORS=1...δ..

;..Φ;..╨α,.~........²²²²COMPUTERNAME=HOME-PC.²²²²
If we don’t see the variable we can redirect the output into a text file and look in it or simply open a dump in any hex editor and search for a UNICODE string.
- Dmitry Vostokov @ DumpAnalysis.org -
Which paper type do you prefer? Paperback Memory Dump Analysis Anthology volumes are printed on creme paper. Hardback volumes sold on Amazon are also printed on creme paper but Lulu uses white paper for them. Full color hardback Volume 1 Collector’s Edition is printed on white paper too and sold on Lulu only. I chose creme paper for Amazon and other distribution channels because I read that this type of paper is easier to read. So if you like text printed on white paper your only option at the moment is to buy a hardcover on Lulu.
Here is a stack of all different types of volumes:
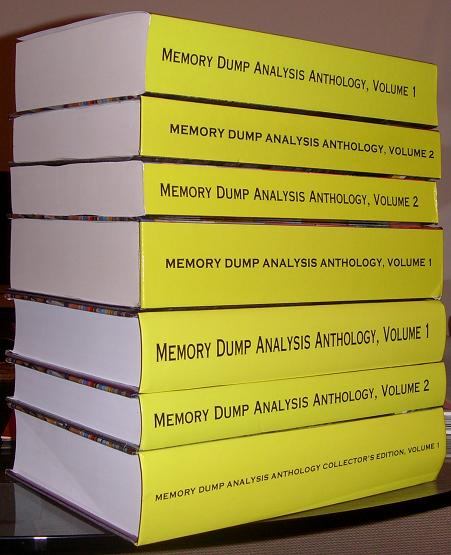
From top to bottom:
- Dmitry Vostokov @ DumpAnalysis.org -
“One must look for one” bug “only, to find many.”
Cesare Pavese, This Business of Living: Diaries 1935-1950
- Dmitry Vostokov @ DumpAnalysis.org -
Debugged! MZ/PE magazine editorial board has secured a columnist Don T. Quit to write a column “Tips, Bits and Fields”. Don is very eager to offer a (socio- | psycho- | ε) logical advice to debugging community.
Just to remind that a deadline to submit articles for the first issue is set to 15th of February.
- Dmitry Vostokov @ DumpAnalysis.org -
While working on “Computer Memory Visualization” book I noticed this recent title and immediately bought it:
Core Memory: A Visual Survey of Vintage Computers
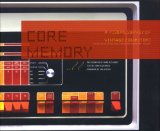
This is not only a wonderful hardcover coffee table book with stunning photographs of old computers and their memory hardware but also has numerous historical notes. It nicely complements my own DLL List Landscape: The Art from Computer Memory Space book that features virtual memory visual images.
- Dmitry Vostokov @ DumpAnalysis.org -
Originally I paid attention to “Paper is patient” in Social Sciences as Sorcery book. It merits its own bugtation:
Crash dump “is patient.”
- Dmitry Vostokov @ DumpAnalysis.org -
“Everything is in a state of” memory.
- Dmitry Vostokov @ DumpAnalysis.org -
“For it is not enough to have a good” debugger: “one must use it well.”
- Dmitry Vostokov @ DumpAnalysis.org -
Sometimes there is not enough physical memory and the system experiences the so called disk or page file thrashing trying to resolve page faults. This can be seen in some memory dumps coming from frozen environments showing signs of double traps in running threads, the first one is a normal memory access fault (blue) and the other is forced NMI bugcheck to save a memory dump (red):
1: kd> .bugcheck

Bugcheck code 00000080

Arguments 004f4454 00000000 00000000 00000000
1: kd> !thread

THREAD 88939b20  Cid 360.378  Teb: 7ffdb000  Win32Thread: a20a7ac8 RUNNING

IRP List:

    86be9e68: (0006,0100) Flags: 00000070  Mdl: 00000000

    88939e68: (0006,0100) Flags: 00000070  Mdl: 00000000

    88939128: (0006,0100) Flags: 00000070  Mdl: 00000000

Not impersonating

Owning Process 889456e0

Wait Start TickCount    2357431       Elapsed Ticks: 9

Context Switch Count    18267                   LargeStack

UserTime                  0:00:08.0218

KernelTime                0:12:28.0109

Start Address KERNEL32!BaseThreadStartThunk (0x7c57b740)

Win32 Start Address msafd!SockAsyncThread (0x74fd3113)

Stack Init bef9e000 Current bef9db60 Base bef9e000 Limit bef9b000 Call 0

Priority 11 BasePriority 11 PriorityDecrement 0 DecrementCount 0
ChildEBP RetAddr

8904aff0 80469211 hal!HalHandleNMI+0×193

8904aff0 80438621 nt!KiTrap02+0×41

bef9dc10 8043799a nt!MiTrimWorkingSet+0xa7

bef9dc38 804378ec nt!MiDoReplacement+0×2e

bef9dc50 804453cf nt!MiLocateAndReserveWsle+0×1e

bef9dc68 804444e0 nt!MiAddValidPageToWorkingSet+0×89

bef9dc8c 804443a2 nt!MiCompleteProtoPteFault+0xf6

bef9dcb8 804436e8 nt!MiResolveProtoPteFault+0×160

bef9dcfc 8044ccd0 nt!MiDispatchFault+0xfc

bef9dd4c 8046b063 nt!MmAccessFault+0xd1c

bef9dd4c 74fd31e0 nt!KiTrap0E+0xc7

016effb4 7c57b3bc msafd!SockAsyncThread+0xcd

016effec 00000000 KERNEL32!BaseThreadStart+0×52
If we check virtual memory stats we see the low number of available pages:
1: kd> !vm
*** Virtual Memory Usage ***

 Physical Memory:   524165   ( 2096660 Kb)

 Page File: \??\C:\pagefile.sys

    Current:   4190208Kb Free Space:   3298704Kb

    Minimum:   4190208Kb Maximum:      4190208Kb

 Page File: \??\E:\pagefile.sys

    Current:   4190208Kb Free Space:   3339860Kb

    Minimum:   4190208Kb Maximum:      4190208Kb

 Available Pages:     1098   (    4392 Kb)

 ResAvail Pages:    410646   ( 1642584 Kb)

 Modified Pages:    282384   ( 1129536 Kb)

 NonPagedPool Usage: 10046   (   40184 Kb)

 NonPagedPool Max:   68609   (  274436 Kb)

 PagedPool 0 Usage:  15391   (   61564 Kb)

 PagedPool 1 Usage:   1906   (    7624 Kb)

 PagedPool 2 Usage:   1925   (    7700 Kb)

 PagedPool 3 Usage:   1937   (    7748 Kb)

 PagedPool 4 Usage:   1892   (    7568 Kb)

 PagedPool Usage:    23051   (   92204 Kb)

 PagedPool Maximum:  87040   (  348160 Kb)

 Shared Commit:      16867   (   67468 Kb)

 Special Pool:           0   (       0 Kb)

 Free System PTEs:   65288   (  261152 Kb)

 Shared Process:     38655   (  154620 Kb)

 PagedPool Commit:   23051   (   92204 Kb)

 Driver Commit:       1060   (    4240 Kb)

 Committed pages:  1049592   ( 4198368 Kb)

 Commit limit:     2580155   (10320620 Kb)

[…]
In W2K dumps we can also see locking on a working set resource (I guess the name from Ws shortcut here):
 1: kd> !locks

**** DUMP OF ALL RESOURCE OBJECTS ****
Resource @ nt!MmSystemWsLock (0×804869c0)    Exclusively owned

    Contention Count = 33083

    NumberOfExclusiveWaiters = 237

[…]
and huge number of threads in Ready state for every thread priority.
Looking at the current process owning the running thread shows the large number of page faults and increased kernel CPU time compared to time spent in user mode:
1: kd> !process 889456e0

PROCESS 889456e0  SessionId: 0  Cid: 0360    Peb: 7ffdf000  ParentCid: 01a8

    DirBase: 102af000  ObjectTable: 88945c08  TableSize: 622.

    Image: Application.EXE

    VadRoot 88944468 Clone 0 Private 838. Modified 30691412. Locked 188.

    DeviceMap 89049288

    Token                             e28db550

    ElapsedTime                       10:13:30.0684

    UserTime                          0:00:12.0578

    KernelTime                        0:12:38.0625

    QuotaPoolUsage[PagedPool]         31568

    QuotaPoolUsage[NonPagedPool]      68266

    Working Set Sizes (now,min,max)  (49, 50, 345) (196KB, 200KB, 1380KB)

    PeakWorkingSetSize                1956

    VirtualSize                       131 Mb

    PeakVirtualSize                   131 Mb

    PageFaultCount                    46180598

    MemoryPriority                    BACKGROUND

    BasePriority                      10

    CommitCharge                      1247
- Dmitry Vostokov @ DumpAnalysis.org -
Publishing my old CV and salary expectations damaged my memory and yesterday night I experienced a dream where a courier arrived to my office. I opened a packet and saw an A4 plastic card with a cover displaying a VIP job offer from one company the name of which I cannot disclose here. The plastic job offer card also had 2 buttons: accept an offer and decline an offer. To the left of the buttons there was a picture of a tiger: I used to play with 2 x 2 tiger puzzle with my 2 year old son before that night… When I woke up the dream was so real that I searched around for that card ![]()
- Dmitry Vostokov @ DumpAnalysis.org -
I made a beautiful 100 x 18400 slice of pagefile.bmp generated by Dump2Picture using ImageMagick (1.5Mb JPEG image):

Wider 450 x 18400 slice (7Mb JPEG image) is available for viewing here:
Page File Image Slice (7Mb JPEG)
- Dmitry Vostokov @ DumpAnalysis.org -
I was curious about how page file looks like when represented as a bitmap picture image like I previously did with memory dumps and I expected it to look like a picture of a complete memory dump due to its purpose as a backup to physical memory. It looks similar indeed. Here is a picture of a 1.3Gb pagefile.sys from my home computer after running Vista for last 2 weeks, generated by Dump2Picture tool and resized from 18400 x 18400 32-bit bitmap by ImageMagick:

- Dmitry Vostokov @ DumpAnalysis.org -
“Look for” a bug “in everything and you will find it.”
Pierre-Jules Renard, Journal
- Dmitry Vostokov @ DumpAnalysis.org -
… taking into account one second because of slowing Earth rotation. I wish everyone a Happy New Year and successful debugging and memory analysis sessions in virtuality and reality!
Dmitry Vostokov @ 45474150 504d5544  PAGEDUMP....(...

0bc6c000 81000000 8054d030 8054f098  ........0.T...T.

0000014c 00000001 000000e2 00000000  L...............

00000000 00000000 00000000 45474100  .............AGE

45474150 45474150 45474150 45474150  PAGEPAGEPAGEPAGE

45474150 45474150 45474150 45474100  PAGEPAGEPAGE.AGE

8053eee0 00000003 0000f67d 00000001  ..S.....}.......

0000009e 00000100 00000eff 00001000  ................

0000e6e0 45474150 45474150 45474150  ....PAGEPAGEPAGE

45474150 45474150 45474150 45474150  PAGEPAGEPAGEPAGE

45474150 45474150 45474150 45474150  PAGEPAGEPAGEPAGE

45474150 45474150 45474150 45474150  PAGEPAGEPAGEPAGE

45474150 45474150 45474150 45474150  PAGEPAGEPAGEPAGE

45474150 45474150 45474150 45474150  PAGEPAGEPAGEPAGE

45474150 45474150 45474150 45474150  PAGEPAGEPAGEPAGE

45474150 45474150 45474150 45474150  PAGEPAGEPAGEPAGE

45474150 45474150 45474150 45474150  PAGEPAGEPAGEPAGE

45474150 45474150 45474150 45474150  PAGEPAGEPAGEPAGE

45474150 45474150 45474150 45474150  PAGEPAGEPAGEPAGE

45474150 45474150 45474150 45474150  PAGEPAGEPAGEPAGE

45474150 45474150 45474150 45474150  PAGEPAGEPAGEPAGE

45474150 45474150 45474150 45474150  PAGEPAGEPAGEPAGE

45474150 45474150 45474150 45474150  PAGEPAGEPAGEPAGE

45474150 45474150 45474150 45474150  PAGEPAGEPAGEPAGE

45474150 45474150 45474150 45474150  PAGEPAGEPAGEPAGE

45474150 45474150 45474150 45474150  PAGEPAGEPAGEPAGE

45474150 45474150 45474150 45474150  PAGEPAGEPAGEPAGE

45474150 45474150 45474150 45474150  PAGEPAGEPAGEPAGE

45474150 45474150 45474150 45474150  PAGEPAGEPAGEPAGE

45474150 45474150 45474150 45474150  PAGEPAGEPAGEPAGE

45474150 45474150 45474150 45474150  PAGEPAGEPAGEPAGE

45474150 45474150 45474150 45474150  PAGEPAGEPAGEPAGE

45474150 45474150 45474150 45474150  PAGEPAGEPAGEPAGE

45474150 45474150 45474150 45474150  PAGEPAGEPAGEPAGE

45474150 45474150 45474150 45474150  PAGEPAGEPAGEPAGE

45474150 45474150 45474150 45474150  PAGEPAGEPAGEPAGE

45474150 45474150 45474150 45474150  PAGEPAGEPAGEPAGE

45474150 45474150 45474150 45474150  PAGEPAGEPAGEPAGE

45474150 45474150 45474150 45474150  PAGEPAGEPAGEPAGE

45474150 45474150 45474150 45474150  PAGEPAGEPAGEPAGE

45474150 45474150 45474150 45474150  PAGEPAGEPAGEPAGE

45474150 45474150 45474150 45474150  PAGEPAGEPAGEPAGE

45474150 45474150 45474150 45474150  PAGEPAGEPAGEPAGE

45474150 45474150 45474150 45474150  PAGEPAGEPAGEPAGE

45474150 45474150 45474150 45474150  PAGEPAGEPAGEPAGE

45474150 45474150 45474150 45474150  PAGEPAGEPAGEPAGE

45474150 45474150 45474150 45474150  PAGEPAGEPAGEPAGE

45474150 45474150 45474150 45474150  PAGEPAGEPAGEPAGE

45474150 45474150 45474150 45474150  PAGEPAGEPAGEPAGE

45474150 45474150 45474150 45474150  PAGEPAGEPAGEPAGE

00000000 00000000 00000000 00000000  ................

00000000 00000000 00000000 00000000  ................

00000000 00000000 00000000 00000000  ................

00000000 00000000 00000000 00000000  ................

00000000 00000000 00000000 00000000  ................

00000000 00000000 00000000 00000000  ................

00000000 00000000 00000000 00000000  ................

00000000 00000000 00000000 00000000  ................

00000000 00000000 00000000 00000000  ................

[...]
To test various postmortem debuggers and WER to their fullest potential and especially Crash2Hang I wrote another small program that models multiple exceptions in several threads. It is free and can be downloaded with full PDB and source code from here:

The source code is simple as possible:
// MTCrash (Multithreaded crash)

// Copyright (c) 2009 Dmitry Vostokov

// GNU GENERAL PUBLIC LICENSE

// http://www.gnu.org/licenses/gpl-3.0.txt
#include <windows.h>

#include <process.h>

#include <iostream>
bool twice = false;
void thread_one(void *)

{

 Sleep(1000);

 std::cout << "Thread 1 is about to experience an AV exception..." << std::endl;

 *(int *)NULL = 0;

}
void thread_two(void *)

{

 Sleep(2000);

 if (twice)

 {

  std::cout << "Thread 2 is about to experience an AV exception..." << std::endl;

  *(int *)NULL = 0;

 }
 while (true)

 {

  std::cout << "Thread 2 is still running..." << std::endl;

  Sleep(1000);

 }

}
int main(int argc, WCHAR* argv[])

{

 if (argc > 1) twice = true;
 _beginthread(thread_two, 0, NULL);

 _beginthread(thread_one, 0, NULL);
 while(true)

 {

  std::cout << "Main Thread is still running..." << std::endl;

  Sleep(1000);

 }
 return 0;

}
It creates 2 additional threads and the first of them tries to access a NULL pointer:
This dump file has an exception of interest stored in it.

The stored exception information can be accessed via .ecxr.

(d3c.e94): Access violation - code c0000005 (first/second chance not available)

eax=00000000 ebx=005a4660 ecx=0041948c edx=00419ef0 esi=00419488 edi=00000000

eip=004013bd esp=007eff7c ebp=007effb4 iopl=0 nv up ei pl zr na pe nc

cs=0023  ss=002b  ds=002b  es=002b  fs=0053  gs=002b  efl=00010246

MTCrash!thread_one+0×6d:

004013bd c7050000000000000000 mov dword ptr ds:[0],0  ds:002b:00000000=????????
0:002> ~*kL
   0  Id: d3c.eb4 Suspend: 1 Teb: 7efdd000 Unfrozen

ChildEBP RetAddr

002dfee4 7d4d0ec5 ntdll!ZwDelayExecution+0x15

002dff4c 7d4d14ef kernel32!SleepEx+0x68

002dff5c 0040157a kernel32!Sleep+0xf

002dff70 004046ac MTCrash!main+0xaa

002dffc0 7d4e7d2a MTCrash!__tmainCRTStartup+0x15f

002dfff0 00000000 kernel32!BaseProcessStart+0x28
   1  Id: d3c.ebc Suspend: 1 Teb: 7efda000 Unfrozen

ChildEBP RetAddr

006afee4 7d4d0ec5 ntdll!ZwDelayExecution+0x15

006aff4c 7d4d14ef kernel32!SleepEx+0x68

006aff5c 004014c5 kernel32!Sleep+0xf

006aff7c 00404352 MTCrash!thread_two+0xf5

006affb4 004043eb MTCrash!_callthreadstart+0x1b

006affb8 7d4dfe21 MTCrash!_threadstart+0x73

006affec 00000000 kernel32!BaseThreadStart+0x34
#  2  Id: d3c.e94 Suspend: 1 Teb: 7efd7000 Unfrozen

ChildEBP RetAddr

007effb8 7d4dfe21 MTCrash!thread_one+0×6d

007effe4 00000000 kernel32!BaseThreadStart+0×34
   3  Id: d3c.f0c Suspend: 1 Teb: 7efaf000 Unfrozen

ChildEBP RetAddr

0083ffc8 7d665081 ntdll!DbgBreakPoint+0x1

0083fff4 00000000 ntdll!DbgUiRemoteBreakin+0x2d
The second thread and main thread continue to run:
C:\Crash2Hang>MTCrash.exe

Main Thread is still running...

Thread 1 is about to experience an AV exception...

Main Thread is still running...

Thread 2 is still running...

Main Thread is still running...

Thread 2 is still running...

Main Thread is still running...

Thread 2 is still running...

[...]
If launched with any parameter the second thread also experiences an unhandled exception (in red) while the first one is suspended by an unhandled exception filter (in blue):
This dump file has an exception of interest stored in it.

The stored exception information can be accessed via .ecxr.

(ca4.cb0): Access violation - code c0000005 (first/second chance not available)

eax=00000000 ebx=005a4668 ecx=0041948c edx=00419ef0 esi=00419488 edi=00000000

eip=004013bd esp=007eff7c ebp=007effb4 iopl=0 nv up ei pl zr na pe nc

cs=0023  ss=002b  ds=002b  es=002b  fs=0053  gs=002b  efl=00010246

MTCrash!thread_one+0×6d:

004013bd c7050000000000000000 mov dword ptr ds:[0],0  ds:002b:00000000=????????
0:002> ~*kL
   0  Id: ca4.ca0 Suspend: 1 Teb: 7efdd000 Unfrozen

ChildEBP RetAddr

002dfee4 7d4d0ec5 ntdll!ZwDelayExecution+0x15

002dff4c 7d4d14ef kernel32!SleepEx+0x68

002dff5c 0040157a kernel32!Sleep+0xf

002dff70 004046ac MTCrash!main+0xaa

002dffc0 7d4e7d2a MTCrash!__tmainCRTStartup+0x15f

002dfff0 00000000 kernel32!BaseProcessStart+0x28
   1  Id: ca4.ca8 Suspend: 1 Teb: 7efda000 Unfrozen

ChildEBP RetAddr

006af8cc 7d5357f3 ntdll!ZwRaiseHardError+0×12

006afb38 7d508f4e kernel32!UnhandledExceptionFilter+0×519

006afb40 7d4d8a25 kernel32!BaseThreadStart+0×4a (FPO: [SEH])

006afb68 7d61ec2a kernel32!_except_handler3+0×61

006afb8c 7d61ebfb ntdll!ExecuteHandler2+0×26

006afc34 7d61ea36 ntdll!ExecuteHandler+0×24

006afc34 0040144f ntdll!KiUserExceptionDispatcher+0xe (CONTEXT @ 006afc9c)

006aff7c 00404352 MTCrash!thread_two+0×7f

006affb4 004043eb MTCrash!_callthreadstart+0×1b

006affb8 7d4dfe21 MTCrash!_threadstart+0×73

006affec 00000000 kernel32!BaseThreadStart+0×34
#  2  Id: ca4.cb0 Suspend: 1 Teb: 7efd7000 Unfrozen

ChildEBP RetAddr

007effb8 7d4dfe21 MTCrash!thread_one+0×6d

007effe4 00000000 kernel32!BaseThreadStart+0×34
0:002> .cxr 006afc9c

eax=00000000 ebx=005a4448 ecx=0041948c edx=00419ef0 esi=00419488 edi=00000000

eip=0040144f esp=006aff68 ebp=7d4d14e0 iopl=0  nv up ei pl zr na pe nc

cs=0023  ss=002b  ds=002b  es=002b  fs=0053  gs=002b  efl=00010246

MTCrash!thread_two+0×7f:

0040144f c7050000000000000000 mov dword ptr ds:[0],0  ds:002b:00000000=????????
However as soon as we dismiss the first error message box or if Auto is set to 1 in AeDebug registry key MTCrash terminates. If Crash2Hang is set as a default postmortem debugger then we get two instances of it running and MTCrash hangs even if we dismiss the first message. The main thread continues to run:
C:\Crash2Hang>MTCrash.exe 1

Main Thread is still running...

Thread 1 is about to experience an AV exception...

Main Thread is still running...

Main Thread is still running...

Thread 2 is about to experience an AV exception...

Main Thread is still running...

Main Thread is still running...

Main Thread is still running...

Main Thread is still running...

[...]
- Dmitry Vostokov @ DumpAnalysis.org -
I didn’t know that such challenge and contest exists until I came across this blog:
http://blog.flexilis.com/2008/12/the-2008-malware-challenge/
I’m always interested in malware and reverse engineering because sites about these topics usually contain hard-to-find Windows internals information. May be I try next year if such opportunity arises again.
- Dmitry Vostokov @ DumpAnalysis.org -
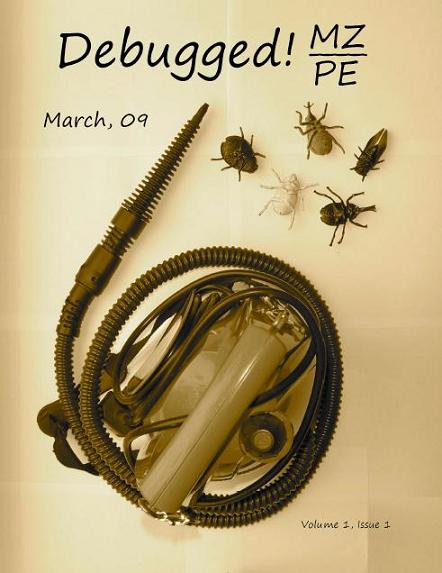
Here is the front cover image for the first issue of previously announced Debugged! MZ/PE magazine:
- Dmitry Vostokov @ DumpAnalysis.org -
“Where are you” debugging “tonight?”
Arthur Evelyn St. John Waugh, The Diaries of Evelyn Waugh, edited by Michael Davie
- Dmitry Vostokov @ DumpAnalysis.org -
Last quarter was very busy for me and to keep up with schedule I now employ pipeline book writing techniques borrowed from CPU of my laptop to work simultaneously on 10 books. I also feel more relaxed with take it easy attitude towards writing and publishing: TIEP - TIE Publishing. In summary: the following book is planned to be released in Q1, 2009 where I’m an author:
- Windows® Debugging: Practical Foundations (ISBN: 978-1906717100)
A magazine issue is planned for Q1 where I’m an editor:
- March issue of Debugged! MZ/PE: MagaZine for/from Practicing Engineers (ISBN: 978-1906717384)
- Dmitry Vostokov @ DumpAnalysis.org -