December 6th, 2010
By analogy with Well-Tested Function we introduce another pattern called Well-Tested Module. This is a module we usually skip when analyzing a stack trace because we suspect it the least. WinDbg can also be customized to skip such modules for the default analysis command as shown in the following example: Minidump Analysis (Part 2)
- Dmitry Vostokov @ DumpAnalysis.org + TraceAnalysis.org -
Posted in Crash Dump Analysis, Crash Dump Patterns, Debugging, WinDbg Tips and Tricks | No Comments »
December 3rd, 2010
We now start unifying software behavior analysis patterns with debugging architecture, design, implementation and usage. This is analogous to software construction where a problem analysis leads to various software engineering phases. The important difference here is the addition of debugging usage patterns. Let’s look at an example (we discuss suggested patterns later):
- Analysis Patterns
Shared Buffer Overwrite
- Architectural Patterns
Debug Event Subscription / Notification
- Design Patterns
Punctuated Execution
- Implementation Patterns
Breakpoint (software and hardware)
- Usage Patterns
Kernel vs. user space breakpoints
To differentiate this systematic approach from the various published ad hoc debugging patterns we call it Unified Debugging Pattern Language. ADI parts can also correspond to various DebugWare patterns where we provide a mapping later.
- Dmitry Vostokov @ DumpAnalysis.org + TraceAnalysis.org -
Posted in Crash Dump Analysis, Crash Dump Patterns, DebugWare Patterns, Debugging, Software Architecture, Software Behavior Patterns, Software Engineering, Software Trace Analysis, Trace Analysis Patterns, Unified Debugging Patterns | No Comments »
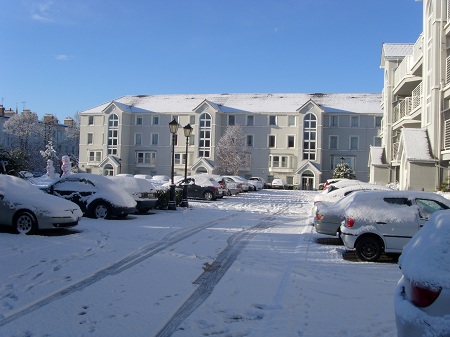
December 3rd, 2010
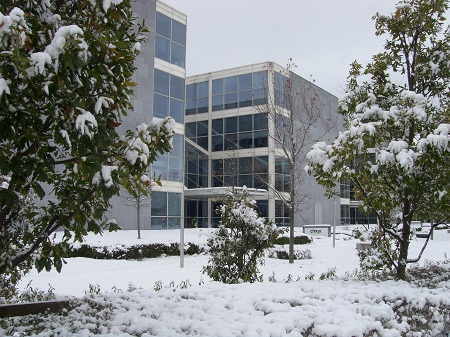
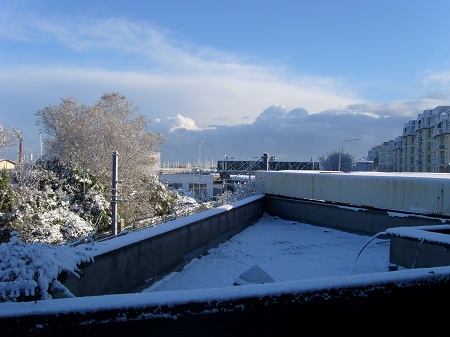
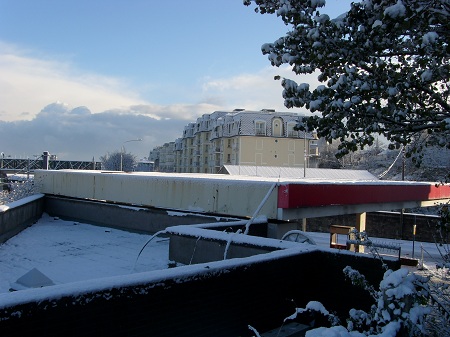
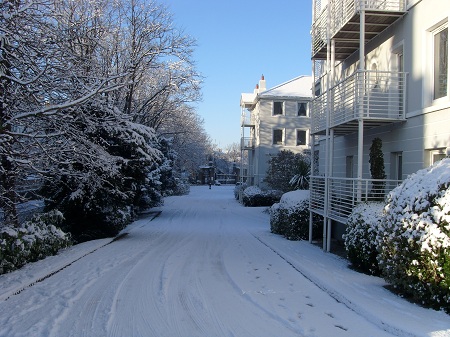
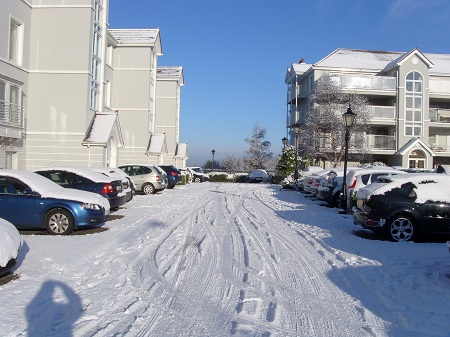
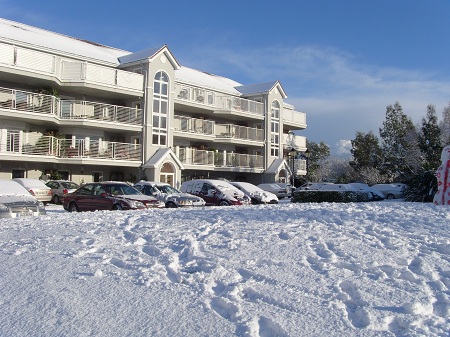
This morning it was -2 with lost of snow left from the yesterday spike. Here is Dublin Citrix Office in Eastpoint Business Park as seen from outside:
- Dmitry Vostokov @ DumpAnalysis.org + TraceAnalysis.org -
Posted in Citrix, Debugging and Nature, History | No Comments »
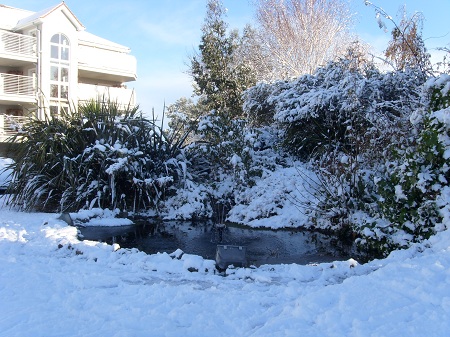
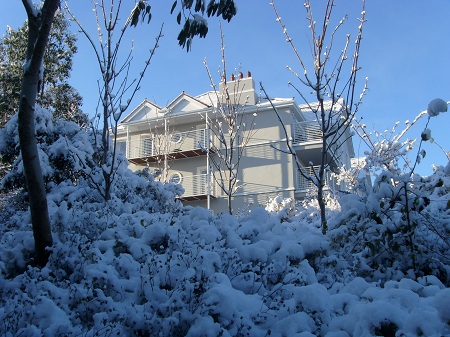
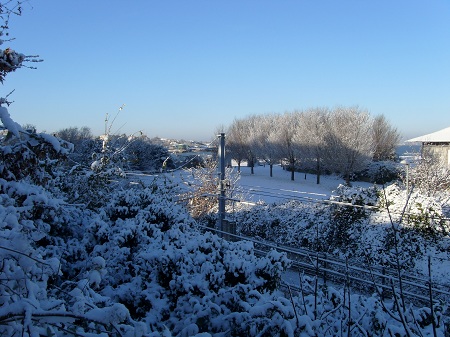
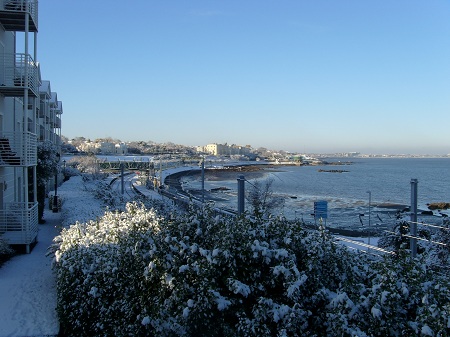
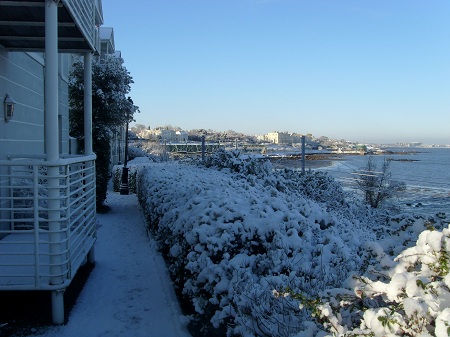
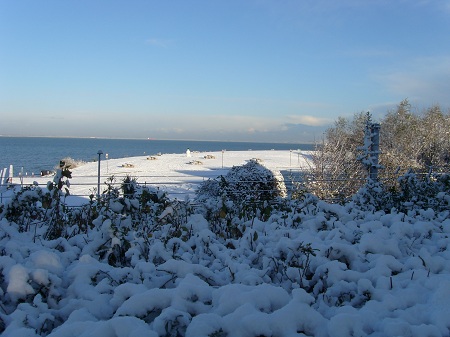
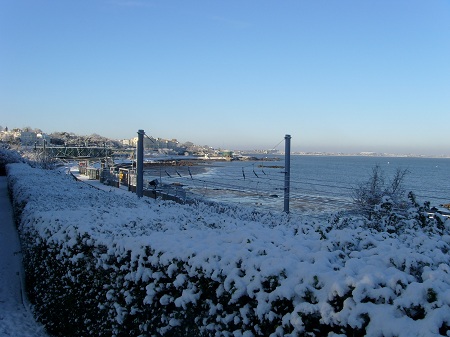
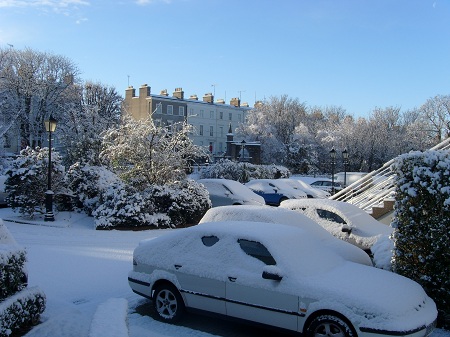
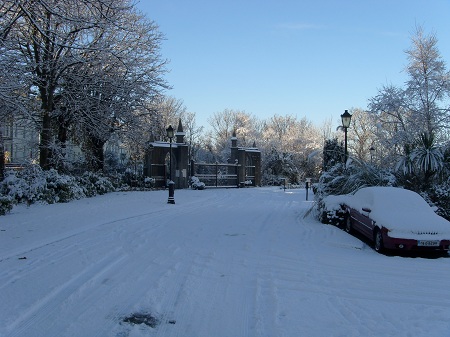
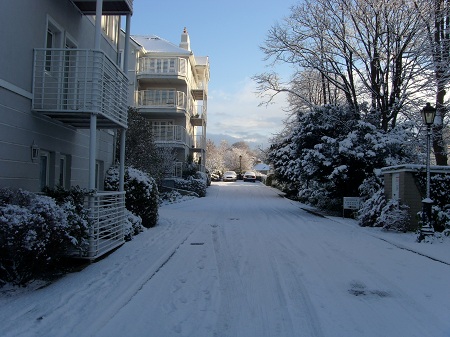
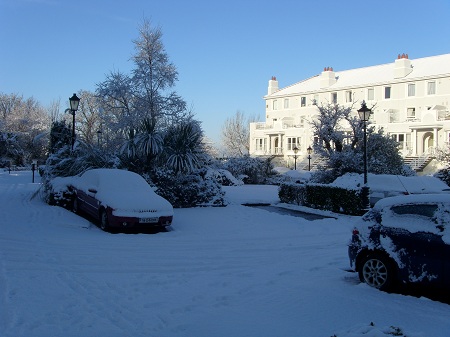
December 3rd, 2010
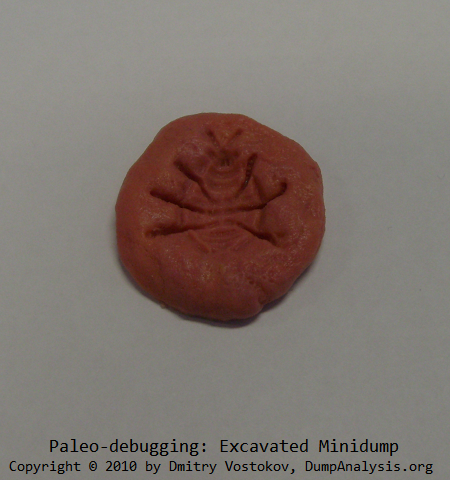
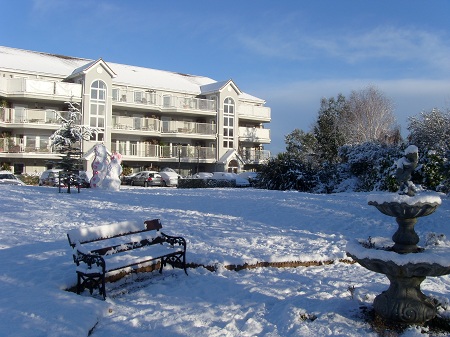
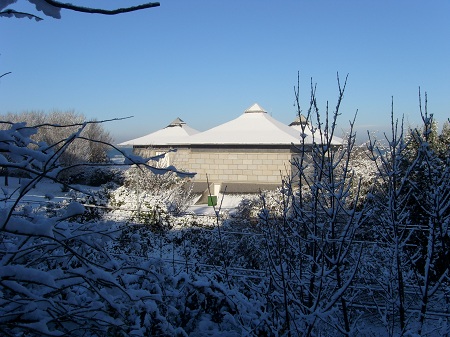
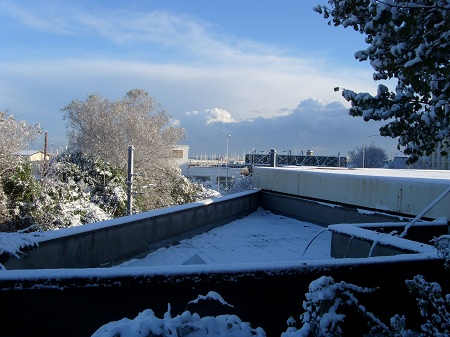
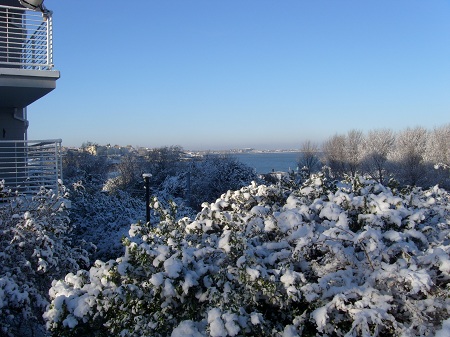
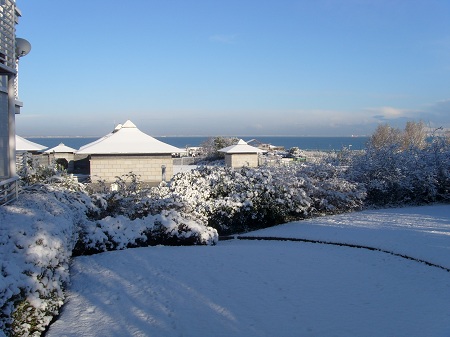
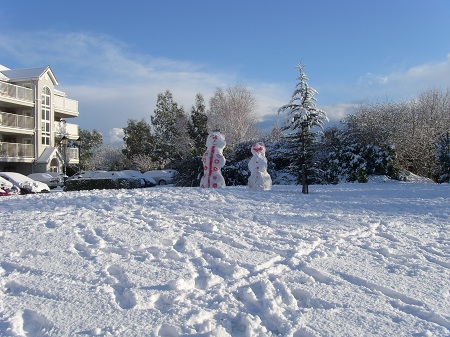
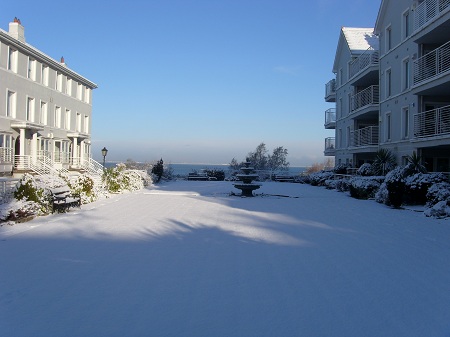
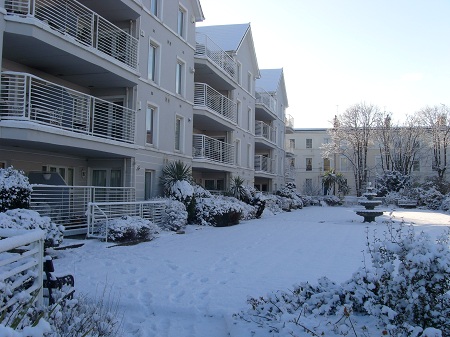
The first big one was in January this year: System Freeze in Nature. It is December now and we have the second snowfall in just one year which is the longest and coldest as well. The pictures below were taken 5 days ago when it started with temperatures down to -7 in the morning so we were able to practice only small scale architecture while building a snowman:


- Dmitry Vostokov @ DumpAnalysis.org + TraceAnalysis.org -
Posted in Debugging and Nature, History | No Comments »
December 2nd, 2010
One frequently useful analysis pattern is the presence of String Parameter on a function call stack. The trivial case is when a function parameter is a pointer to an ASCII or a Unicode string (da and du WinDbg commands). More interesting case is when we have a function that takes pointers to a structure that has string fields (dpa and dpu commands), for example:
0:018> kv 100

ChildEBP RetAddr  Args to Child

00de8c7c 7739bf53 7739610a 07750056 00000000 ntdll!KiFastSystemCallRet

00de8cb4 7738965e 00080126 07750056 00000001 user32!NtUserWaitMessage+0xc

00de8cdc 7739f762 77380000 0012b238 07750056 user32!InternalDialogBox+0xd0

00de8f9c 7739f047 00de90f8 00000000 ffffffff user32!SoftModalMessageBox+0x94b

00de90ec 7739eec9 00de90f8 00000028 07750056 user32!MessageBoxWorker+0x2ba

00de9144 773d7d0d 07750056 0015cd68 00132a60 user32!MessageBoxTimeoutW+0x7a

00de9178 773c42c8 07750056 00de923f 00de91ec user32!MessageBoxTimeoutA+0x9c

00de9198 773c42a4 07750056 00de923f 00de91ec user32!MessageBoxExA+0x1b

00de91b4 6dfcf8c2 07750056 00de923f 00de91ec user32!MessageBoxA+0×45

00de99f0 6dfcfad2 00de9285 00de9a1c 77bc6cd5 compstui!FilterException+0×174

00dead94 7739b6e3 0038010e 00000110 00000000 compstui!CPSUIPageDlgProc+0xf3

00deadc0 77395f82 6dfcf9df 0038010e 00000110 user32!InternalCallWinProc+0×28

00deae3c 77395e22 0015d384 6dfcf9df 0038010e user32!UserCallDlgProcCheckWow+0×147

00deae84 7738aaa4 00000000 00000110 00000000 user32!DefDlgProcWorker+0xa8

00deaeb4 77388c01 004673d0 00461130 00000000 user32!SendMessageWorker+0×43e

00deaf6c 77387910 6dfc0000 004673d0 00000404 user32!InternalCreateDialog+0×9cf

00deaf90 7739fb5b 6dfc0000 001621d0 07750056 user32!CreateDialogIndirectParamAorW+0×33

00deafb0 774279a5 6dfc0000 001621d0 07750056 user32!CreateDialogIndirectParamW+0×1b

00deb000 77427abc 02192c78 000ddd08 07750056 comctl32!_CreatePageDialog+0×79

00deb028 77429d12 02192c78 6dff5c30 07750056 comctl32!_CreatePage+0xb1

00deb244 7742b8b6 02192c78 00000001 00290110 comctl32!PageChange+0xcc

00deb604 7742c446 07750056 02192c78 00deb6ec comctl32!InitPropSheetDlg+0xbb8

00deb674 7739b6e3 07750056 00000110 00290110 comctl32!PropSheetDlgProc+0×4cb

00deb6a0 77395f82 7742bf7b 07750056 00000110 user32!InternalCallWinProc+0×28

00deb71c 77395e22 0008c33c 7742bf7b 07750056 user32!UserCallDlgProcCheckWow+0×147

00deb764 7738aaa4 00000000 00000110 00290110 user32!DefDlgProcWorker+0xa8

00deb794 77388c01 004652e0 00461130 00290110 user32!SendMessageWorker+0×43e

00deb84c 77387910 77420000 004652e0 00000100 user32!InternalCreateDialog+0×9cf

00deb870 7739fb5b 77420000 02184be8 00000000 user32!CreateDialogIndirectParamAorW+0×33

00deb890 774ab1c5 77420000 02184be8 00000000 user32!CreateDialogIndirectParamW+0×1b

00deb8d8 7742ca78 77420000 02184be8 00000000 comctl32!SHFusionCreateDialogIndirectParam+0×36

00deb93c 7742ccea 00000000 000000a0 00000000 comctl32!_RealPropertySheet+0×242

00deb954 7742cd05 00deb9b4 00000000 00deb99c comctl32!_PropertySheet+0×146

00deb964 6dfd1178 00deb9b4 000000a0 00deba30 comctl32!PropertySheetW+0xf

00deb99c 6dfcf49b 00deb9b4 0256b3f8 0013fbe0 compstui!PropertySheetW+0×4b

00deba14 6dfd0718 00000000 00134da4 00debae8 compstui!DoComPropSheet+0×2ef

00deba44 6dfd0799 00000000 7307c8da 00debad0 compstui!DoCommonPropertySheetUI+0xe9

00deba5c 730801c5 00000000 7307c8da 00debad0 compstui!CommonPropertySheetUIW+0×17

00debaa4 73080f5d 00000000 7307c8da 00debad0 winspool!CallCommonPropertySheetUI+0×43

00debeec 4f49cdfe 00000000 0218bd84 02277fe8 winspool!PrinterPropertiesNative+0×10c

WARNING: Stack unwind information not available. Following frames may be wrong.

00debf2c 4f4950a5 00deea08 00000002 02277fe8 PrintDriverA!DllGetClassObject+0xdb7e

00deee18 4f4904fb 00ca6ee0 00000003 00000001 PrintDriverA!DllGetClassObject+0×5e25

00deee30 18f60282 02277fe8 00ca6ee0 00000003 PrintDriverA!DllGetClassObject+0×127b

00deee58 18f5abce 001042e4 00ca6ee0 00000003 ps5ui!HComOEMPrinterEvent+0×33

00deee9c 7308218c 00ca6ee0 00000003 00000001 ps5ui!DrvPrinterEvent+0×22e

00deeee8 761543c8 00ca6ee0 00000003 00000001 winspool!SpoolerPrinterEventNative+0×57

00deef04 761560d2 00ca6ee0 00000003 00000000 localspl!SplDriverEvent+0×21

00deef28 761447f9 00cb2160 00000003 00000000 localspl!PrinterDriverEvent+0×46

00def3f0 76144b12 00000000 00000002 00d12020 localspl!SplAddPrinter+0×5f3

00def41c 74070193 00000000 00000002 00d12020 localspl!LocalAddPrinterEx+0×2e

00def86c 7407025c 00000000 00000002 00d12020 spoolss!AddPrinterExW+0×151

00def888 01007a93 00000000 00000002 00d12020 spoolss!AddPrinterW+0×17

00def8a4 01006772 00000000 00ce74b0 021b6278 spoolsv!YAddPrinter+0×75

00def8c8 77c80355 00000000 00ce74b0 021b6278 spoolsv!RpcAddPrinter+0×37

00def8f0 77ce43e1 0100673b 00defae0 00000005 rpcrt4!Invoke+0×30

00defcf8 77ce45c4 00000000 00000000 000e8584 rpcrt4!NdrStubCall2+0×299

00defd14 77c8013a 000e8584 000d63d8 000e8584 rpcrt4!NdrServerCall2+0×19

00defd48 77c805ef 01002c57 000e8584 00defdec rpcrt4!DispatchToStubInCNoAvrf+0×38

00defd9c 77c80515 00000005 00000000 0100d228 rpcrt4!RPC_INTERFACE::DispatchToStubWorker+0×11f

00defdc0 77c8139e 000e8584 00000000 0100d228 rpcrt4!RPC_INTERFACE::DispatchToStub+0xa3

00defdfc 77c814b2 000e1c48 000d85b8 02154180 rpcrt4!LRPC_SCALL::DealWithRequestMessage+0×42c

00defe20 77c88848 000d85f0 00defe38 000e1c48 rpcrt4!LRPC_ADDRESS::DealWithLRPCRequest+0×127

00deff84 77c88962 00deffac 77c888fd 000d85b8 rpcrt4!LRPC_ADDRESS::ReceiveLotsaCalls+0×430

00deff8c 77c888fd 000d85b8 00000000 00000000 rpcrt4!RecvLotsaCallsWrapper+0xd

00deffac 77c7b293 0008b038 00deffec 77e6482f rpcrt4!BaseCachedThreadRoutine+0×9d

00deffb8 77e6482f 000bdba8 00000000 00000000 rpcrt4!ThreadStartRoutine+0×1b

00deffec 00000000 77c7b278 000bdba8 00000000 kernel32!BaseThreadStart+0×34
0:018> da 00de923f

00de923f  “Function address 0×77481456 caus”

00de925f  “ed a protection fault. (exceptio”

00de927f  “n code 0xc0000005).The applicati”

00de929f  “on property sheet page(s) may no”

00de92bf  “t function properly.”
0:018> dpu 00d12020

00d12020  00000000

00d12024  021b6088 “Printer A User B Server C”

00d12028  00000000

00d1202c  021b6124 “Remote Printer Address for User C”

00d12030  021b6190 “Printer Name and Family”

00d12034  021b61c4 “Printer Client Name”

00d12038  021b6228 “Printer Location”

00d1203c  00000000

00d12040  00000000

00d12044  021b6264 “Printer Module Name”

00d12048  00000000

00d1204c  00000000

00d12050  021b628c

00d12054  00008841

00d12058  00000000

00d1205c  00000000

00d12060  00000000

00d12064  00000000

00d12068  00000000

00d1206c  00000000

00d12070  00000000

00d12074  00000000

00d12078  00000000

00d1207c  00000000

00d12080  00000000

00d12084  00000000

00d12088  00000000

00d1208c  00000000

00d12090  00000000

00d12094  00000000

00d12098  00000000

00d1209c  00000000
- Dmitry Vostokov @ DumpAnalysis.org + TraceAnalysis.org -
Posted in Crash Dump Analysis, Crash Dump Patterns, Debugging, WinDbg Tips and Tricks | No Comments »
December 1st, 2010
This specially designed logo explores the concept of Twitter message stream as a software (t)race:

Follow DumpAnalysis @ Twitter: http://twitter.com/DumpAnalysis
- Dmitry Vostokov @ DumpAnalysis.org + TraceAnalysis.org -
Posted in Announcements, DumpAnalysis and TraceAnalysis Logos, Fun with Software Traces, Social Media | No Comments »
November 30th, 2010
MAaaS includes 2 complementary DA+TA services:
1. Dump Analysis as a Service (DAaaS)
2. Trace Analysis as a Service (TAaaS)
Memory Dump Analysis Services is the first organization to provide such a service at an audit and certification levels.
- Dmitry Vostokov @ DumpAnalysis.org + TraceAnalysis.org -
Posted in Certification, Complete Memory Dump Analysis, Crash Analysis Report Environment (CARE), Crash Dump Analysis, Crash Dump Patterns, Debugging, Dublin School of Security, Escalation Engineering, Malware Analysis, Malware Patterns, Memiotics (Memory Semiotics), Memoretics, Memory Analysis Forensics and Intelligence, Memory Analysis Report System, Memory Dump Analysis Services, Minidump Analysis, Security, Software Behavior Patterns, Software Technical Support, Software Trace Analysis, Software Trace Reading, Structural Memory Patterns, Structural Trace Patterns, Tools, Trace Analysis Patterns, Windows System Administration | No Comments »
November 29th, 2010
Invalid Parameter is a general pattern of passing unexpected values to functions. Here we look at invalid heap block parameter specialization. It is different from heap corruption or double free pattern because no corruption happens in heap structures before detection and the parameter value has never been correct before its use. For example, we have this stack trace:
0:003> kL 100

ChildEBP RetAddr

01b2e6f0 77f27d0c ntdll!ZwWaitForSingleObject+0x15

01b2e774 77f27e3a ntdll!RtlReportExceptionEx+0x14b

01b2e7cc 77f4dc2e ntdll!RtlReportException+0x86

01b2e7e0 77f4dcab ntdll!RtlpTerminateFailureFilter+0x14

01b2e7ec 77ef05c4 ntdll!RtlReportCriticalFailure+0x67

01b2e800 77ef0469 ntdll!_EH4_CallFilterFunc+0x12

01b2e828 77ed8799 ntdll!_except_handler4+0x8e

01b2e84c 77ed876b ntdll!ExecuteHandler2+0x26

01b2e8fc 77e9010f ntdll!ExecuteHandler+0x24

01b2e8fc 77f4dc9b ntdll!KiUserExceptionDispatcher+0xf

01b2ecc4 77f4eba1 ntdll!RtlReportCriticalFailure+0x57

01b2ecd4 77f4ec81 ntdll!RtlpReportHeapFailure+0x21

01b2ed08 77efdda0 ntdll!RtlpLogHeapFailure+0xa1

01b2ed38 76bc14d1 ntdll!RtlFreeHeap+0×64

01b2ed4c 75694c39 kernel32!HeapFree+0×14

01b2ed98 726f167d msvcr80!free+0xcd

01b2eda4 7270613d DllA!FreeData+0xd

[…]

01b2fe38 77eb9d42 kernel32!BaseThreadInitThunk+0xe

01b2fe78 77eb9d15 ntdll!__RtlUserThreadStart+0×70

01b2fe90 00000000 ntdll!_RtlUserThreadStart+0×1b
We see that the failure was detected and logged immediately without any instrumentation information:
0:003> !gflag

Current NtGlobalFlag contents: 0x00000000
If we enable full page heap we get this default analysis output and the following stack trace:
0:003> !gflag

Current NtGlobalFlag contents: 0x02000000

    hpa - Place heap allocations at ends of pages
0:003> !analyze -v
[...]
APPLICATION_VERIFIER_HEAPS_CORRUPTED_HEAP_BLOCK_EXCEPTION_RAISED_FOR_PROBING (c)

Exception raised while verifying the heap block.

This situation happens if we really cannot determine any particular type of corruption for the block. For instance you will get this if during a heap free operation you pass an address that points to a non-accessible memory area.

This can also happen for double free situations if we do not find the block among full page heap blocks and we probe it as a light page heap block.

Arguments:

Arg1: 05eb1000, Heap handle used in the call.

Arg2: 00720071, Heap block involved in the operation.

Arg3: 00000000, Size of the heap block.

Arg4: c0000005, Reserved.
[...]
0:003> kL 100

ChildEBP RetAddr

0818dca4 75fa0962 ntdll!ZwWaitForMultipleObjects+0x15

0818dd40 76bc162d KERNELBASE!WaitForMultipleObjectsEx+0x100

0818dd88 76bc1921 kernel32!WaitForMultipleObjectsExImplementation+0xe0

0818dda4 76be9b0d kernel32!WaitForMultipleObjects+0x18

0818de10 76be9baa kernel32!WerpReportFaultInternal+0x186

0818de24 76be98d8 kernel32!WerpReportFault+0x70

0818de34 76be9855 kernel32!BasepReportFault+0x20

0818dec0 77ef06e7 kernel32!UnhandledExceptionFilter+0x1af

0818dec8 77ef05c4 ntdll!__RtlUserThreadStart+0x62

0818dedc 77ef0469 ntdll!_EH4_CallFilterFunc+0x12

0818df04 77ed8799 ntdll!_except_handler4+0x8e

0818df28 77ed876b ntdll!ExecuteHandler2+0x26

0818dfd8 77e9010f ntdll!ExecuteHandler+0x24

0818dfd8 71a6ba58 ntdll!KiUserExceptionDispatcher+0xf

0818e344 71a69ee0 verifier!VerifierStopMessage+0x1f8

0818e3a8 71a66f11 verifier!AVrfpDphReportCorruptedBlock+0x2b0

0818e3bc 71a819ec verifier!AVrfpDphFindBusyMemoryNoCheck+0x141

0818e3d0 71a8174e verifier!_EH4_CallFilterFunc+0x12

0818e3f8 77ed8799 verifier!_except_handler4+0x8e

0818e41c 77ed876b ntdll!ExecuteHandler2+0x26

0818e4cc 77e9010f ntdll!ExecuteHandler+0x24

0818e4cc 71a66e88 ntdll!KiUserExceptionDispatcher+0xf

0818e868 71a66f95 verifier!AVrfpDphFindBusyMemoryNoCheck+0xb8

0818e88c 71a67240 verifier!AVrfpDphFindBusyMemory+0x15

0818e8a8 71a69080 verifier!AVrfpDphFindBusyMemoryAndRemoveFromBusyList+0x20

0818e8c4 77f50aac verifier!AVrfDebugPageHeapFree+0x90

0818e90c 77f0a8ff ntdll!RtlDebugFreeHeap+0x2f

0818ea00 77eb2a32 ntdll!RtlpFreeHeap+0x5d

0818ea20 76bc14d1 ntdll!RtlFreeHeap+0x142

0818ea34 75694c39 kernel32!HeapFree+0x14

0818ea80 726f167d msvcr80!free+0xcd

0818ea8c 7270613d DllA!FreeData+0xd

[...]

0818fb20 77eb9d42 kernel32!BaseThreadInitThunk+0xe

0818fb60 77eb9d15 ntdll!__RtlUserThreadStart+0x70

0818fb78 00000000 ntdll!_RtlUserThreadStart+0x1b
In both examples above we see that 00720071 was passed to free function (we also verify from the code using ub command that there was no parameter optimization):
0:003> kv

ChildEBP RetAddr  Args to Child

[...]

01b2ed98 726f167d 00720071 01b2edb0 7270613d msvcr80!free+0xcd (FPO: [SEH])

[…]
We recognize that value as Unicode (as an example of a wild pointer but parameters need not be pointers in general case). We can also consider Invalid Handle pattern as another specialization of Invalid Parameter pattern.
- Dmitry Vostokov @ DumpAnalysis.org + TraceAnalysis.org -
Posted in Crash Dump Analysis, Crash Dump Patterns, Debugging | No Comments »
November 29th, 2010
Crash dump makes noise.
Suzanne Vega, Blood Makes Noise
- Dmitry Vostokov @ DumpAnalysis.org + TraceAnalysis.org -
Posted in Bugtations, Crash Dump Analysis, Fun with Crash Dumps | No Comments »
November 28th, 2010
God Bless the Debugger and his relations and keep us in our proper winstations!
18th century English verse
- Dmitry Vostokov @ DumpAnalysis.org + TraceAnalysis.org -
Posted in Bugtations, Debugging, Fun with Debugging | No Comments »
November 28th, 2010
Do we need to debug, really? (Selling the Debug Ethic1)
Whilst debugging leads to wealth
and will keep you in good health,
so its best to be contented with your bugs.
Debug, boys, debug and be contented,
As long as you’ve enough to buy a computer.
The man, you may rely, will be wealthy by and by,
If he’ll only put his finger to the debugger.
Harry Clifton (1824-1872)
1Bugtated the title of the book I’m reading now and a song from it: Selling the Work Ethic: From Puritan Pulpit to Corporate PR

- Dmitry Vostokov @ DumpAnalysis.org + TraceAnalysis.org -
Posted in Books, Bugtations, Debugging, Debugging Industry, Fun with Debugging, Social Sciences | No Comments »
November 26th, 2010
A variation of the answer to the perennial question:
The Past is a Memory Dump.
Dmitry Vostokov, Founder of Memory Dump Worldview, the philosophy of Memoidealism, and the religion of Memorianity (Memory Religion)
- Dmitry Vostokov @ DumpAnalysis.org + TraceAnalysis.org -
Posted in Bugtations, Memoidealism, Philosophy | No Comments »
November 26th, 2010
Have you ever noticed some pessimism on the faces of the prominent debuggers?
You will debug like a dog for no good reason.
Ernest Hemingway, Notes on the Next Debugging
- Dmitry Vostokov @ DumpAnalysis.org + TraceAnalysis.org -
Posted in Bugtations, Debugging, Fun with Debugging | No Comments »
November 25th, 2010
Posted in Announcements, Complete Memory Dump Analysis, Crash Analysis Report Environment (CARE), Crash Dump Analysis, Crash Dump De-analysis, Crash Dump Patterns, Debugging, Debugging Industry, Escalation Engineering, Kernel Development, Memory Analysis Forensics and Intelligence, Memory Dump Analysis Services, Minidump Analysis, Software Behavior Patterns, Software Engineering, Software Technical Support, Software Trace Analysis, Software Troubleshooting Patterns, Tools, Trace Analysis Patterns, Vista, Windows 7, Windows Server 2008, Windows System Administration, Workaround Patterns, x64 Windows | No Comments »
November 25th, 2010
Our next pattern is called System Description Snapshot. The tool or component compiles the list of system properties and collections, like hardware resources, selected file names from file systems, registry and other configuration information. Two or several snapshots can be compared either visually or automatically to highlight state differences that help in troubleshooting, debugging and problem resolution.
- Dmitry Vostokov @ DumpAnalysis.org + TraceAnalysis.org -
Posted in DebugWare Patterns, Debugging, Escalation Engineering, Software Architecture, Software Engineering, Software Technical Support, Tools | No Comments »
November 24th, 2010
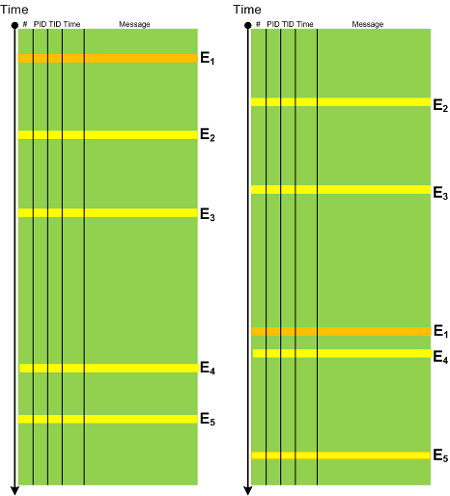
In any system there is an expected Event Sequence Order as a precondition to its normal behaviour. Any out-of-order events should raise the suspicion bar as they might result or lead to synchronization problems. It need not be a sequence of trace messages from different threads but also between processes, for example, image load events in CDF / ETW traces can indicate a misconfiguration in service startup order. The following diagram depicts a possible pattern scenario:
- Dmitry Vostokov @ DumpAnalysis.org + TraceAnalysis.org -
Posted in CDF Analysis Tips and Tricks, Debugging, Software Trace Analysis, Trace Analysis Patterns | No Comments »
November 24th, 2010
I was flying a kite with my son last month when a short Irish rain suddenly happened. After that we were happy to observe a double rainbow from Salthill (Monkstown):

- Dmitry Vostokov @ DumpAnalysis.org + TraceAnalysis.org -
Posted in Debugging and Nature, History | No Comments »