Memory Dump Analysis Best Practices (Part 1)
December 29th, 2010Easy to remember abbreviation SCP (Software Crash Patterns) consists of 3 practices:
- Scripts
- Checklists
- Patterns
- Dmitry Vostokov @ DumpAnalysis.org + TraceAnalysis.org -
Easy to remember abbreviation SCP (Software Crash Patterns) consists of 3 practices:
- Scripts
- Checklists
- Patterns
- Dmitry Vostokov @ DumpAnalysis.org + TraceAnalysis.org -
In these post series we are going to discuss the best practices for software tracing implementation including appropriate patterns and their links to software trace analysis patterns. The first one is called Period Timestamp where the start and the end time (and the date if necessary) are recorded in the trace file. This helps in Inter-Correlation and News Value analysis between several different trace types. For example, in one scenario, we had WindowHistory and MessageHistory logs. We identified a problem in the former log as happening at this time:
Handle: 00010196 Class: "ClassA" Title: "TitleA"

   Captured at: 13:36:30:533

[…]
However, when we looked at the latter trace to search for specific window messages posted or sent before that time we saw that the recording started later than the former event:
Start time: 13:36:35:830
Period timestamps are necessary to distinguish Incomplete History from Truncated Trace where in the former case the absence of expected trace message is due to some problem.
From a unified debugging patterns perspective we have this sequence fragment:
Implementation Patterns: Period Timestamp
Usage Patterns: Trace Simultaneously
- Dmitry Vostokov @ DumpAnalysis.org + TraceAnalysis.org -
Paraphrasing the title of Philip K. Dick’s novel Do Androids Dream of Electric Sheep? I’d like to tell the dream I had a few nights ago after starting my work on a computational security novel Session Zero (ISBN: 978-1908043092). I was in the hall of a building where Russian and American spies frequently intersect. Apparently, I was a technician there and everyone passing by was complaining about difficulties being a spy. I was listening and telling everyone that I wasn’t a spy, just a technician. Suddenly a thought came to my mind that if I were a real spy masquerading as a technician it would have made make a good novel plot… Then I met colleagues from one of my previous companies and I woke up.
- Dmitry Vostokov @ DumpAnalysis.org + TraceAnalysis.org -
… the functions you meet on the way up, … you’re going to meet the same functions on the way down. Not always…
- Dmitry Vostokov @ DumpAnalysis.org + TraceAnalysis.org -
As a part of my efforts to unify malware and forensic analysis with memory dump and software trace analysis from behavioral and structural patterns perspective I created this domain name. The word victimware was borrowed and extended from its previous limited use:
Software Victimology (Part 1)
Software Victimology (Part 2)
- Dmitry Vostokov @ DumpAnalysis.org + TraceAnalysis.org -
News Value is a pattern that assigns relative importance to software traces for problem solving purposes especially when related to problem description, recent incidents and timestamps of other supporting artifacts (memory dumps, other traces, etc.). For example, in one scenario, an ETW trace was provided with 3 additional log files:
# Source PID  TID  Date       Time         Message

0 Header 1260 1728 12/14/2010 06:48:56.289 ?????

[…]

215301 Unknown 640 808 12/14/2010 07:22:57.508 ?????  Unknown( 16): GUID=[…] (No Format Information found).
// LogA

05/11/10 18:28:15.1562 : Service() - entry

[...]

14/12/10 10:31:58.0381 : Notification: sleep

* Start of new log *

14/12/10 10:34:38.4687 : Service() - entry

[…]

14/12/10 11:53:35.2729 : Service.CleanUp complete

* Start of new log *

14/12/10 11:56:11.7031 : Service() - entry

[…]

14/12/10 15:25:23.3004 : Notification: sleep
// LogB

[   1] 12/14 10:34:29:890   Entry: ctor

[…]

[   2] 12/14 11:53:30:866   Exit: COMServer.Server.DeleteObject
// LogC

[   1] 12/14 11:56:03:359   Entry: ctor

[…]

[  20] 12/14 15:30:20:110   Exit: Kernel32.Buffer.Release
From the description of the problem we expected LogB and LogC to be logs from two subsequent process executions where the first launch fails (LogB) and the second launch succeeds (LogC). Looking at their start and end times we see that they make sense from the problem description perspective but we have to dismiss ETW trace and most of LogA as recorded earlier and having no value for Inter-Correlation analysis of the more recent logs. We also see that portions of LogA overlap with LogB and LogC and therefore having analysis value for us.
- Dmitry Vostokov @ DumpAnalysis.org + TraceAnalysis.org -
Borrowing routine activity theory (RAT) from criminology I would like to introduce the similar approach to abnormal software behavior with patterning activities that adds additional unmotivated offenders to combine malware (software rats) with unintentional ordinary common bugware:
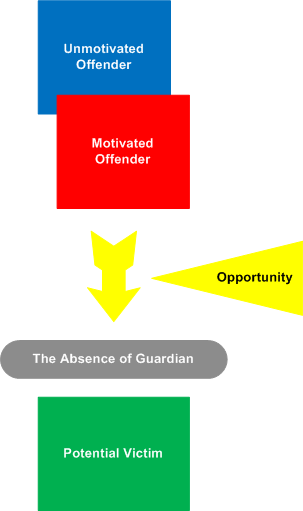
The application of RAT to software can be metaphorically named as Function Activity Theory (FAT).
- Dmitry Vostokov @ DumpAnalysis.org + TraceAnalysis.org -
The following pattern is useful for inconsistent dumps or incomplete supporting information: Environment Hint. It is mostly environment variable information for troubleshooting suggestions such as product elimination for testing purposes and / or necessary upgrade, for example:
0: kd> !peb

PEB at 7ffd7000

    InheritedAddressSpace:    No

    ReadImageFileExecOptions: Yes

    BeingDebugged:            No

    ImageBaseAddress:         01000000

    Ldr                       7c8897e0

    Ldr.Initialized:          Yes

    Ldr.InInitializationOrderModuleList: 00081f18 . 000f9e88

    Ldr.InLoadOrderModuleList:           00081eb0 . 000f9e78

    Ldr.InMemoryOrderModuleList:         00081eb8 . 000f9e80

            Base TimeStamp                     Module

         1000000 45d6a03c Feb 17 06:27:08 2007 C:\WINNT\system32\svchost.exe

        7c800000 49900d60 Feb 09 11:02:56 2009 C:\WINNT\system32\ntdll.dll

[...]

    SubSystemData:     00000000

    ProcessHeap:       00080000

    ProcessParameters: 00020000

    WindowTitle:  'C:\WINNT\system32\svchost.exe'

    ImageFile:    'C:\WINNT\system32\svchost.exe'

    CommandLine:  'C:\WINNT\system32\svchost.exe -k rpcss'

    DllPath:      [...]

    Environment:  00010000

        ALLUSERSPROFILE=C:\Documents and Settings\All Users

[...]

        PROTECTIONDIR=C:\Documents and Settings\All Users\Application Data\3rdPartyAntivirus\Protection

[…]

       Path= […]
- Dmitry Vostokov @ DumpAnalysis.org + TraceAnalysis.org -
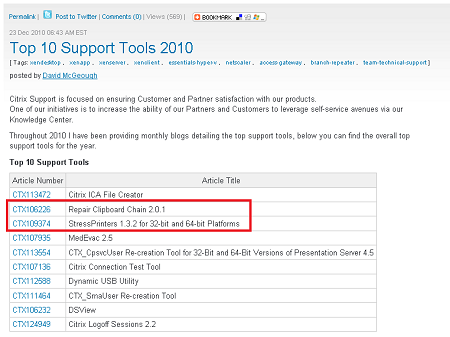
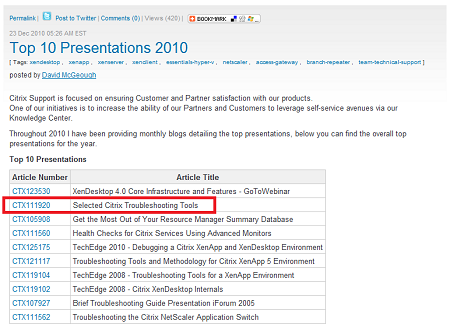
I’m very excited to announce that 2 my tools Repair Clipboard Chain 2.0.1, StressPrinters 1.3.2 for 32-bit and 64-bit Platforms and Selected Citrix Troubleshooting Tools presentation are in top 3 list:
- Dmitry Vostokov @ DumpAnalysis.org + TraceAnalysis.org -
Golden bug - A software defect if fixed entails a promotion and pay rise prospects.
Examples:
- You are a Principal now!!!
- Oh, thanks to that persistent golden bug nobody could fix until I was assigned…
- Dmitry Vostokov @ DumpAnalysis.org + TraceAnalysis.org -
Dual Stack Trace is the kernel mode and space counterpart to a user mode and space stack trace and vice versa, for example:
  25  Id: e8c.f20 Suspend: 1 Teb: 7ff9c000 Unfrozen

ChildEBP RetAddr

086acac4 7c90df5a ntdll!KiFastSystemCallRet

086acac8 7c8025db ntdll!ZwWaitForSingleObject+0xc

086acb2c 7c802542 kernel32!WaitForSingleObjectEx+0xa8

086acb40 00fbba3a kernel32!WaitForSingleObject+0×12

WARNING: Stack unwind information not available. Following frames may be wrong.

086ad3c8 00fbc139 ModuleA!DllCanUnloadNow+0×638b4a

086adc38 00faba75 ModuleA!DllCanUnloadNow+0×639249

086ae4c8 00fa0da8 ModuleA!DllCanUnloadNow+0×629b25

086aed60 00a45331 ModuleA!DllCanUnloadNow+0×61ee48

086af6c4 00a44b10 ModuleA!DllCanUnloadNow+0xc6de1

086affb4 7c80b729 ModuleA!DllCanUnloadNow+0xc65c0

086affec 00000000 kernel32!BaseThreadStart+0×37
0: kd> !thread 88ec9020 1f

THREAD 88ec9020  Cid 17a0.2034  Teb: 7ffad000 Win32Thread: bc28c6e8 WAIT: (Unknown) UserMode Non-Alertable

    89095f48  Semaphore Limit 0x10000

IRP List:

    89a5a370: (0006,0094) Flags: 00000900  Mdl: 00000000

Not impersonating

DeviceMap                 d6c30c48

Owning Process            88fffd88       Image:         iexplore.exe

Attached Process          N/A            Image:         N/A

Wait Start TickCount      5632994        Ticks: 2980 (0:00:00:46.562)

Context Switch Count      2269                 LargeStack

UserTime                  00:00:00.000

KernelTime                00:00:00.000

Win32 Start Address 0x00a262d0

Start Address kernel32!BaseThreadStartThunk (0x77e617ec)

Stack Init b204c000 Current b204bc60 Base b204c000 Limit b2048000 Call 0

Priority 8 BasePriority 8 PriorityDecrement 0

ChildEBP RetAddr

b204bc78 80833ec5 nt!KiSwapContext+0×26

b204bca4 80829c14 nt!KiSwapThread+0×2e5

b204bcec 8093b174 nt!KeWaitForSingleObject+0×346

b204bd50 8088b41c nt!NtWaitForSingleObject+0×9a

b204bd50 7c82860c nt!KiFastCallEntry+0xfc (TrapFrame @ b204bd64)

058fcabc 7c827d29 ntdll!KiFastSystemCallRet

058fcac0 77e61d1e ntdll!ZwWaitForSingleObject+0xc

058fcb30 77e61c8d kernel32!WaitForSingleObjectEx+0xac

058fcb44 00f98b4a kernel32!WaitForSingleObject+0×12

WARNING: Stack unwind information not available. Following frames may be wrong.

058fd3cc 00f99249 ModuleA+0×638b4a

058fdc3c 00f89b25 ModuleA+0×639249

058fe4cc 00f7ee48 ModuleA+0×629b25

058fed64 00a26de1 ModuleA+0×61ee48

058ff6c8 00a265c0 ModuleA+0xc6de1

058fffb8 77e6482f ModuleA+0xc65c0

058fffec 00000000 kernel32!BaseThreadStart+0×34
This pattern is helpful when we have both process user space memory dumps and kernel and complete memory dumps and want to match stack traces of interest between them. See also patterns Stack Trace and Stack Trace Collection.
- Dmitry Vostokov @ DumpAnalysis.org + TraceAnalysis.org -
In addition to Blocked Thread and endpoint threads of Wait Chain patterns we would like to add Blocking Module pattern to account for modules calling waiting or delaying functions, for example:
0:017> kL

ChildEBP RetAddr

02c34100 7c90df5a ntdll!KiFastSystemCallRet

02c34104 7c8025db ntdll!ZwWaitForSingleObject+0xc

02c34168 7c802542 kernel32!WaitForSingleObjectEx+0xa8

02c3417c 009f0ed9 kernel32!WaitForSingleObject+0×12

02c34a08 00bc2c9a ModuleA!DllCanUnloadNow+0×6db39

02c3526c 00bc2fa4 ModuleA!DllCanUnloadNow+0×23f8fa

02c35ae0 00f6413c ModuleA!DllCanUnloadNow+0×23fc04

02c363e8 00c761ab ModuleA!DllCanUnloadNow+0×5e0d9c

02c36c74 00c74daa ModuleA!DllCanUnloadNow+0×2f2e0b

02c374e4 3d1a9eb4 ModuleA!DllCanUnloadNow+0×2f1a0a

02c3753c 3d0ed032 mshtml!CView::SetObjectRectsHelper+0×98

02c37578 3cf7e43b mshtml!CView::EndDeferSetObjectRects+0×75

02c375bc 3cf2542d mshtml!CView::EnsureView+0×39f

02c375d8 3cf4072c mshtml!CElement::EnsureRecalcNotify+0×17c

02c37614 3cf406ce mshtml!CElement::get_clientHeight_Logical+0×54

02c37628 3d0822a1 mshtml!CElement::get_clientHeight+0×27

02c37648 3cf8ad53 mshtml!G_LONG+0×7b

02c376bc 3cf96e21 mshtml!CBase::ContextInvokeEx+0×5d1

02c3770c 3cfa2baf mshtml!CElement::ContextInvokeEx+0×9d

02c37738 3cf8a751 mshtml!CElement::VersionedInvokeEx+0×2d

[…]
This pattern will help to make pattern interaction cases studies more fine grained.
- Dmitry Vostokov @ DumpAnalysis.org + TraceAnalysis.org -
Today we introduce an icon for Wait Chain (window messaging) pattern:
B/W
![]()
Color
![]()
- Dmitry Vostokov @ DumpAnalysis.org + TraceAnalysis.org -
As the new decade is approaching (2011-2020) we would like to make a few previews and predictions:
- Increased complexity of software will bring more methods from biological, social sciences and humanities in addition to existing methods of automated debugging and computer science techniques
- Focus on first fault software problem solving (when aspect)
- Focus on pattern-driven software problem solving (how aspect)
- Fusion of debugging and malware analysis into a unified structural and behavioral pattern framework
- Visual debugging, memory and software trace visualization techniques
- Software maintenance certification
- Focus on domain-driven troubleshooting and debugging tools as a service (debugware TaaS)
- Focus on security issues related to memory dumps and software traces
- New scripting languages and programming language extensions for debugging
- The maturation of the science of memory snapshots and software traces (memoretics)
Imagining is not not limited to the above and more to come and explain in the forthcoming parts.
- Dmitry Vostokov @ DumpAnalysis.org + TraceAnalysis.org -
Today we introduce an icon for Self-Dump pattern:
B/W
![]()
Color
![]()
- Dmitry Vostokov @ DumpAnalysis.org + TraceAnalysis.org -
This is another variant of the general Wait Chain pattern where blocked threads are waiting for synchronous window message calls (sent messages). For example, here three threads from different processes are blocked in such a chain where hWnd parameters for SendMessage calls and associated window procedures are marked with corresponding colors:
0:000> ~*kbL
.  0  Id: 116c.1174 Suspend: 1 Teb: 7efdd000 Unfrozen

ChildEBP RetAddr  Args to Child

0034f83c 76261c01 000a0e54 00000111 00000068 USER32!NtUserMessageCall+0x15

0034f87c 7625cd81 011114d0 00000000 00d41190 USER32!SendMessageWorker+0x5e9

0034f8a0 00fa1256 000a0e54 00000111 00000068 USER32!SendMessageW+0×7f

0034f90c 76256238 00040eb0 00000111 00000068 WCM_A!WndProc+0xc6

0034f938 762568ea 00fa1190 00040eb0 00000111 USER32!InternalCallWinProc+0×23

0034f9b0 76257d31 00000000 00fa1190 00040eb0 USER32!UserCallWinProcCheckWow+0×109

0034fa10 76257dfa 00fa1190 00000000 76257d79 USER32!DispatchMessageWorker+0×3bc

0034fa20 00fa10d3 0034fa3c 0034fae8 00000000 USER32!DispatchMessageW+0xf

0034fa54 00fa14b6 00fa0000 00000000 00571bee WCM_A!wWinMain+0xd3

0034fae8 76493677 7efde000 0034fb34 77399d72 WCM_A!__tmainCRTStartup+0×150

0034faf4 77399d72 7efde000 72afcb2e 00000000 kernel32!BaseThreadInitThunk+0xe

0034fb34 77399d45 00fa1625 7efde000 ffffffff ntdll!__RtlUserThreadStart+0×70

0034fb4c 00000000 00fa1625 7efde000 00000000 ntdll!_RtlUserThreadStart+0×1b
0:000> ~*kbL
.  0  Id: 10dc.e14 Suspend: 1 Teb: 7efdd000 Unfrozen

ChildEBP RetAddr  Args to Child

0017f7c4 76261c01 000c0ea4 00000111 00000068 USER32!NtUserMessageCall+0x15

0017f804 7625cd81 00ec3ec0 00000000 012e1190 USER32!SendMessageWorker+0x5e9

0017f828 00d41256 000c0ea4 00000111 00000068 USER32!SendMessageW+0×7f

0017f890 76256238 000a0e54 00000111 00000068 WCM_B!WndProc+0xc6

0017f8bc 762568ea 00d41190 000a0e54 00000111 USER32!InternalCallWinProc+0×23

0017f934 76257177 00000000 00d41190 000a0e54 USER32!UserCallWinProcCheckWow+0×109

0017f990 762572f1 00eb14d0 00000000 00000111 USER32!DispatchClientMessage+0xe0

0017f9cc 773700e6 0017f9e4 00000000 0017fae4 USER32!__fnDWORD+0×2b

0017f9e0 00eb14d0 00000000 00000111 00000068 ntdll!KiUserCallbackDispatcher+0×2e

WARNING: Frame IP not in any known module. Following frames may be wrong.

0017fa20 00d410e0 0017fa48 00000000 00000000 0xeb14d0

0017fa60 00d414b6 00d40000 00000000 00601bee WCM_B!wWinMain+0xe0

0017faf4 76493677 7efde000 0017fb40 77399d72 WCM_B!__tmainCRTStartup+0×150

0017fb00 77399d72 7efde000 728cf6de 00000000 kernel32!BaseThreadInitThunk+0xe

0017fb40 77399d45 00d41625 7efde000 ffffffff ntdll!__RtlUserThreadStart+0×70

0017fb58 00000000 00d41625 7efde000 00000000 ntdll!_RtlUserThreadStart+0×1b
0:000> ~*kbL
.  0  Id: e68.fbc Suspend: 1 Teb: 7efdd000 Unfrozen

ChildEBP RetAddr  Args to Child

0017f4c8 76272674 000c0ea4 00000000 00000000 USER32!NtUserWaitMessage+0x15

0017f504 7627288a 00070ee6 000c0ea4 00000000 USER32!DialogBox2+0x222

0017f530 762727b8 012e0000 012efc54 000c0ea4 USER32!InternalDialogBox+0xe5

0017f550 76272aa1 012e0000 012efc54 000c0ea4 USER32!DialogBoxIndirectParamAorW+0x37

0017f574 012e124d 012e0000 00000067 000c0ea4 USER32!DialogBoxParamW+0x3f

0017f5e4 76256238 000c0ea4 00000111 00000068 WCM_C!WndProc+0xbd

0017f610 762568ea 012e1190 000c0ea4 00000111 USER32!InternalCallWinProc+0×23

0017f688 76257177 00000000 012e1190 000c0ea4 USER32!UserCallWinProcCheckWow+0×109

0017f6e4 762572f1 01463ec0 00000000 00000111 USER32!DispatchClientMessage+0xe0

0017f720 773700e6 0017f738 00000000 0017f838 USER32!__fnDWORD+0×2b

0017f734 01463ec0 00000000 00000111 00000068 ntdll!KiUserCallbackDispatcher+0×2e

WARNING: Frame IP not in any known module. Following frames may be wrong.

0017f774 012e10e0 0017f79c 00000000 00000000 0×1463ec0

0017f7b4 012e1496 012e0000 00000000 00471bee WCM_C!wWinMain+0xe0

0017f848 76493677 7efde000 0017f894 77399d72 WCM_C!__tmainCRTStartup+0×150

0017f854 77399d72 7efde000 728ca9cf 00000000 kernel32!BaseThreadInitThunk+0xe

0017f894 77399d45 012e1605 7efde000 ffffffff ntdll!__RtlUserThreadStart+0×70

0017f8ac 00000000 012e1605 7efde000 00000000 ntdll!_RtlUserThreadStart+0×1b
Detailed modeling example (WCM application) is to follow soon.
Send message calls can also be directed to the same thread:
0: kd> kv 100

ChildEBP RetAddr  Args to Child

aa839180 80833ed1 8c446b60 8c446c08 00000002 nt!KiSwapContext+0x26

aa8391ac 80829c14 8c446d4c 8c446d20 8c446b60 nt!KiSwapThread+0x2e5

aa8391f4 80921102 8c446d4c 00000011 8c4a8c01 nt!KeWaitForSingleObject+0x346

aa8392b0 8088b41c 000006a8 00172e58 00172e58 nt!NtRequestWaitReplyPort+0x776

aa8392b0 7c82860c 000006a8 00172e58 00172e58 nt!KiFastCallEntry+0xfc

0012f194 7c827899 77c80a6e 000006a8 00172e58 ntdll!KiFastSystemCallRet

0012f198 77c80a6e 000006a8 00172e58 00172e58 ntdll!ZwRequestWaitReplyPort+0xc

0012f1e4 77c7fcf0 0012f220 0012f204 77c80673 RPCRT4!LRPC_CCALL::SendReceive+0x230

0012f1f0 77c80673 0012f220 771f2918 0012f60c RPCRT4!I_RpcSendReceive+0x24

0012f204 77ce315a 0012f24c 00172ea8 77e63e5f RPCRT4!NdrSendReceive+0x2b

0012f5ec 771f4fbd 771f2918 771f1858 0012f60c RPCRT4!NdrClientCall2+0x22e

[...]

0012f698 7739b6e3 0004001a 00000016 00000001 ApplicationA!WndProc+0xcc

0012f6c4 7739b874 00407440 0004001a 00000016 USER32!InternalCallWinProc+0×28

0012f73c 7739c8b8 00000000 00407440 0004001a USER32!UserCallWinProcCheckWow+0×151

0012f798 7739c9c6 00607890 00000016 00000001 USER32!DispatchClientMessage+0xd9

0012f7c0 7c828556 0012f7d8 00000018 0012f894 USER32!__fnDWORD+0×24

0012f7c0 80831378 0012f7d8 00000018 0012f894 ntdll!KiUserCallbackDispatcher+0×2e

aa83957c 8091fbbb aa839634 aa839638 aa839608 nt!KiCallUserMode+0×4

aa8395d4 bf8a2492 00000002 aa839618 00000018 nt!KeUserModeCallback+0×8f

aa839658 bf8a229d be487890 00000016 00000001 win32k!SfnDWORD+0xb4

aa8396a0 bf8a1249 02487890 00000016 00000001 win32k!xxxSendMessageToClient+0×176

aa8396ec bf8a115e be487890 00000016 00000001 win32k!xxxSendMessageTimeout+0×1a6

aa839710 bf926e0d be487890 00000016 00000001 win32k!xxxSendMessage+0×1b

aa83974c bf926eb5 bc18cbc8 00000016 00000001 win32k!xxxClientShutdown2+0×87

aa839768 bf8ad9fa be487890 80000009 0000029e win32k!xxxClientShutdown+0×47

aa8397c4 bf8845d4 be487890 0000003b 80000009 win32k!xxxRealDefWindowProc+0×364

aa8397dc bf884604 be487890 0000003b 80000009 win32k!xxxWrapRealDefWindowProc+0×16

aa8397f8 bf8c1259 be487890 0000003b 80000009 win32k!NtUserfnNCDESTROY+0×27

aa839830 8088b41c 0004001a 0000003b 80000009 win32k!NtUserMessageCall+0xc0

aa839830 7c82860c 0004001a 0000003b 80000009 nt!KiFastCallEntry+0xfc (TrapFrame @ aa839854)

0012f7c0 7c828556 0012f7d8 00000018 0012f894 ntdll!KiFastSystemCallRet

0012f7c0 80831378 0012f7d8 00000018 0012f894 ntdll!KiUserCallbackDispatcher+0×2e

aa839b08 8091fbbb aa839bc0 aa839bc4 aa839b94 nt!KiCallUserMode+0×4

aa839b60 bf8a2492 00000002 aa839ba4 00000018 nt!KeUserModeCallback+0×8f

aa839be4 bf8a229d be487890 0000003b 80000009 win32k!SfnDWORD+0xb4

aa839c2c bf8c3f77 02487890 0000003b 80000009 win32k!xxxSendMessageToClient+0×176

aa839c9c bf89b88e bc18e838 aa839d64 0012fa38 win32k!xxxReceiveMessage+0×2b5

aa839cec bf89d201 aa839d18 0004001a 00000000 win32k!xxxRealInternalGetMessage+0×2d7

aa839d4c 8088b41c 0012fa5c 0004001a 00000000 win32k!NtUserGetMessage+0×3f

aa839d4c 7c82860c 0012fa5c 0004001a 00000000 nt!KiFastCallEntry+0xfc (TrapFrame @ aa839d64)

0012f9f0 7c828556 0012fa08 00000018 0012ffb0 ntdll!KiFastSystemCallRet

0012fa1c 7739c811 7739c844 0012fa5c 0004001a ntdll!KiUserCallbackDispatcher+0×2e

0012fa3c 0040634e 0012fa5c 0004001a 00000000 USER32!NtUserGetMessage+0xc

0012ff18 00408d9d 00000032 00000000 00142546 ApplicationA!WinMain+0×80f

0012ffc0 77e6f22b 00000000 00000000 7ffdf000 ApplicationA!WinMainCRTStartup+0×185

0012fff0 00000000 00408c18 00000000 78746341 kernel32!BaseProcessStart+0×23
Blocked sent message calls can also be manifested in kernel space and mixed with patterns like Message Box and Main Thread, for example:
1: kd> k250

ChildEBP RetAddr

8d5d2808 82a7eb15 nt!KiSwapContext+0x26

8d5d2840 82a7d403 nt!KiSwapThread+0x266

8d5d2868 82a772cf nt!KiCommitThreadWait+0x1df

8d5d28e0 82550d75 nt!KeWaitForSingleObject+0x393

8d5d293c 82550e10 win32k!xxxRealSleepThread+0x1d7

8d5d2958 824ff4b0 win32k!xxxSleepThread+0x2d

8d5d29cc 825547e8 win32k!xxxInterSendMsgEx+0xb1c

8d5d2a1c 825546a4 win32k!xxxSendMessageTimeout+0x13b

8d5d2a44 82533843 win32k!xxxSendMessage+0×28

8d5d2b08 824fd865 win32k!xxxCalcValidRects+0xf7

8d5d2b64 82502c98 win32k!xxxEndDeferWindowPosEx+0×100

8d5d2b84 825170c9 win32k!xxxSetWindowPos+0xf6

8d5d2c08 82517701 win32k!xxxActivateThisWindow+0×2b1

8d5d2c38 82517537 win32k!xxxActivateWindow+0×144

8d5d2c4c 824fd9dd win32k!xxxSwpActivate+0×44

8d5d2ca4 82502c98 win32k!xxxEndDeferWindowPosEx+0×278

8d5d2cc4 824fff82 win32k!xxxSetWindowPos+0xf6

8d5d2d10 82a5342a win32k!NtUserSetWindowPos+0×140

8d5d2d10 76ee64f4 nt!KiFastCallEntry+0×12a (TrapFrame @ 8d5d2d34)

01e2cea0 7621358d ntdll!KiFastSystemCallRet

01e2cea4 6a8fa0eb USER32!NtUserSetWindowPos+0xc

01e2cf14 6a894b13 IEFRAME!SHToggleDialogExpando+0×15a

01e2cf28 6a894d5d IEFRAME!EleDlg::ToggleExpando+0×20

01e2d74c 6a895254 IEFRAME!EleDlg::OnInitDlg+0×229

01e2d7b8 762186ef IEFRAME!EleDlg::DlgProcEx+0×189

01e2d7e4 76209eb2 USER32!InternalCallWinProc+0×23

01e2d860 7620b98b USER32!UserCallDlgProcCheckWow+0xd6

01e2d8a8 7620bb7b USER32!DefDlgProcWorker+0xa8

01e2d8c4 762186ef USER32!DefDlgProcW+0×22

01e2d8f0 76218876 USER32!InternalCallWinProc+0×23

01e2d968 76217631 USER32!UserCallWinProcCheckWow+0×14b

01e2d9a8 76209b1d USER32!SendMessageWorker+0×4d0

01e2da64 76235500 USER32!InternalCreateDialog+0xb0d

01e2da94 76235553 USER32!InternalDialogBox+0xa7

01e2dab4 76235689 USER32!DialogBoxIndirectParamAorW+0×37

01e2dad8 6a5d4952 USER32!DialogBoxParamW+0×3f

01e2db00 6a5d5024 IEFRAME!Detour_DialogBoxParamW+0×47

01e2db24 6a8956df IEFRAME!SHFusionDialogBoxParam+0×32

01e2db58 6a8957bb IEFRAME!EleDlg::ShowDialog+0×398

01e2e638 6a8959d3 IEFRAME!ShowDialogBox+0xb6

01e2eb9c 6a9013ed IEFRAME!ShowElevationPrompt+0×1dd

01e2f010 7669fc8f IEFRAME!CIEUserBrokerObject::BrokerCoCreateInstance+0×202

01e2f040 76704c53 RPCRT4!Invoke+0×2a

01e2f448 76d9d936 RPCRT4!NdrStubCall2+0×2d6

01e2f490 76d9d9c6 ole32!CStdStubBuffer_Invoke+0xb6

01e2f4d8 76d9df1f ole32!SyncStubInvoke+0×3c

01e2f524 76cb213c ole32!StubInvoke+0xb9

01e2f600 76cb2031 ole32!CCtxComChnl::ContextInvoke+0xfa

01e2f61c 76d9a754 ole32!MTAInvoke+0×1a

01e2f64c 76d9dcbb ole32!AppInvoke+0xab

01e2f72c 76d9a773 ole32!ComInvokeWithLockAndIPID+0×372

01e2f778 7669f34a ole32!ThreadInvoke+0×302

01e2f7b4 7669f4da RPCRT4!DispatchToStubInCNoAvrf+0×4a

01e2f80c 7669f3c6 RPCRT4!RPC_INTERFACE::DispatchToStubWorker+0×16c

01e2f834 766a0cef RPCRT4!RPC_INTERFACE::DispatchToStub+0×8b

01e2f86c 7669f882 RPCRT4!RPC_INTERFACE::DispatchToStubWithObject+0xb2

01e2f8b8 7669f7a4 RPCRT4!LRPC_SCALL::DispatchRequest+0×23b

01e2f8d8 7669f763 RPCRT4!LRPC_SCALL::QueueOrDispatchCall+0xbd

01e2f8f4 7669f5ff RPCRT4!LRPC_SCALL::HandleRequest+0×34f

01e2f928 7669f573 RPCRT4!LRPC_SASSOCIATION::HandleRequest+0×144

01e2f960 7669ee4f RPCRT4!LRPC_ADDRESS::HandleRequest+0xbd

01e2f9dc 7669ece7 RPCRT4!LRPC_ADDRESS::ProcessIO+0×50a

01e2f9e8 766a1357 RPCRT4!LrpcServerIoHandler+0×16

01e2f9f8 76ecd3a3 RPCRT4!LrpcIoComplete+0×16

01e2fa20 76ed0748 ntdll!TppAlpcpExecuteCallback+0×1c5

01e2fb88 76e11174 ntdll!TppWorkerThread+0×5a4

01e2fb94 76efb3f5 kernel32!BaseThreadInitThunk+0xe

01e2fbd4 76efb3c8 ntdll!__RtlUserThreadStart+0×70

01e2fbec 00000000 ntdll!_RtlUserThreadStart+0×1b
2: kd> !process 890ff430 1f

PROCESS 890ff430  SessionId: 1  Cid: 18a4    Peb: 7ffdc000  ParentCid: 1fdc

DirBase: 7fbf04e0  ObjectTable: da89fb80  HandleCount: 852.

Image: iexplore.exe
THREAD 89141db0  Cid 18a4.19c8  Teb: 7ffdf000 Win32Thread: bc373d18 WAIT: (Unknown) UserMode Non-Alertable

    8915b020  SynchronizationEvent

Not impersonating

DeviceMap                 da7f9680

Owning Process            890ff430       Image:         iexplore.exe

Attached Process          N/A            Image:         N/A

Wait Start TickCount      56879          Ticks: 1634 (0:00:00:25.531)

Context Switch Count      12410  NoStackSwap    LargeStack

UserTime                  00:00:00.078

KernelTime                00:00:01.234

Win32 Start Address iexplore!wWinMainCRTStartup (0x004031b9)

Start Address kernel32!BaseProcessStartThunk (0x77e617f8)

Stack Init b5672000 Current b56717c4 Base b5672000 Limit b566c000 Call 0

Priority 4 BasePriority 4 PriorityDecrement 0

ChildEBP RetAddr

b56717dc 80833ec5 nt!KiSwapContext+0x26

b5671808 80829c14 nt!KiSwapThread+0x2e5

b5671850 bf89ab73 nt!KeWaitForSingleObject+0x346

b56718ac bf8c4ba6 win32k!xxxSleepThread+0x1be

b5671948 bf8a13e0 win32k!xxxInterSendMsgEx+0x798

b5671994 bf8a132f win32k!xxxSendMessageTimeout+0x1f3

b56719b8 bf85ca01 win32k!xxxSendMessage+0×1b

b5671a7c bf85da04 win32k!xxxCalcValidRects+0xea

b5671ad8 bf85de2e win32k!xxxEndDeferWindowPosEx+0xf2

b5671af4 bf861cf2 win32k!xxxSetWindowPos+0xb1

b5671b3c bf882098 win32k!xxxProcessEventMessage+0×232

b5671c7c bf89b89e win32k!xxxScanSysQueue+0×21e

b5671ce4 bf89c529 win32k!xxxRealInternalGetMessage+0×2aa

b5671d48 8088b41c win32k!NtUserPeekMessage+0×42

b5671d48 7c82860c nt!KiFastCallEntry+0xfc (TrapFrame @ b5671d64)

0012e6e8 7739bde5 ntdll!KiFastSystemCallRet

0012e714 7739be5e USER32!NtUserPeekMessage+0xc

0012e740 02935f8c USER32!PeekMessageW+0xab

0012e7b4 02936150 IEUI!DUserRegisterSuper+0×920

0012e7d4 40d2ee98 IEUI!PeekMessageExW+0×42

0012e818 40d2abf4 IEFRAME!CBrowserFrame::FrameMessagePump+0×23

0012e824 40d2bc63 IEFRAME!BrowserThreadProc+0×3f

0012e848 40d2bbb1 IEFRAME!BrowserNewThreadProc+0×7b

0012f8b8 40d2ba61 IEFRAME!SHOpenFolderWindow+0×188

0012fae8 00401484 IEFRAME!IEWinMain+0×2d9

0012ff2c 0040131f iexplore!wWinMain+0×2c6

0012ffc0 77e6f23b iexplore!_initterm_e+0×1b1

0012fff0 00000000 kernel32!BaseProcessStart+0×23
- Dmitry Vostokov @ DumpAnalysis.org + TraceAnalysis.org -
Due to many requests especially from the readers of Memory Dump Analysis Anthology I’ve published symbol files for TestDefaultDebugger tools (TestDefaultDebugger.exe and TestDefaultDebugger64.exe). They can be downloaded from this location:
TestDefaultDebuggerPDBs.zip (2.5Mb)
- Dmitry Vostokov @ DumpAnalysis.org + TraceAnalysis.org -
In addition to hooked functions pattern we should also pay attention to Hooking Level. The latter is the number of patched functions. Often value-added hooksware has configuration options that fine-tune hooking behavior. For example, an application with the less number of patched functions behaved incorrectly and two process user dumps were saved from the working and non-working environment:
0:000> * problem behavior
0:000> !chkimg -lo 50 -d !user32 -v

Searching for module with expression: !user32

Will apply relocation fixups to file used for comparison

Will ignore NOP/LOCK errors

Will ignore patched instructions

Image specific ignores will be applied

Comparison image path: c:\mss\user32.dll\49E0380E9d000\user32.dll

No range specified
Scanning section:    .text

Size: 422527

Range to scan: 76e31000-76e9827f

    76e3d6f8-76e3d6fc  5 bytes - user32!NtUserSetThreadDesktop

 [ b8 30 12 00 00:e9 03 29 13 09 ]

    76e3dc2a-76e3dc2e  5 bytes - user32!CreateWindowExA (+0x532)

 [ 8b ff 55 8b ec:e9 d1 23 15 09 ]

    76e3f8f8-76e3f8fc  5 bytes - user32!PostMessageA (+0x1cce)

 [ 8b ff 55 8b ec:e9 03 07 fa 08 ]

    76e41305-76e41309  5 bytes - user32!CreateWindowExW (+0x1a0d)

 [ 8b ff 55 8b ec:e9 f6 ec 13 09 ]

    76e435e3-76e435e7  5 bytes - user32!NtUserSetWindowPos (+0x22de)

 [ b8 38 12 00 00:e9 18 ca 11 09 ]

    76e48343-76e48347  5 bytes - user32!PeekMessageA (+0x4d60)

 [ 8b ff 55 8b ec:e9 b8 7c fb 08 ]

    76e48ab3-76e48ab7  5 bytes - user32!GetMessageA (+0x770)

 [ 8b ff 55 8b ec:e9 48 75 fd 08 ]

    76e4a175-76e4a179  5 bytes - user32!PostMessageW (+0x16c2)

 [ 8b ff 55 8b ec:e9 86 5e f8 08 ]

    76e4fef7-76e4fefb  5 bytes - user32!GetMessageW (+0x5d82)

 [ 8b ff 55 8b ec:e9 04 01 fc 08 ]

    76e5045a-76e5045e  5 bytes - user32!PeekMessageW (+0x563)

 [ 8b ff 55 8b ec:e9 a1 fb f9 08 ]

    76e8d37d-76e8d381  5 bytes - user32!MessageBoxTimeoutW (+0x3cf23)

 [ 8b ff 55 8b ec:e9 7e 2c fd 08 ]

    76e8d4d9-76e8d4dd  5 bytes - user32!MessageBoxIndirectA (+0x15c)

 [ 8b ff 55 8b ec:e9 22 2b ff 08 ]

    76e8d5d3-76e8d5d7  5 bytes - user32!MessageBoxIndirectW (+0xfa)

 [ 8b ff 55 8b ec:e9 28 2a fe 08 ]

    76e8d65d-76e8d661  5 bytes - user32!MessageBoxExW (+0x8a)

 [ 8b ff 55 8b ec:e9 9e 29 00 09 ]

Total bytes compared: 422527(100%)

Number of errors: 70

70 errors : !user32 (76e3d6f8-76e8d661)
0:000> u EnumDisplayDevicesW

user32!EnumDisplayDevicesW:

76e3ba5b 8bff            mov     edi,edi

76e3ba5d 55              push    ebp

76e3ba5e 8bec            mov     ebp,esp

76e3ba60 81ec54030000    sub     esp,354h

76e3ba66 a1c090e976      mov     eax,dword ptr [user32!__security_cookie (76e990c0)]

76e3ba6b 33c5            xor     eax,ebp

76e3ba6d 8945fc          mov     dword ptr [ebp-4],eax

76e3ba70 53              push    ebx
0:000> * expected behavior
0:000> !chkimg -lo 50 -d !user32 -v

Searching for module with expression: !user32

Will apply relocation fixups to file used for comparison

Will ignore NOP/LOCK errors

Will ignore patched instructions

Image specific ignores will be applied

Comparison image path: c:\mss\user32.dll\49E0380E9d000\user32.dll

No range specified
Scanning section:    .text

Size: 422527

Range to scan: 76e31000-76e9827f

    76e39c11-76e39c15  5 bytes - user32!MonitorFromPoint

 [ 6a 08 68 50 9c:e9 ea 63 10 09 ]

    76e3b8ea-76e3b8ee  5 bytes - user32!GetMonitorInfoA (+0x1cd9)

 [ 8b ff 55 8b ec:e9 11 47 12 09 ]

    76e3ba5b-76e3ba5f  5 bytes - user32!EnumDisplayDevicesW (+0×171)

 [ 8b ff 55 8b ec:e9 a0 45 0b 09 ]

    76e3d6f8-76e3d6fa  3 bytes - user32!NtUserSetThreadDesktop (+0×1c9d)

 [ b8 30 12:e9 03 29 ]

    76e3d6fc - user32!NtUserSetThreadDesktop+4 (+0×04)

 [ 00:09 ]

    76e3dc2a-76e3dc2e  5 bytes - user32!CreateWindowExA (+0×52e)

 [ 8b ff 55 8b ec:e9 d1 23 15 09 ]

    76e3e7cd-76e3e7d1  5 bytes - user32!SetWindowLongA (+0xba3)

 [ 8b ff 55 8b ec:e9 2e 18 03 09 ]

    76e3f8f8-76e3f8fc  5 bytes - user32!PostMessageA (+0×112b)

 [ 8b ff 55 8b ec:e9 03 07 e7 08 ]

    76e41305-76e41309  5 bytes - user32!CreateWindowExW (+0×1a0d)

 [ 8b ff 55 8b ec:e9 f6 ec 13 09 ]

    76e413b4-76e413b8  5 bytes - user32!SetWindowLongW (+0xaf)

 [ 8b ff 55 8b ec:e9 47 ec 03 09 ]

    76e41709-76e4170d  5 bytes - user32!MonitorFromRect (+0×355)

 [ 6a 08 68 48 17:e9 f2 e8 0e 09 ]

    76e435e3-76e435e7  5 bytes - user32!NtUserSetWindowPos (+0×1eda)

 [ b8 38 12 00 00:e9 18 ca fe 08 ]

    76e440c5-76e440c9  5 bytes - user32!EnumDisplaySettingsExW (+0xae2)

 [ 8b ff 55 8b ec:e9 36 bf 06 09 ]

    76e441a1-76e441a5  5 bytes - user32!EnumDisplaySettingsW (+0xdc)

 [ 8b ff 55 8b ec:e9 5a be 08 09 ]

    76e46d4a-76e46d4e  5 bytes - user32!EnumDisplayDevicesA (+0×2ba9)

 [ 8b ff 55 8b ec:e9 b1 92 0b 09 ]

    76e46fe6-76e46fea  5 bytes - user32!EnumDisplaySettingsA (+0×29c)

 [ 8b ff 55 8b ec:e9 15 90 09 09 ]

    76e47010-76e47014  5 bytes - user32!EnumDisplaySettingsExA (+0×2a)

 [ 8b ff 55 8b ec:e9 eb 8f 07 09 ]

    76e47d12-76e47d16  5 bytes - user32!GetMonitorInfoW (+0xd02)

 [ 8b ff 55 8b ec:e9 e9 82 10 09 ]

    76e48343-76e48347  5 bytes - user32!PeekMessageA (+0×631)

 [ 8b ff 55 8b ec:e9 b8 7c e8 08 ]

    76e4844c-76e48450  5 bytes - user32!NtUserEnumDisplayMonitors (+0×109)

 [ b8 81 11 00 00:e9 af 7b 0c 09 ]

    76e488d4-76e488d8  5 bytes - user32!MonitorFromWindow (+0×488)

 [ 6a 08 68 28 89:e9 27 77 0d 09 ]

    76e48ab3-76e48ab7  5 bytes - user32!GetMessageA (+0×1df)

 [ 8b ff 55 8b ec:e9 48 75 ea 08 ]

    76e49994-76e49998  5 bytes - user32!GetWindowLongA (+0xee1)

 [ 6a 08 68 d0 99:e9 67 66 00 09 ]

    76e49af1-76e49af5  5 bytes - user32!GetSystemMetrics (+0×15d)

 [ 6a 0c 68 58 9b:e9 0a 65 12 09 ]

    76e4a175-76e4a179  5 bytes - user32!PostMessageW (+0×684)

 [ 8b ff 55 8b ec:e9 86 5e e5 08 ]

    76e4f8bf-76e4f8c3  5 bytes - user32!GetWindowLongW (+0×574a)

 [ 6a 08 68 00 f9:e9 3c 07 01 09 ]

    76e4fef7-76e4fefb  5 bytes - user32!GetMessageW (+0×638)

 [ 8b ff 55 8b ec:e9 04 01 e9 08 ]

    76e5045a-76e5045e  5 bytes - user32!PeekMessageW (+0×563)

 [ 8b ff 55 8b ec:e9 a1 fb e6 08 ]

    76e8d37d-76e8d381  5 bytes - user32!MessageBoxTimeoutW (+0×3cf23)

 [ 8b ff 55 8b ec:e9 7e 2c ea 08 ]

    76e8d4d9-76e8d4dd  5 bytes - user32!MessageBoxIndirectA (+0×15c)

 [ 8b ff 55 8b ec:e9 22 2b ec 08 ]

    76e8d5d3-76e8d5d7  5 bytes - user32!MessageBoxIndirectW (+0xfa)

 [ 8b ff 55 8b ec:e9 28 2a eb 08 ]

    76e8d65d-76e8d661  5 bytes - user32!MessageBoxExW (+0×8a)

 [ 8b ff 55 8b ec:e9 9e 29 ed 08 ]

Total bytes compared: 422527(100%)

Number of errors: 154

154 errors : !user32 (76e39c11-76e8d661)
0:000> u EnumDisplayDevicesW

user32!EnumDisplayDevicesW:

76e3ba5b e9a0450b09      jmp     7fef0000

76e3ba60 81ec54030000    sub     esp,354h

76e3ba66 a1c090e976      mov     eax,dword ptr [user32!__security_cookie (76e990c0)]

76e3ba6b 33c5            xor     eax,ebp

76e3ba6d 8945fc          mov     dword ptr [ebp-4],eax

76e3ba70 53              push    ebx

76e3ba71 56              push    esi

76e3ba72 8b7510          mov     esi,dword ptr [ebp+10h]
- Dmitry Vostokov @ DumpAnalysis.org + TraceAnalysis.org -
Embedded Comments in dump files are useful to record external information like the reason for saving a memory dump, a tool used to do that, and some pre-analysis and monitoring data that might help or guide in the future analysis. Comments are not widely used but some examples include Manual Process Dump, False Positive Dump patterns, and process and thread CPU consumption comments in dump files saved by Sysinternals ProcDump tool. Such comments may not be necessarily saved by IDebugClient2 :: WriteDumpFile2 function but any buffer saved in memory that is accessible later from a dump file will do as can be easily demonstrated by the old Citrix SystemDump tool.
- Dmitry Vostokov @ DumpAnalysis.org + TraceAnalysis.org -
If we look at any non-trivial trace we would see different Implementation Discourses. Components are written in different languages and adhere to different runtime environments, binary models and interface frameworks. All these implementation variations influence the structure, syntax and semantics of trace messages. For example, .NET debugging traces differ from file system driver or COM debugging messages. Therefore we establish the new field of Software Trace Linguistics as a science of software trace languages. Some parallels can be drawn here towards software linguistics (the science of software languages) although we came to that conclusion independently while thinking about applying “ethnography of speaking” to software trace narration. More on this in the following posts.
- Dmitry Vostokov @ DumpAnalysis.org + TraceAnalysis.org -