MessageBox at Dublin Zoo
November 24th, 2010Visited Dublin Zoo with my family during last Halloween weekend where my daughter pointed me to this funny message box:

- Dmitry Vostokov @ DumpAnalysis.org + TraceAnalysis.org -
Visited Dublin Zoo with my family during last Halloween weekend where my daughter pointed me to this funny message box:
- Dmitry Vostokov @ DumpAnalysis.org + TraceAnalysis.org -
When looking for the shortest book titles found this little book with a buzzing bug on its cover: Cdb!

CDB also stands for Console DeBugger from Microsoft Debugging Tools for Windows. It can be used in place of WinDbg for user space targets if you don’t like graphical interface or when GUI interferes with debugging.
I’m ordering it now to teach my son symbols! Although I should write my own book for OpenTask Baby Turing series.
- Dmitry Vostokov @ DumpAnalysis.org + TraceAnalysis.org -
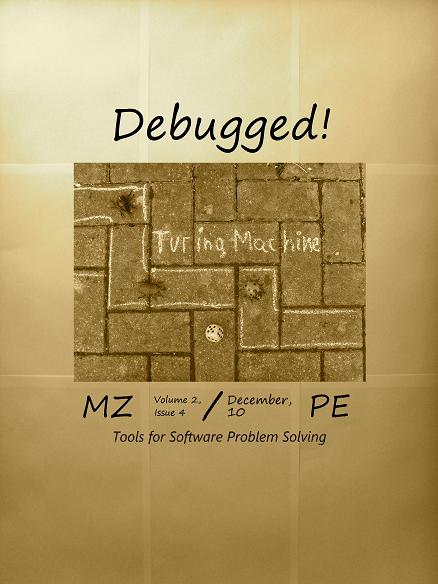
This is the main topic of the forthcoming December Debugged! MZ/PE magazine issue:
Debugged! MZ/PE: Tools for Software Problem Solving, December, 2010 (Paperback, ISBN: 978-1908043023)
The draft front cover symbolizes an element of randomness and chance exceptions in software problem solving.
- Dmitry Vostokov @ DumpAnalysis.org + TraceAnalysis.org -
Treat yourself, your family and friends with this selection of gifts from OpenTask store:
The perfect binary gift for your family and friends

The perfect gift for software engineers

The perfect gift for job hunters

- Dmitry Vostokov @ DumpAnalysis.org + TraceAnalysis.org -
Today we introduce an icon for Message Box pattern:
B/W
![]()
Color
![]()
- Dmitry Vostokov @ DumpAnalysis.org + TraceAnalysis.org -
During repeated execution either on one computer or in parallel on many computers with a uniform software / hardware the given process VM size tends to cluster around some value range, for example, 40 - 60 Mb. If we get a collection of user process memory dumps taken from several production servers, say 20 files, we can either employ scripts to process all of them or compare their file size and look for a bigger ones for a starter, for example, 85 or 110 Mb. For certain processes, for example, a print spooler, after a problem the process size tends to increase compared to normal execution. For other processes, certain error processing modules might be loaded increasing VM size or in case of incoming requests for a hang process certain memory regions like heap could increase as well contributing to dump file size increase. We call this pattern Fat Process Dump. If we have fat and thin clients we should also have thin and fat process dumps as well. A case study is following.
- Dmitry Vostokov @ DumpAnalysis.org + TraceAnalysis.org -
Designed in Terminal (services) font:

It is now a part of my Twitter profile too.
- Dmitry Vostokov @ DumpAnalysis.org + TraceAnalysis.org -
Domenico Scarlatti 555 binary form sonatas are an ideal background complement to a static memory dump analysis activity. Endless thread transitions between user and kernel spaces. A memory dump in front of my eyes in WinDbg window becomes live and software behavior patterns are literally heard (a spiking blocked thread trying to get a lock finally gets its and gradually descends from one module to another to rise again touching a kernel space ceiling and abruptly disappears from the memory landscape reborn in another thread form).
Domenico Scarlatti: Keyboard Sonatas (Complete)

- Dmitry Vostokov @ DumpAnalysis.org + TraceAnalysis.org -
This is a synthesized case study with the simplified ETW trace output based on real events (consider it as an exercise in a software narrative fiction). In a client-server environment a server session was always active regardless of whether a client was active or not. There was a workaround to enable a registry key to force checking for user activity via CheckActivity registry key. Unfortunately this didn’t help and a software trace was recorded for the offline analysis. First, we checked for Basic Facts and found the correspondence that confirmed the registry key setting:
#      PID  TID  Message

[...]

3200   1428 5476 CheckActivity = 1

[...]
There was also Periodic Errors throughout the whole trace fabric:
#       PID  TID  Message

[...]

119097  2468 476  Security check failed

[...]
Although such errors happened in a number of support incidents we see a message text we have never seen and couldn’t even find in our database of incidents (Defamiliarizing Effect):
#      PID  TID  Message

[...]

119090 2468 476  Calling the third party security information provider

119091 2468 476  Get security information: failed

[...]
Therefore we advised to test with the 3rd party security provider disabled. The software story continues…
- Dmitry Vostokov @ DumpAnalysis.org + TraceAnalysis.org -
Five volumes of cross-disciplinary Anthology (dubbed by the author “The Summa Memorianica”) lay the foundation of the scientific discipline of Memoretics (study of computer memory snapshots and their evolution in time) that is also called Memory Dump and Software Trace Analysis.ca
The 5th volume contains revised, edited, cross-referenced, and thematically organized selected DumpAnalysis.org blog posts about crash dump, software trace analysis and debugging written in February 2010 - October 2010 for software engineers developing and maintaining products on Windows platforms, quality assurance engineers testing software on Windows platforms, technical support and escalation engineers dealing with complex software issues, and security researchers, malware analysts and reverse engineers. The fifth volume features:
- 25 new crash dump analysis patterns
- 11 new pattern interaction case studies (including software tracing)
- 16 new trace analysis patterns
- 7 structural memory patterns
- 4 modeling case studies for memory dump analysis patterns
- Discussion of 3 common analysis mistakes
- Malware analysis case study
- Computer independent architecture of crash analysis report service
- Expanded coverage of software narratology
- Metaphysical and theological implications of memory dump worldview
- More pictures of memory space and physicalist art
- Classification of memory visualization tools
- Memory visualization case studies
- Close reading of the stories of Sherlock Holmes: Dr. Watson’s observational patterns
- Fully cross-referenced with Volume 1, Volume 2, Volume 3, and Volume 4
Product information:

Back cover features memory space art image Hot Computation: Memory on Fire.
- Dmitry Vostokov @ DumpAnalysis.org + TraceAnalysis.org -
This new pattern is called Blocked Queue and we provide an example of an ALPC port here. If we see an LPC/ALPC wait chain endpoint or just have a message address (and optionally a port address) we can check the port queue length, for example, for a frozen system we have this (WinDbg output was trimmed to save space and paper):
THREAD fffffa8009db7160  Cid 03b0.2ec0  Teb: 000007fffffd5000 Win32Thread: 0000000000000000 WAIT: (WrLpcReply) UserMode Non-Alertable

    fffffa8009db7520  Semaphore Limit 0x1

Waiting for reply to ALPC Message fffff8a00dbc6650 : queued at port fffffa800577ee60 : owned by process fffffa80056ddb30

Not impersonating

DeviceMap                 fffff8a000008b30

Owning Process            fffffa8005691b30       Image:         ServiceA.exe

Attached Process          N/A            Image:         N/A

Wait Start TickCount      39742808       Ticks: 3469954 (0:15:02:11.629)

Context Switch Count      9

UserTime                  00:00:00.000

KernelTime                00:00:00.000

Win32 Start Address 0×0000000076cd8e70

Stack Init fffff8800bf60db0 Current fffff8800bf60620

Base fffff8800bf61000 Limit fffff8800bf5b000 Call 0

Priority 10 BasePriority 9 UnusualBoost 0 ForegroundBoost 0 IoPriority 2 PagePriority 5

Kernel stack not resident.

Child-SP          RetAddr           Call Site

fffff880`0bf60660 fffff800`016de992 nt!KiSwapContext+0×7a

fffff880`0bf607a0 fffff800`016e0cff nt!KiCommitThreadWait+0×1d2

fffff880`0bf60830 fffff800`016f5d1f nt!KeWaitForSingleObject+0×19f

fffff880`0bf608d0 fffff800`019ddac6 nt!AlpcpSignalAndWait+0×8f

fffff880`0bf60980 fffff800`019dba50 nt!AlpcpReceiveSynchronousReply+0×46

fffff880`0bf609e0 fffff800`019d8fcb nt!AlpcpProcessSynchronousRequest+0×33d

fffff880`0bf60b00 fffff800`016d6993 nt!NtAlpcSendWaitReceivePort+0×1ab

fffff880`0bf60bb0 00000000`76d105aa nt!KiSystemServiceCopyEnd+0×13 (TrapFrame @ fffff880`0bf60c20)

00000000`01efe638 000007fe`fec0aa76 ntdll!ZwAlpcSendWaitReceivePort+0xa

00000000`01efe640 000007fe`fecacb64 RPCRT4!LRPC_CCALL::SendReceive+0×156

00000000`01efe700 000007fe`fecacd55 RPCRT4!NdrpClientCall3+0×244

00000000`01efe9c0 000007fe`fcbf18a1 RPCRT4!NdrClientCall3+0xf2

[…]
0: kd> !alpc /m fffff8a00dbc6650

Message @ fffff8a00dbc6650

  MessageID             : 0x0720 (1824)

  CallbackID            : 0x257C575 (39306613)

  SequenceNumber        : 0x00000002 (2)

  Type                  : LPC_REQUEST

  DataLength            : 0x0044 (68)

  TotalLength           : 0x006C (108)

  Canceled              : No

  Release               : No

  ReplyWaitReply        : No

  Continuation          : Yes

  OwnerPort             : fffffa8006a4bb10 [ALPC_CLIENT_COMMUNICATION_PORT]

  WaitingThread         : fffffa8009db7160

  QueueType             : ALPC_MSGQUEUE_PENDING

  QueuePort             : fffffa800577ee60 [ALPC_CONNECTION_PORT]

  QueuePortOwnerProcess : fffffa80056ddb30 (ServiceB.exe)

  ServerThread          : fffffa8007ead4d0

  QuotaCharged          : No

  CancelQueuePort       : 0000000000000000

  CancelSequencePort    : 0000000000000000

  CancelSequenceNumber  : 0×00000000 (0)

  ClientContext         : 0000000002a60f40

  ServerContext         : 0000000000000000

  PortContext           : 000000000227a370

  CancelPortContext     : 0000000000000000

  SecurityData          : 0000000000000000

  View                  : 0000000000000000
0: kd> !alpc /p fffffa800577ee60

Port @ fffffa800577ee60

  Type                      : ALPC_CONNECTION_PORT

  CommunicationInfo         : fffff8a0022435d0

    ConnectionPort          : fffffa800577ee60

    ClientCommunicationPort : 0000000000000000

    ServerCommunicationPort : 0000000000000000

  OwnerProcess              : fffffa80056ddb30 (ServiceB.exe)

  SequenceNo                : 0×0000481A (18458)

  CompletionPort            : fffffa8005728e80

  CompletionList            : 0000000000000000

  MessageZone               : 0000000000000000

  ConnectionPending         : No

  ConnectionRefused         : No

  Disconnected              : No

  Closed                    : No

  FlushOnClose              : Yes

  ReturnExtendedInfo        : No

  Waitable                  : No

  Security                  : Static

  Wow64CompletionList       : No
Main queue is empty.
Large message queue is empty.
Pending queue has 698 message(s)
    fffff8a002355aa0 00000404 0000000000001344:0000000000001358 0000000000000000 fffffa8004c0cb60 LPC_REQUEST

    fffff8a00a52f030 00000644 0000000000001078:00000000000024c0 0000000000000000 fffffa80072f1b60 LPC_REQUEST

    fffff8a00abb5030 000007a8 000000000000103c:000000000000050c 0000000000000000 fffffa800725b580 LPC_REQUEST

    fffff8a00239cab0 000000b8 0000000000000480:00000000000015f8 0000000000000000 fffffa80077f0b60 LPC_REQUEST

    fffff8a00ac81a90 00000a18 00000000000028ac:0000000000001e54 0000000000000000 fffffa8007fba060 LPC_CANCELED

    fffff8a005879140 00000f80 0000000000001260:0000000000000730 fffffa8006432060 fffffa8006b18060 LPC_REQUEST

    fffff8a013720d00 00000c6c 0000000000003764:00000000000032a8 0000000000000000 fffffa8006b00a60 LPC_CANCELED

    fffff8a00ac82660 00000810 0000000000003af4:0000000000002a98 0000000000000000 fffffa80068c0b60 LPC_CANCELED

    fffff8a00bdeca50 00000ec8 000000000000233c:00000000000013f8 0000000000000000 fffffa80079455b0 LPC_CANCELED

    fffff8a00b662830 000005cc 00000000000005e4:0000000000000e0c fffffa800791a7a0 fffffa8007376580 LPC_REQUEST

    fffff8a003d57150 00000f08 0000000000002678:0000000000003e0c 0000000000000000 fffffa8007e4a870 LPC_CANCELED

    fffff8a00cd08830 00000750 0000000000003408:0000000000003adc 0000000000000000 fffffa8008631b60 LPC_CANCELED

    fffff8a01855b2f0 000004f4 0000000000002c74:0000000000002d00 0000000000000000 fffffa800746b890 LPC_CANCELED

    fffff8a00da0d0b0 00000db0 0000000000001a34:0000000000002d80 0000000000000000 fffffa800aff4b60 LPC_CANCELED

    fffff8a00eddb030 0000059c 0000000000003f34:0000000000003c8c 0000000000000000 fffffa8008f96060 LPC_CANCELED

    fffff8a017a14d00 00000920 0000000000003850:0000000000002588 0000000000000000 fffffa8009f66060 LPC_CANCELED

    fffff8a01792d030 000007f8 0000000000003844:00000000000028d0 0000000000000000 fffffa800ad56260 LPC_CANCELED

    fffff8a00f8d6ae0 00000f30 000000000000239c:0000000000001694 0000000000000000 fffffa8008b86060 LPC_CANCELED

    fffff8a01395ab80 00000cdc 0000000000003630:00000000000018f8 0000000000000000 fffffa8005bc0770 LPC_CANCELED

    fffff8a0166ff800 00000984 00000000000005e4:00000000000025f4 fffffa8009718910 fffffa8008cbfb60 LPC_REQUEST

    fffff8a012b9f5a0 00000ac8 0000000000002d34:0000000000001b24 0000000000000000 fffffa8009cd8410 LPC_CANCELED

    fffff8a014313830 00000afc 00000000000005e4:00000000000023bc fffffa80073f0230 fffffa80054d7060 LPC_REQUEST

    fffff8a00a34a6b0 00000ca8 0000000000002534:0000000000002dd0 0000000000000000 fffffa80064c3980 LPC_CANCELED

[...]

    fffff8a00ad8f610 00000e64 0000000000003714:00000000000030b8 0000000000000000 fffffa800aeea9f0 LPC_REQUEST

    fffff8a015720710 00001594 0000000000003638:00000000000029b8 0000000000000000 fffffa800b5359a0 LPC_REQUEST

    fffff8a009bac560 00001508 0000000000003994:0000000000001aac 0000000000000000 fffffa800b5359a0 LPC_REQUEST

    fffff8a00b6e78f0 00001574 0000000000002938:0000000000001998 0000000000000000 fffffa800aeea9f0 LPC_REQUEST

    fffff8a00b5716b0 00001570 0000000000002938:0000000000001698 0000000000000000 fffffa800a3b8620 LPC_REQUEST

    fffff8a018531d00 00000db8 00000000000016d8:00000000000031c4 0000000000000000 fffffa800b5359a0 LPC_REQUEST

    fffff8a01112f410 000014b0 0000000000001b6c:0000000000001618 0000000000000000 fffffa800a3b8620 LPC_CANCELED
Canceled queue is empty.
- Dmitry Vostokov @ DumpAnalysis.org + TraceAnalysis.org -
As the Year of Dump Analysis 0×7DA (2010) comes closer to the end and the DeBugging decade starts 0×7DB (2011) soon we organize Debugging Joke Competition with the results announced on the 1st of January, 2011 (if Internet works). Please send your jokes using this contact form:
http://www.dumpanalysis.org/contact
Winners get signed (by Dr. DebugLove) copies of Dr. Debugalov book and the forthcoming full color coffee table book Spikes, Hangs, Crashes, Leaks and Dumps of Imagination: The Art of the Debugging Art.
- Dmitry Vostokov @ DumpAnalysis.org + TraceAnalysis.org -
Just came up with this one for a starter:
Q. Why is the execution of this program so stable? A. Because there is a breakpoint at every instruction.
For those from countries in the past socialist camp like Soviet Union it might appear bugtated from a joke I heard from one Moscow State University mathematics professor when I was a student:
“Q. Why is the Communist Party course always straight? A. Because there is an inflection at every point.”
- Dmitry Vostokov @ DumpAnalysis.org + TraceAnalysis.org -
In order to promote memory dump worldview and associated philosophy of memoidealism we have founded a society with a mission to teach memory dump analysis to everyone.
Dmitry Vostokov
Director of Studies
- Dmitry Vostokov @ DumpAnalysis.org + TraceAnalysis.org -
Memorianity provides a foundation for moral conduct, individual and social character development because it is based on a revelation that everything is saved. The theistic variation of this memory religion has also an organic and harmonious notion of Memory Deity. May you be memorized.
Dmitry Vostokov
Memoriarch
- Dmitry Vostokov @ DumpAnalysis.org + TraceAnalysis.org -
One of the most common patterns is Crash Signature. It consists of a set of attributes derivable from saved execution context for exceptions, faults and traps. For example, on x64 Windows it is usually RIP and RSP addresses. For x86 it is usually EIP, ESP and EBP. It can also include the application module name.
0:009> !analyze -v
[...]
FAILURE_BUCKET_ID: SOFTWARE_NX_FAULT_c0000005_ApplicationA.exe!Unknown
BUCKET_ID: APPLICATION_FAULT_SOFTWARE_NX_FAULT_STACK_CORRUPTION_BAD_IP_ApplicationA+2d560
[...]
0:009> kL

ChildEBP RetAddr

0354f270 75bc0962 ntdll!NtWaitForMultipleObjects+0x15

0354f30c 7651162d KERNELBASE!WaitForMultipleObjectsEx+0x100

0354f354 76511921 kernel32!WaitForMultipleObjectsExImplementation+0xe0

0354f370 76539b0d kernel32!WaitForMultipleObjects+0x18

0354f3dc 76539baa kernel32!WerpReportFaultInternal+0x186

0354f3f0 765398d8 kernel32!WerpReportFault+0x70

0354f400 76539855 kernel32!BasepReportFault+0x20

0354f48c 77750727 kernel32!UnhandledExceptionFilter+0x1af

0354f494 77750604 ntdll!__RtlUserThreadStart+0x62

0354f4a8 777504a9 ntdll!_EH4_CallFilterFunc+0x12

0354f4d0 777387b9 ntdll!_except_handler4+0x8e

0354f4f4 7773878b ntdll!ExecuteHandler2+0x26

0354f5a4 776f010f ntdll!ExecuteHandler+0x24

0354f5a4 0354f958 ntdll!KiUserExceptionDispatcher+0xf

WARNING: Frame IP not in any known module. Following frames may be wrong.

0354f908 02ff0340 0×354f958

00000000 00000000 0×2ff0340
0:009> kv

ChildEBP RetAddr  Args to Child

[...]

0354f5a4 0354f958 0154f5bc 0354f60c 0354f5bc ntdll!KiUserExceptionDispatcher+0xf (CONTEXT @ 0354f60c)

WARNING: Frame IP not in any known module. Following frames may be wrong.

0354f908 02ff0340 00000000 00000000 00000000 0×354f958

00000000 00000000 00000000 00000000 00000000 0×2ff0340
0:009> .cxr 0354f60c

eax=80010105 ebx=0354f924 ecx=00000003 edx=0000ffff esi=00d7dce0 edi=00d7e0c8

eip=0354f958 esp=0354f8f4 ebp=0354f908 iopl=0         nv up ei pl zr na pe nc

cs=0023  ss=002b  ds=002b  es=002b  fs=0053  gs=002b             efl=00010246

0354f958 64f9            stc
0:009> !address 0354f958

 TEB 7efdd000 in range 7efdb000 7efde000

 TEB 7efda000 in range 7efd8000 7efdb000

 TEB 7efd7000 in range 7efd5000 7efd8000

 TEB 7efaf000 in range 7efad000 7efb0000

 TEB 7efac000 in range 7efaa000 7efad000

 TEB 7efa9000 in range 7efa7000 7efaa000

 TEB 7efa6000 in range 7efa4000 7efa7000

 TEB 7efa3000 in range 7efa1000 7efa4000

 TEB 7ef9f000 in range 7ef9d000 7efa0000

 TEB 7ef9c000 in range 7ef9a000 7ef9d000

 TEB 7ef99000 in range 7ef97000 7ef9a000

 ProcessParametrs 007714b0 in range 00770000 00870000

 Environment 007707f0 in range 00770000 00870000

    03450000 : 0354d000 - 00003000

                    Type     00020000 MEM_PRIVATE

                    Protect  00000004 PAGE_READWRITE

                    State    00001000 MEM_COMMIT

                    Usage    RegionUsageStack

                    Pid.Tid  1ea0.12dc
0:009> !address 02ff0340

 TEB 7efdd000 in range 7efdb000 7efde000

 TEB 7efda000 in range 7efd8000 7efdb000

 TEB 7efd7000 in range 7efd5000 7efd8000

 TEB 7efaf000 in range 7efad000 7efb0000

 TEB 7efac000 in range 7efaa000 7efad000

 TEB 7efa9000 in range 7efa7000 7efaa000

 TEB 7efa6000 in range 7efa4000 7efa7000

 TEB 7efa3000 in range 7efa1000 7efa4000

 TEB 7ef9f000 in range 7ef9d000 7efa0000

 TEB 7ef9c000 in range 7ef9a000 7ef9d000

 TEB 7ef99000 in range 7ef97000 7ef9a000

 ProcessParametrs 007714b0 in range 00770000 00870000

 Environment 007707f0 in range 00770000 00870000

    02fc0000 : 02fc0000 - 00043000

                    Type     00020000 MEM_PRIVATE

                    Protect  00000004 PAGE_READWRITE

                    State    00001000 MEM_COMMIT

                    Usage    RegionUsageHeap

                    Handle   00d70000
Stack trace may or may not be included here and it might be incorrect, heuristic and not fully discernible automatically (requires raw stack semantic analysis) like in the example above. In some cases exception information might not be valid though, for example, in the case of laterally damaged or truncated memory dump files.
- Dmitry Vostokov @ DumpAnalysis.org + TraceAnalysis.org -
I’m pleased to announce that MDAA, Volume 4 is available in PDF format:
www.dumpanalysis.org/Memory+Dump+Analysis+Anthology+Volume+4
It features:
- 15 new crash dump analysis patterns
- 13 new pattern interaction case studies
- 10 new trace analysis patterns
- 6 new Debugware patterns and case study
- Workaround patterns
- Updated checklist
- Fully cross-referenced with Volume 1, Volume 2 and Volume 3
- Memory visualization tutorials
- Memory space art
Its table of contents is available here:
http://www.dumpanalysis.org/MDAA/MDA-Anthology-V4-TOC.pdf
Paperback and hardcover versions should be available in a week or two. I also started working on Volume 5 that should be available in December.
- Dmitry Vostokov @ DumpAnalysis.org + TraceAnalysis.org -
Where’s God in Memorianity (memory religion)? It borrows Samuel Alexander’s notion of the emergence of God as a new synthesis from patterns. In Alexander’s philosophy the basis of nature is space-time continuum with point-instants. In memoidealism (which is a metaphysical foundation of Memorianity) Memory is the basis of everything and in its memuonic formulation memuons play the role of memory-instants. Their patterns also involve emergents on every hierarchy level with Mind emerging at some memory organization level and then out of mind level we have emerging Deity.
- Dmitry Vostokov @ DumpAnalysis.org + TraceAnalysis.org -
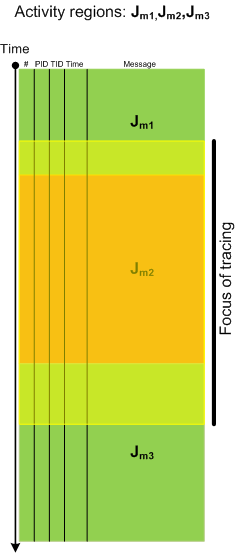
Activity Region pattern highlights “mechanical” and syntactical aspects of trace analysis whereas Focus of Tracing brings attention to changing semantics of trace message flow, for example in Citrix terminal services environment, from logon messages during session initialization to LHC database search. Here is a graphical illustration of this pattern where tracing focus region spans 3 regions of activity:
- Dmitry Vostokov @ DumpAnalysis.org + TraceAnalysis.org -
Memorized states and events look different from varying memory perspectives, for example, some historical event looks different to and interpreted differently by people of varying memory backgrounds. Memuonic version of memoidealist philosophy explains differences in memory perspectives by different memorizing orderings of memuons respective to some base memuon.
- Dmitry Vostokov @ DumpAnalysis.org + TraceAnalysis.org -