Bugtation No.143

June 3rd, 2011

Finally on the parallels between memory dump and software trace analysis and intelligence (Memoretics is a discipline that studies computer memory snapshots and their evolution in time):

Memoretics ”opens a unique window on” software “affairs”.

John H. Hedley, The Challenges of Intelligence Analysis, Strategic Intelligence, Volume 1

- Dmitry Vostokov @ DumpAnalysis.org + TraceAnalysis.org -

Crash Dump Analysis Patterns (Part 136)

June 1st, 2011

Version-Specific Extension is a pattern similar to Platform-Specific Debugger pattern by suggesting the course of the further debugging actions. Similar instructions are given when a debugger depends on specialized modules differing from platform (or application) version. We consider here a .NET example where opening a dump shows only that it was perhaps saved manually with possible hidden exceptions that need to be dug out:

0:000> !analyze -v

FAULTING_IP:
+0
00000000`00000000 ??              ???

EXCEPTION_RECORD:  ffffffffffffffff -- (.exr 0xffffffffffffffff)
ExceptionAddress: 0000000000000000
   ExceptionCode: 80000003 (Break instruction exception)
  ExceptionFlags: 00000000
NumberParameters: 0

We notice a failed attempt for .NET analysis and the following instructions on how correct it:

MANAGED_STACK: !dumpstack -EE
Failed to load data access DLL, 0×80004005

Verify that 1) you have a recent build of the debugger (6.2.14 or newer)
            2) the file mscordacwks.dll that matches your version of mscorwks.dll is in the version directory
            3) or, if you are debugging a dump file, verify that the file mscordacwks_<arch>_<arch>_<version>.dll is on your symbol path.
            4) you are debugging on the same architecture as the dump file. For example, an IA64 dump file must be debugged on an IA64 machine.

You can also run the debugger command .cordll to control the debugger's load of mscordacwks.dll.  .cordll -ve -u -l will do a verbose reload. If that succeeds, the SOS command should work on retry.

If you are debugging a minidump, you need to make sure that your executable path is pointing to mscorwks.dll as well.

Because we know that we have .NET framework installed on a postmortem debugging machine we check the target module version:

0:000> lmv m mscorwks
start             end                 module name
000007fe`ee380000 000007fe`eed1d000   mscorwks   (pdb symbols)       
    Loaded symbol image file: mscorwks.dll
    Image path: C:\Windows\Microsoft.NET\Framework64\v2.0.50727\mscorwks.dll
    Image name: mscorwks.dll
    Timestamp:        Sun Feb 06 20:53:54 2011 (4D4F0A62)
    CheckSum:         00990593
    ImageSize:        0099D000
    File version:     2.0.50727.5444
    Product version:  2.0.50727.5444
    File flags:       0 (Mask 3F)
    File OS:          4 Unknown Win32
    File type:        2.0 Dll
    File date:        00000000.00000000
    Translations:     0409.04b0
    CompanyName:      Microsoft Corporation
    ProductName:      Microsoft® .NET Framework
    InternalName:     mscorwks.dll
    OriginalFilename: mscorwks.dll
    ProductVersion:   2.0.50727.5444
    FileVersion:      2.0.50727.5444 (Win7SP1GDR.050727-5400)
    FileDescription:  Microsoft .NET Runtime Common Language Runtime - WorkStation
    LegalCopyright:   © Microsoft Corporation.  All rights reserved.
    Comments:         Flavor=Retail

It is slightly newer (.5444) than we have installed (.3619). The customer also sent their framework version together with the memory dump file. So we unload the current SOS extension (for details please see Managed Code Exception pattern): 

0:000> .chain
Extension DLL chain:
    C:\Windows\Microsoft.NET\Framework64\v2.0.50727\sos: image 2.0.50727.3619, API 1.0.0, built Mon Oct 25 06:52:09 2010
        [path: C:\Windows\Microsoft.NET\Framework64\v2.0.50727\sos.dll]
    dbghelp: image 6.11.0001.404, API 6.1.6, built Thu Feb 26 02:10:27 2009
        [path: C:\Program Files\Debugging Tools for Windows (x64)\dbghelp.dll]
    ext: image 6.11.0001.404, API 1.0.0, built Thu Feb 26 02:10:26 2009
        [path: C:\Program Files\Debugging Tools for Windows (x64)\winext\ext.dll]
    exts: image 6.11.0001.404, API 1.0.0, built Thu Feb 26 02:10:17 2009
        [path: C:\Program Files\Debugging Tools for Windows (x64)\WINXP\exts.dll]
    uext: image 6.11.0001.404, API 1.0.0, built Thu Feb 26 02:10:20 2009
        [path: C:\Program Files\Debugging Tools for Windows (x64)\winext\uext.dll]
    ntsdexts: image 6.1.7015.0, API 1.0.0, built Thu Feb 26 02:09:22 2009
        [path: C:\Program Files\Debugging Tools for Windows (x64)\WINXP\ntsdexts.dll]

0:000> .unload C:\Windows\Microsoft.NET\Framework64\v2.0.50727\sos
Unloading C:\Windows\Microsoft.NET\Framework64\v2.0.50727\sos extension DLL

and load the customer version:

0:000> .load \MyData\sos.dll

0:000> .chain
Extension DLL chain:
    \MyDatasos.dll: image 2.0.50727.5444, API 1.0.0, built Sun Feb 06 21:14:12 2011
        [path: \MyData\sos.dll]
    dbghelp: image 6.11.0001.404, API 6.1.6, built Thu Feb 26 02:10:27 2009
        [path: C:\Program Files\Debugging Tools for Windows (x64)\dbghelp.dll]
    ext: image 6.11.0001.404, API 1.0.0, built Thu Feb 26 02:10:26 2009
        [path: C:\Program Files\Debugging Tools for Windows (x64)\winext\ext.dll]
    exts: image 6.11.0001.404, API 1.0.0, built Thu Feb 26 02:10:17 2009
        [path: C:\Program Files\Debugging Tools for Windows (x64)\WINXP\exts.dll]
    uext: image 6.11.0001.404, API 1.0.0, built Thu Feb 26 02:10:20 2009
        [path: C:\Program Files\Debugging Tools for Windows (x64)\winext\uext.dll]
    ntsdexts: image 6.1.7015.0, API 1.0.0, built Thu Feb 26 02:09:22 2009
        [path: C:\Program Files\Debugging Tools for Windows (x64)\WINXP\ntsdexts.dll]

0:000> .cordll -ve -u -l
CLR DLL status: No load attempts

Then we do a load attempt: 

0:000> !CLRStack
CLRDLL: C:\Windows\Microsoft.NET\Framework64\v2.0.50727\mscordacwks.dll:2.0.50727.3619 f:0
doesn't match desired version 2.0.50727.5444 f:0
CLRDLL: Unable to find mscordacwks_AMD64_AMD64_2.0.50727.5444.dll by mscorwks search
CLRDLL: Unable to find ‘mscordacwks_AMD64_AMD64_2.0.50727.5444.dll’ on the path
CLRDLL: Unable to get version info for ‘c:\mss\mscorwks.dll\4D4F0A6299d000\mscordacwks_AMD64_AMD64_2.0.50727.5444.dll’, Win32 error 0n87
CLRDLL: ERROR: Unable to load DLL mscordacwks_AMD64_AMD64_2.0.50727.5444.dll, Win32 error 0n87
Failed to load data access DLL, 0×80004005

Verify that 1) you have a recent build of the debugger (6.2.14 or newer)
            2) the file mscordacwks.dll that matches your version of mscorwks.dll is in the version directory
            3) or, if you are debugging a dump file, verify that the file mscordacwks_<arch>_<arch>_<version>.dll is on your symbol path.
            4) you are debugging on the same architecture as the dump file. For example, an IA64 dump file must be debugged on an IA64 machine.

You can also run the debugger command .cordll to control the debugger's load of mscordacwks.dll.  .cordll -ve -u -l will do a verbose reload. If that succeeds, the SOS command should work on retry.

If you are debugging a minidump, you need to make sure that your executable path is pointing to mscorwks.dll as well.

We rename mscordacwks.dll to mscordacwks_AMD64_AMD64_2.0.50727.5444.dll and retry: 

0:000> .cordll -ve -u -l
CLR DLL status: No load attempts

0:000> !CLRStack
CLRDLL: C:\Windows\Microsoft.NET\Framework64\v2.0.50727\mscordacwks.dll:2.0.50727.3619 f:0
doesn't match desired version 2.0.50727.5444 f:0
CLRDLL: Loaded DLL \MyData\mscordacwks_AMD64_AMD64_2.0.50727.5444.dll
OS Thread Id: 0×16e8 (0)
Child-SP         RetAddr          Call Site
00000000002fe570 000007feeaf8e378 System.Windows.Forms.Application+ComponentManager.System.Windows.Forms. UnsafeNativeMethods.IMsoComponentManager.FPushMessageLoop(Int32, Int32, Int32)
00000000002fe7c0 000007feeaf8dde5 System.Windows.Forms.Application+ThreadContext.RunMessageLoopInner(Int32, System.Windows.Forms.ApplicationContext)
00000000002fe910 000007ff002364b6 System.Windows.Forms.Application+ThreadContext.RunMessageLoop(Int32, System.Windows.Forms.ApplicationContext)
00000000002fe970 000007feee6414c2 MyApplication.Main(System.String[])

0:000> !pe
Exception object: 00000000034a13f8
Exception type: System.IO.FileNotFoundException
Message: Could not load file or assembly 'System.Windows.Forms.XmlSerializers, Version=2.0.0.0, Culture=neutral, PublicKeyToken= ...' or one of its dependencies. The system cannot find the file specified.
InnerException: System.IO.FileNotFoundException, use !PrintException 00000000034a1b28 to see more
StackTrace (generated):
    SP               IP               Function
    00000000002FD0A0 0000000000000001 mscorlib_ni!System.Reflection.Assembly._nLoad(System.Reflection.AssemblyName, System.String, System.Security.Policy.Evidence, System.Reflection.Assembly, System.Threading.StackCrawlMark ByRef, Boolean, Boolean)+0x2
    00000000002FD0A0 000007FEED7ABF61 mscorlib_ni!System.Reflection.Assembly.InternalLoad(System.Reflection.AssemblyName, System.Security.Policy.Evidence, System.Threading.StackCrawlMark ByRef, Boolean)+0x1a1
    00000000002FD130 000007FEED7E4804 mscorlib_ni!System.Reflection.Assembly.Load(System.Reflection.AssemblyName)+0x24
    00000000002FD170 000007FEE7855C0A System_Xml_ni!System.Xml.Serialization.TempAssembly.LoadGeneratedAssembly(System.Type, System.String, System.Xml.Serialization.XmlSerializerImplementation ByRef)+0x11a

StackTraceString: <none>
HResult: 80070002

0:000> !PrintException 00000000034a1b28
Exception object: 00000000034a1b28
Exception type: System.IO.FileNotFoundException
Message: Could not load file or assembly 'System.Windows.Forms.XmlSerializers, Version=2.0.0.0, Culture=neutral, PublicKeyToken=...' or one of its dependencies. The system cannot find the file specified.
InnerException: <none>
StackTrace (generated):
<none>
StackTraceString: <none>
HResult: 80070002

- Dmitry Vostokov @ DumpAnalysis.org + TraceAnalysis.org -

Tapping (Debugging Slang, Part 23)

May 27th, 2011

Tapping - The act of collecting software traces for subsequent pattern-driven trace analysis. From TAP (Trace Analysis Pattern).

Examples: We started tapping the service for any anomalies. Software tapping methods and tools.

- Dmitry Vostokov @ DumpAnalysis.org + TraceAnalysis.org -

The Birth of Memory Intelligence Agency

May 26th, 2011

A few years ago when searching for interdisciplinary ideas via metaphorical bijections I found many parallels between memory dump analysis and intelligence. At that time I started reading a book Intelligence Analysis: A Target-Centric Approach, 2nd Edition (currently in the 3rd edition). Now looking at the cover of that book I think it might have later unconsciously influenced the picture of RADII process:

After some break with studying intelligence I now resume it after I found that tapping (trace analysis patterns for general memory traces with extra uncertainty attribute) could be a good basis for intelligence analysis patterns. My recent jump into cyber warfare also contributed to that. As a fictional continuation from MIx line (MI5, MI6 *) I feel the need to create MIA to promote such ideas (it is a well known fact that MI6 initially started as an amateurish organization **).

* MI5 and MI6 both look to me as pool tags :-) GCHQ sounds like related to Garbage Collector

** Strategic Intelligence [5 volumes], Volume 1

- Dmitry Vostokov @ DumpAnalysis.org + TraceAnalysis.org -

Bugtation No.142

May 25th, 2011

“The people behind your” crashes.

MAFIA

- Dmitry Vostokov @ DumpAnalysis.org + TraceAnalysis.org -

Bugtation No.141

May 24th, 2011

“… the vital point for you to understand is that all” tracing “must be conducted with the creation of” solution “in mind. That is what must colour and control your selection of” tracing “events.”

Michael Allen, The Truth About Writing

- Dmitry Vostokov @ DumpAnalysis.org + TraceAnalysis.org -

From Bugchecks to Patterns

May 24th, 2011

One of the questions asked during Introduction to Pattern-Driven Software Problem Solving Webinar was how to map bugcheck codes to crash dump analysis patterns. I’m starting this post to provide a few initial mappings and plan to extend it later.

BAD_POOL_CALLER (c2)

BAD_POOL_HEADER (19)

Dynamic Memory Corruption (kernel pool)

Self-Diagnosis (kernel mode)

UNEXPECTED_KERNEL_MODE_TRAP (7f)
Arg1: 00000000, EXCEPTION_DIVIDED_BY_ZERO

Divide by Zero (kernel mode)

NO_MORE_IRP_STACK_LOCATIONS (35)

Stack Overflow (software implementation)

MANUALLY_INITIATED_CRASH (e2)

NMI_HARDWARE_FAILURE (80)

CRITICAL_OBJECT_TERMINATION (f4)

KMODE_EXCEPTION_NOT_HANDLED (1e)
Arg2: 000000000000f001, The address that the exception occurred at

DRIVER_IRQL_NOT_LESS_OR_EQUAL (d1)
Arg4: 0000f001, address which referenced memory

Manual Dump (kernel)

- Dmitry Vostokov @ DumpAnalysis.org + TraceAnalysis.org -

Intelligence Analysis Patterns (Part 0)

May 22nd, 2011

Being deep into intelligence analysis while preparing for cyberwarfare memory dump analysis presentation I came to an idea of intelligence analysis patterns based on software trace analysis patterns and software narratology. Basically we consider intelligence data as pseudo-software trace messages with an additional probability field (column). Most of the patterns can be transferred and used immediately in intelligence analysis and I’m working on such a map. Because real software trace messages are quite certain (deterministic) where their sequences sometimes not (see, for example, Impossible Trace pattern) there are some unique patterns applicable only in intelligence analysis domain and I’m working on the first such pattern to introduce it in the next part.

- Dmitry Vostokov @ DumpAnalysis.org + TraceAnalysis.org -

START: Software Trace Analysis in Real Time

May 21st, 2011

Memory Dump Analysis Services is working on the “Start It” button:

http://www.dumpanalysis.com/introducing-project-start

- Dmitry Vostokov @ DumpAnalysis.org + TraceAnalysis.org -

Limited Offer of Summa Memorianica 5 Volume Set

May 20th, 2011

Memory Dump Analysis Services offers 5 volumes of Memory Dump Analysis Anthology (in PDF format) with a 50% discount until the end of June:

http://www.dumpanalysis.com/ultimate-memory-analysis-reference

- Dmitry Vostokov @ DumpAnalysis.org + TraceAnalysis.org -

On Memory-Time vs. Space-Time

May 20th, 2011

I came to the idea of Memory-Time when reading about Samuel Alexander’s Space-Time (see also Memory Creates God). Here Memory plays the same foundational part as Space with memory-instants paralleling point-instants. I recently found the notion of memory-time (small capitals) appearing in Wittgenstein lectures as cited in Jaakko Hintikka’s paper “Wittgenstein on being and time”. However, it is considered there from the phenomenological subject-based perspective with a role of memory in the creation of time and external world and was only present in the earlier Tractatus-based Wittgenstein’s worldview.

- Dmitry Vostokov @ DumpAnalysis.org + TraceAnalysis.org -

Pattern-Driven Software Trace Analysis

May 15th, 2011

Presentation Software Trace and Memory Dump Analysis: Patterns, Tools, Processes and Best Practices from E2E Virtualization Conference (13th of May, 2011) is available for download:

http://www.dumpanalysis.com/STMDA-materials

- Dmitry Vostokov @ DumpAnalysis.org + TraceAnalysis.org -

Computer Memory Monsters (Part 1)

May 11th, 2011

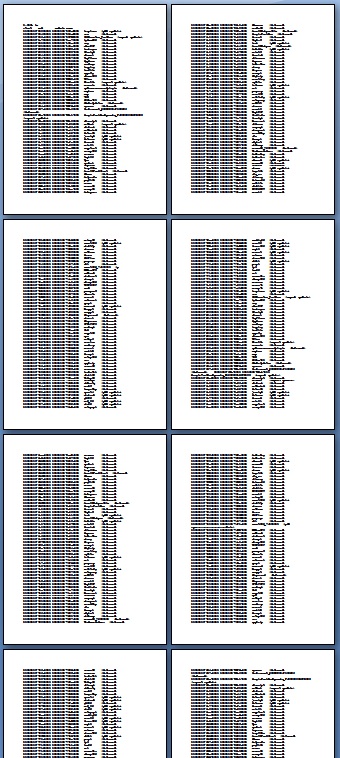
In this series we start with our analysis of monsters in the realm of computer memory, software defects, malware, corrupt software structures and their various behaviour. Some of monsters are based on exaggerated crash dump and software trace patterns, some are based on the accumulated debugging and technical support wisdom. The first monster we present today is called Chimera and it lives in DLL Hell. It is based on a exaggerated pattern called Module Variety. When opening a 64-bit memory dump it shows several pages of modules (lm WinDbg command):


As the monster’s creator explained to me they used an experimental way to represent every class object as a loaded component. And it was a word processor where every paragraph, every sentence, every word and every letter was an object implemented in a separate module! The goal was to have any letter literally dance on a screen if necessary.

- Dmitry Vostokov @ DumpAnalysis.org + TraceAnalysis.org -

Learning IDA (Update)

May 9th, 2011

I’ve just found that the second edition of the book The IDA Pro Book: The Unofficial Guide to the World’s Most Popular Disassembler is going to be published in June. Looking forward to reading the book.
- Dmitry Vostokov @ DumpAnalysis.org + TraceAnalysis.org -

On Natural Theology

May 9th, 2011

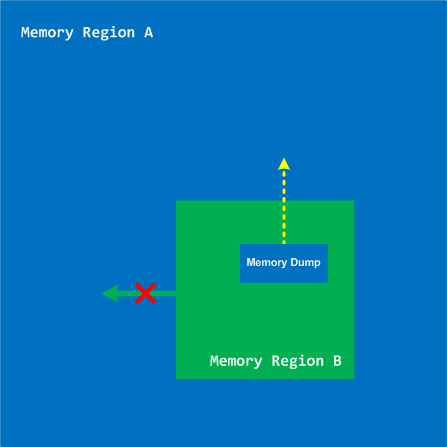
Having written on how Memoidealism explains miracles I now move into explaining the whole discipline of natural theology. I use one of the current definitions of it as “the idea that there exists some link between the world we observe and another transcendent realm” (Alister McGrath, Darwinism and The Divine). One such link is a memory dump from an inaccessible memory region.

- Dmitry Vostokov @ DumpAnalysis.org + TraceAnalysis.org -

Accelerated Windows Memory Dump Analysis Training Course

May 8th, 2011

Learn how to analyze application, service and system crashes and freezes, navigate through memory dump space and diagnose heap corruption, memory leaks, CPU spikes, blocked threads, deadlocks, wait chains, and much more. We use a unique and innovative pattern-driven analysis approach to speed up the learning curve.

Accelerated Windows Memory Dump Analysis Logo

Memory Dump Analysis Services organizes a training course.

If you are registered you are allowed to optionally submit your memory dumps before the training. This will allow us in addition to the carefully constructed problems tailor extra examples to the needs of the attendees. All registrants will receive an optional pre-test before the first session and an optional test after each session.

The training consists of 2 four-hour sessions (4 hours on the first day and 4 hours on the next day). When you finish the training you additionally get:

  1. A full transcript in PDF format (retail price $200)
  2. 5 volumes of Memory Dump Analysis Anthology in PDF format (retail price $100)
  3. An attendance certificate (PDF format)

Prerequisites: Basic Windows troubleshooting

Session 1: August 1, 2011 2:00 PM - 6:00 PM BST
Session 2: August 2, 2011 2:00 PM - 6:00 PM BST

Price: 210 USD

Space is limited.
Reserve your remote training seat now.

- Dmitry Vostokov @ DumpAnalysis.org + TraceAnalysis.org -

StopPages 2011 Victimware Analysis Conference

May 5th, 2011

This is a forthcoming virtual event to learn analysis of blockages, delays, obstructions, preventions, and stoppages in victimware suffering from software defects and malware. Additional information on how to join will be available soon on the main portal page:

http://www.dumpanalysis.org/stoppages2011

- Dmitry Vostokov @ DumpAnalysis.org + TraceAnalysis.org -

Trace Analysis Patterns (Part 40)

May 1st, 2011

Most of the time software trace messages coming from the same source code fragment (PLOT) contain invariant parts such as function and variable names, descriptions, and mutable parts such as pointer values and error codes. Message Invariant is a pattern useful for comparative analysis of several trace files where we are interested in message differences. For example, in one troubleshooting scenario certain objects were not created correctly for one user. We suspected a different object version was linked to a user profile. Separate application debug traces were recorded for each user and we could see version 0×4 for the problem user and 0×5 for all other normal users:

#    Module  PID  TID  Time         Message
[...]
2782 ModuleA 2124 5648 10:58:03.356 CreateObject: pObject 0×00A83D30 data ([…]) version 0×4
[…]

#    Module  PID  TID  Time         Message
[...]
4793 ModuleA 2376 8480 09:22:01.947 CreateObject: pObject 0×00BA4E20 data ([…]) version 0×5  
[…]

- Dmitry Vostokov @ DumpAnalysis.org + TraceAnalysis.org -

Metadefect Template Library (Part 0)

May 1st, 2011

To model software behavior at application and system levels, test generative debugging scenarious and construct software defects using metaprogramming I started working on MdTL (Metadefect Template Library). Its consists of C++ templates for structural and behavioral patterns. The simplest examples include Threads<Spike> and Spike<Thread>. The template classes can be more complex, of course, utilizing the full power of C++, STL, and existing libraries like Boost. The unique and novel feature of this library is the inclusion of dual classes of behaviour such as Leak<>, Deadlock<>, Overflow<>, Residue<>, Exception<>, Contention<>, etc. parameterized by various structural memory classes like Process<>, Thread<>, Heap<>, Stack<>, Region<>, Buffer<>, etc. MdTL also includes classes to model software tracing and this will be used for simultaneous software trace and memory dump analysis case study in the forthcoming presentation. I also plan to extend this metaprogramming approach in the future to model malware analysis patterns by introducing Metamalware Template Library (MmTL).

Forthcoming parts will introduce template classes and examples.

- Dmitry Vostokov @ DumpAnalysis.org + TraceAnalysis.org -

The New School of Debugging: What’s New

April 28th, 2011

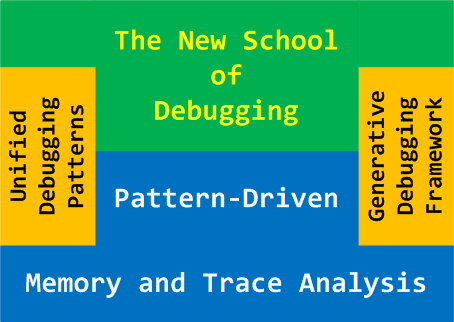
The New School of Debugging places pattern-driven memory and software trace analysis as a solid foundation for any debugging methodology, processes, tools and techniques. Unified Debugging Patterns and Generative Debugging Framework are additional features of the new school. To highlight its essentials I’ve created this draft diagram:

- Dmitry Vostokov @ DumpAnalysis.org + TraceAnalysis.org -