April 26th, 2011
Jobs page on Memory Dump, Software Trace, Debugging and Malware Analysis Portal now accepts company job ads related to security research, computer forensics, reverse engineering, and malware analysis in addition to debugging, software defect research, crash / core / memory dump and software trace analysis.
http://www.dumpanalysis.org/jobs
- Dmitry Vostokov @ DumpAnalysis.org + TraceAnalysis.org -
Posted in Announcements, Computer Forensics, Cyber Warfare, Malware Analysis, Memory Dump Analysis Jobs, Reverse Engineering, Security | No Comments »
April 26th, 2011
Sometimes I get cold phone calls (once it was from 012345678 number) and a guy asks me if I have a computer. I was always telling him that I’m a security professional and after that hanging up the phone. This morning I tried a different approach (SE - Social Engineer):
SE. We are Windows consulting services. Do you have a home computer?
Me. I’m sorry, we don’t have a computer.
SE. We can sell you the one. Are you interested?
Me. No, we are not. This is a temporary accommodation and we don’t need a computer.
SE. Sorry for bothering you.^x
- Dmitry Vostokov @ DumpAnalysis.org + TraceAnalysis.org -
Posted in Fun with Social Engineering, Security | 3 Comments »
April 26th, 2011
This pattern is a kernel mode counterpart to Self-Diagnosis in user mode. It is just a collection of bugcheck codes where a problem is usually detected before corruption causes a fault, exception or trap. Typical example would be a detection of a failed assertion or corrupt structures such as:
BAD_POOL_HEADER (19)

The pool is already corrupt at the time of the current request.

This may or may not be due to the caller.

The internal pool links must be walked to figure out a possible cause of the problem, and then special pool applied to the suspect tags or the driver verifier to a suspect driver.

Arguments:

Arg1: 00000020, a pool block header size is corrupt.

Arg2: 8b79d078, The pool entry we were looking for within the page.

Arg3: 8b79d158, The next pool entry.

Arg4: 8a1c0004, (reserved)
More examples would be added in the forthcoming case studies.
- Dmitry Vostokov @ DumpAnalysis.org + TraceAnalysis.org -
Posted in Crash Dump Analysis, Crash Dump Patterns, Debugging | 2 Comments »
April 25th, 2011
It’s time to select a secondary level school for my kids in advance. I wasn’t aware that such books exist and I was delighted when I saw the book in a local library. Unfortunately, my expectations weren’t met: 2/3rds of the book is just the list of schools and the text is too academic and politically correct for any good use except to reinforce common sense although I didn’t expect to hear saucy stories. Just two insights I found useful: some parents don’t enroll their children in the nearest school because they perceive themselves as not very responsible if they do that and don’t blindly trust school ranks in academic examination results as they might be influenced by school size. So my conclusion is that this book might be of some help to reevaluate your commitments if you rely too much on certain knowledge acquisition mechanisms such as “grapevine”, never thought about participating in PTA (Parent Teacher Association) or want to hear what Principles carefully say from their side. Some bibliography might be useful if you want to continue this research further on. However, the authors warn that no so much of it exists for Ireland.
Choosing a School: Second Level Education in Ireland
- Dmitry Vostokov @ LiterateScientist.com -
Posted in Education, From Cover To Cover, Reading List 2011, Reviewed on Amazon | No Comments »
April 25th, 2011
Here we continue with Technology-Specific Subtrace pattern series started earlier with COM interface invocation example. In this part we consider dynamic memory allocation example in kernel space (kernel pool). Usually pool corruption is detected during pool memory allocation or release with a special bugcheck code, for example:
BAD_POOL_HEADER (19)

The pool is already corrupt at the time of the current request.

This may or may not be due to the caller.

The internal pool links must be walked to figure out a possible cause of the problem, and then special pool applied to the suspect tags or the driver verifier to a suspect driver.

Arguments:

Arg1: 00000020, a pool block header size is corrupt.

Arg2: 8b79d078, The pool entry we were looking for within the page.

Arg3: 8b79d158, The next pool entry.

Arg4: 8a1c0004, (reserved)
However, pool corruption might be deeper enough to trigger an access violation even before self-diagnosis. In such cases stack subtraces with functions like ExFreePoolWithTag might point to troubleshooting and debugging directions:
ATTEMPTED_WRITE_TO_READONLY_MEMORY (be)

An attempt was made to write to readonly memory. The guilty driver is on the stack trace (and is typically the current instruction pointer).

When possible, the guilty driver’s name (Unicode string) is printed on the bugcheck screen and saved in KiBugCheckDriver.

Arguments:

Arg1: 00470044, Virtual address for the attempted write.

Arg2: 06d39025, PTE contents.

Arg3: aec0fb30, (reserved)

Arg4: 0000000a, (reserved)
TRAP_FRAME:  aec0fb30 -- (.trap 0xffffffffaec0fb30)

ErrCode = 00000003

eax=8ac12d38 ebx=8b700040 ecx=000001ff edx=00470040 esi=8ac12db8 edi=808b0b40

eip=808949e7 esp=aec0fba4 ebp=aec0fbf0 iopl=0 nv up ei pl nz na po nc

cs=0008  ss=0010  ds=0023  es=0023  fs=0030  gs=0000  efl=00010202

nt!ExFreePoolWithTag+0x6a3:

808949e7 895a04          mov     dword ptr [edx+4],ebx ds:0023:00470044=????????
STACK_TEXT:

aec0faa0 80860121 000000be 00470044 06d39025 nt!KeBugCheckEx+0x1b

aec0fb18 8088e490 00000001 00470044 00000000 nt!MmAccessFault+0xb25

aec0fb18 808949e7 00000001 00470044 00000000 nt!KiTrap0E+0xdc

aec0fbf0 808d93b5 8ac12dc0 00000000 00000000 nt!ExFreePoolWithTag+0×6a3

aec0fc08 808cd304 e5ae5770 8ac12dc0 8aa77db0 nt!CmpFreePostBlock+0×4d

aec0fc3c 8082ea53 8ac12dc0 aec0fc88 aec0fc7c nt!CmpPostApc+0xde

aec0fc8c 80833eec 00000000 00000000 00000000 nt!KiDeliverApc+0xf9

aec0fcc4 808290bd aec0fd64 8099781c 0160fd44 nt!KiSwapThread+0×300

aec0fd0c 809978a0 00000001 00000000 f77275e0 nt!KeDelayExecutionThread+0×2ab

aec0fd54 8088b45c 00000000 0160fd74 0160fd9c nt!NtDelayExecution+0×84

aec0fd54 7c82847c 00000000 0160fd74 0160fd9c nt!KiFastCallEntry+0xfc

WARNING: Frame IP not in any known module. Following frames may be wrong.

0160fd9c 00000000 00000000 00000000 00000000 0×7c82847c
1: kd> !pool 8ac12dc0

Pool page 8ac12dc0 region is Nonpaged pool

 8ac12000 size:  858 previous size:    0  (Allocated)  TWPG

 8ac12858 size:    8 previous size:  858  (Free)       ….

 8ac12860 size:   20 previous size:    8  (Allocated)  VadS

 8ac12880 size:    8 previous size:   20  (Free)       NtFs

 8ac12888 size:   20 previous size:    8  (Allocated)  VadS

 8ac128a8 size:   28 previous size:   20  (Allocated)  Ntfn

 8ac128d0 size:   30 previous size:   28  (Allocated)  Vad

 8ac12900 size:   40 previous size:   30  (Allocated)  Muta (Protected)

 8ac12940 size:   38 previous size:   40  (Allocated)  Sema (Protected)

 8ac12978 size:   40 previous size:   38  (Allocated)  Muta (Protected)

 8ac129b8 size:  270 previous size:   40  (Allocated)  Thre (Protected)

 8ac12c28 size:   40 previous size:  270  (Allocated)  Ntfr

 8ac12c68 size:   d0 previous size:   40  (Allocated)  DRIV

8ac12d38 is not a valid large pool allocation, checking large session pool…

8ac12d38 is freed (or corrupt) pool

Bad previous allocation size @8ac12d38, last size was 1a
***

*** An error (or corruption) in the pool was detected;

*** Attempting to diagnose the problem.

***

*** Use !poolval 8ac12000 for more details.

***
Pool page [ 8ac12000 ] is __inVALID.
Analyzing linked list...

[ 8ac12c68 --> 8ac12db8 (size = 0x150 bytes)]: Corrupt region

Scanning for single bit errors...
None found
- Dmitry Vostokov @ DumpAnalysis.org + TraceAnalysis.org -
Posted in Crash Dump Analysis, Crash Dump Patterns, Debugging, Software Trace Analysis, Software Trace Reading, Trace Analysis Patterns | No Comments »
April 24th, 2011
Module Hint pattern is frequently observed in dynamic memory corruption incidents. It is similar to Execution Residue or String Parameter patterns were we have ASCII or UNICODE fragments providing troubleshooting and debugging hints. Module Hint is therefore a more specialized pattern where we can link module names to raw data. For example, a kernel memory dump saved after the detected pool corruption shows P12345.DLL module name in a pool entry that can provide a link to the corresponding functionally to be reconfigured or removed:
BAD_POOL_HEADER (19)

The pool is already corrupt at the time of the current request.

This may or may not be due to the caller.

The internal pool links must be walked to figure out a possible cause of the problem, and then special pool applied to the suspect tags or the driver verifier to a suspect driver.

Arguments:

Arg1: 00000020, a pool block header size is corrupt.

Arg2: 8b79d078, The pool entry we were looking for within the page.

Arg3: 8b79d158, The next pool entry.

Arg4: 8a1c0004, (reserved)
STACK_TEXT:

b3e0aa4c 808947bb 00000019 00000020 8b79d078 nt!KeBugCheckEx+0x1b

b3e0aab4 b368c00f 8b79d080 00000000 00000000 nt!ExFreePoolWithTag+0×477

b3e0aac4 b366c68e 8b79d080 00000000 00000000 DriverA!MemFree+0xf

[…]

b3e0ac44 8081e0c3 808f77c9 b3e0ac64 808f77c9 nt!IovCallDriver+0×112

b3e0ac50 808f77c9 8a8eef60 8b6862a8 8a8eeef0 nt!IofCallDriver+0×13

b3e0ac64 808f856b 8ce456b0 8a8eeef0 8b6862a8 nt!IopSynchronousServiceTail+0×10b

b3e0ad00 808f109a 000009dc 00000000 00000000 nt!IopXxxControlFile+0×5e5

b3e0ad34 8088b45c 000009dc 00000000 00000000 nt!NtDeviceIoControlFile+0×2a

b3e0ad34 7c82847c 000009dc 00000000 00000000 nt!KiFastCallEntry+0xfc

WARNING: Frame IP not in any known module. Following frames may be wrong.

00f5fb18 00000000 00000000 00000000 00000000 0×7c82847c
2: kd> !pool 8b79d080

Pool page 8b79d080 region is Unknown

 8b79d000 size:   30 previous size:    0  (Allocated)  FSfm

 8b79d030 size:   28 previous size:   30  (Allocated)  VadS

 8b79d058 size:   20 previous size:   28  (Allocated)  ReEv

*8b79d078 size:   e0 previous size:   20  (Allocated) *DRIV

  Owning component : Unknown (update pooltag.txt)

8b79d158 is not a valid large pool allocation, checking large session pool…

8b79d158 is freed (or corrupt) pool

Bad previous allocation size @8b79d158, last size was 1c
***

*** An error (or corruption) in the pool was detected;

*** Pool Region unknown (0xFFFFFFFF8B79D158)

***

*** Use !poolval 8b79d000 for more details.

***
2: kd> dc 8b79d078

8b79d078  [...] ..DRIV  ......AP

8b79d088  [...] P12345.DLL……

8b79d098  […] …..<%n……..

8b79d0a8  […] ….$…:.F…X.

[…]
- Dmitry Vostokov @ DumpAnalysis.org + TraceAnalysis.org -
Posted in Crash Dump Analysis, Crash Dump Patterns, Debugging | 3 Comments »
April 22nd, 2011
Very simple methodology summarized in just 3 words applicable to any problem solving domain and its activities including software troubleshooting and debugging:
Artifacts. Checklists. Patterns.
As an example of checklists and patterns please see these 3 presentations related to memory dump and software trace artifacts:
Introduction to Pattern-Driven Software Problem Solving
Fundamentals of Complete Crash and Hang Memory Dump Analysis
Pattern-Driven Memory Dump Analysis
I’m now working on a detailed presentation of this methodology.
- Dmitry Vostokov @ DumpAnalysis.org + TraceAnalysis.org -
Posted in Announcements, Debugging, Debugging Methodology, Escalation Engineering, New Acronyms, Root Cause Analysis, Software Technical Support, Troubleshooting Methodology | No Comments »
April 22nd, 2011
A page to reference all different kinds of .NET related patterns is necessary, so I created this post:
I’ll update it as soon as I add more similar patterns.
- Dmitry Vostokov @ DumpAnalysis.org + TraceAnalysis.org -
Posted in .NET Debugging, CDA Pattern Classification, Crash Dump Analysis, Crash Dump Patterns, Debugging, Training and Seminars | No Comments »
April 21st, 2011
Imagine a pattern-driven crash analysis report (car) when you need it: at the very moment of a crash, just in time! And the car drives you to a problem resolution. Imagine also a periodic pattern-driven just-in-time memory space analysis (JIT MSA) that provides you instant intelligent reports on what’s going on inside memory while your application, service or system is running! This is a forthcoming optional client side part of CARE (Crash Analysis Report Environment) which is being developed by Memory Dump Analysis Services engineering team under the leadership of Alexey Golikov. Combined with generative debugging techniques both client and server parts form a complete unique enterprise crash and hang analysis solution suitable for development and production environments. Stay tuned for further exciting updates.
PS. The car drives on a road to the first fault software problem solving.
- Dmitry Vostokov @ DumpAnalysis.org + TraceAnalysis.org -
Posted in Crash Analysis Report Environment (CARE), Crash Dump Analysis, Debugging, Debugging Methodology, Escalation Engineering, First Fault Problem Solving, Generative Debugging, JIT Crash Analysis, JIT Memory Space Analysis, Memory Analysis Forensics and Intelligence, Memory Dump Analysis Services, Pattern Prediction, Software Behavior Patterns, Software Engineering, Software Technical Support, Testing, Tools, Windows System Administration | No Comments »
April 17th, 2011
I’m pleased to announce that MDAA, Volume 5 is available in PDF format:
www.dumpanalysis.org/Memory+Dump+Analysis+Anthology+Volume+5
It features:
- 25 new crash dump analysis patterns
- 11 new pattern interaction case studies (including software tracing)
- 16 new trace analysis patterns
- 7 structural memory patterns
- 4 modeling case studies for memory dump analysis patterns
- Discussion of 3 common analysis mistakes
- Malware analysis case study
- Computer independent architecture of crash analysis report service
- Expanded coverage of software narratology
- Metaphysical and theological implications of memory dump worldview
- More pictures of memory space and physicalist art
- Classification of memory visualization tools
- Memory visualization case studies
- Close reading of the stories of Sherlock Holmes: Dr. Watson’s observational patterns
- Fully cross-referenced with Volume 1, Volume 2, Volume 3, and Volume 4
Its table of contents is available here:
www.dumpanalysis.org/MDAA/MDA-Anthology-V5-TOC.pdf
Paperback and hardcover versions should be available in a week or two. I also started working on Volume 6 that should be available in November-December.
- Dmitry Vostokov @ DumpAnalysis.org + TraceAnalysis.org -
Posted in Aesthetics of Memory Dumps, Analysis Notation, Announcements, AntiPatterns, Archaeology of Computer Memory, Art, Assembly Language, Best Practices, Books, C and C++, CDF Analysis Tips and Tricks, Categorical Debugging, Citrix, Common Mistakes, Common Questions, Complete Memory Dump Analysis, Computer Forensics, Computer Science, Crash Analysis Report Environment (CARE), Crash Dump Analysis, Crash Dump De-analysis, Crash Dump Patterns, Crash Dumps for Dummies, Cyber Warfare, Debugging, Debugging Bureau, Debugging Industry, Debugging Methodology, Debugging Slang, Debugging Trends, Deep Down C++, Dr. Watson, Dublin School of Security, Education and Research, Escalation Engineering, Fun with Crash Dumps, Fun with Debugging, Fun with Software Traces, General Memory Analysis, Hermeneutics of Memory Dumps and Traces, Images of Computer Memory, Kernel Development, Malware Analysis, Mathematics of Debugging, Memiotics (Memory Semiotics), Memory Analysis Forensics and Intelligence, Memory Diagrams, Memory Dump Analysis Services, Memory Dumps in Myths, Memory Space Art, Memory Systems Language, Memory Visualization, Memory and Glitches, Metaphysics of Memory Worldview, Multithreading, Music for Debugging, New Acronyms, New Debugging School, New Words, Pattern Models, Philosophy, Physicalist Art, Publishing, Reverse Engineering, Science of Memory Dump Analysis, Science of Software Tracing, Security, Software Architecture, Software Behavior Patterns, Software Chorography, Software Chorology, Software Defect Construction, Software Engineering, Software Generalist, Software Maintenance Institute, Software Narratology, Software Technical Support, Software Trace Analysis, Software Trace Reading, Software Trace Visualization, Software Tracing for Dummies, Software Troubleshooting Patterns, Software Victimology, Structural Memory Patterns, Structural Trace Patterns, Systems Thinking, Testing, The Way of Philip Marlowe, Tools, Trace Analysis Patterns, Training and Seminars, Troubleshooting Methodology, Victimware, Vista, Webinars, WinDbg Scripting Extensions, WinDbg Scripts, WinDbg Tips and Tricks, WinDbg for GDB Users, Windows 7, Windows Server 2008, Windows System Administration, Workaround Patterns, x64 Windows | No Comments »
April 15th, 2011
Followed by my search for a periodic table of software defects I came up with a novel approach called Generative Debugging partially borrowed from principles and parameters generative linguistics framework. For debugging and post-construction software problem solving purposes we have Behavioral Principles and Structural Parameters. The parameters allow us to describe existing and even generate new software defects (I’m also considering Structural Principles and Behavioural Parameters but whether this is fruitful needs to be explored and seen. We may also consider the name “generative debugging” as a “naming” counterpart to software construction problem solving called generative programming. So the former could also be used to generate problem solutions faster in automatic fashion. Both, in the future, may be combined into a unified generative software problem solving.
As a first example, consider an application functional hang with a thread blocked by a pending I/O request packet (IRP). It is composed from general behavioral principle of blocked (or unresponsive) activity and structural parameters including Thread and IRP.
In the following parts many software incidents will be explored from this generative perspective.
- Dmitry Vostokov @ DumpAnalysis.org + TraceAnalysis.org -
Posted in Announcements, Debugging, Generative Debugging, Memory Systems Language, New Debugging School, Software Behavior Patterns, Structural Memory Patterns, Structural Trace Patterns | No Comments »
April 12th, 2011
I’m to present pattern-driven software trace analysis with examples from application and desktop delivery environments featuring Memory Dump Analysis Services at the forthcoming E2E Virtualization Conference (PubForum) in Dublin on 13th of May, 2011. Topics include a case study covering simultaneous analysis of software traces and memory dumps.

- Dmitry Vostokov @ DumpAnalysis.org + TraceAnalysis.org -
Posted in Announcements, CDF Analysis Tips and Tricks, Crash Dump Analysis, Crash Dump Patterns, Debugging, Presentations, Software Technical Support, Software Trace Analysis, Software Trace Reading, Tools, Trace Analysis Patterns | 1 Comment »
April 11th, 2011
Memory Dump Analysis Services plans a free Webinar in July to introduce a uniform methodology and tools for analysis of memory in cyber intelligence and counterintelligence activities.

- Dmitry Vostokov @ DumpAnalysis.org + TraceAnalysis.org -
Posted in Announcements, Crash Dump Analysis, Cyber Warfare, Memory Analysis Forensics and Intelligence, Memory Dump Analysis Services, Security, Software Trace Analysis, Tools, Training and Seminars, Webinars | No Comments »
April 11th, 2011
Adjoint Thread invariants like PID can be reused giving rise to curious CDF (ETW) traces where two separate execution entities are glued together in one trace. For example, in one trace we see AppA and AppB sharing the same PID
#      Module  PID  TID   Time         Message

[…]

242583 ProcMon 5492 9476  11:04:33.398 LoadImageEvent for ImageName: …\AppA.exe PID: 5492

256222 ProcMon 5492 9476  11:04:50.036 ProcessDestroyEvent for PPID: 12168 PID: 5492

274887 ProcMon 5492 10288 11:05:18.235 LoadImageEvent for ImageName: …\AppB.exe PID: 5492

[…]
Other similar examples might include different instances of components sharing the same name, source code or even, in general, periodic tracing sessions appended to the end of the same trace file although we are thinking that the latter should be a separate pattern. We named this pattern Glued Activity by an analogy of different thread strings glued together (in general, manifiolds glued along their boundaries). Another name might be along the line of adjoint thread ID reuse (ATID Reuse).
- Dmitry Vostokov @ DumpAnalysis.org + TraceAnalysis.org -
Posted in CDF Analysis Tips and Tricks, Debugging, Software Trace Analysis, Trace Analysis Patterns | No Comments »
April 10th, 2011
The first Webinar to start an in-depth discussion of a uniform methodology and tools for analysis of crashes, hangs, and other types of abnormal software behaviour in cloud environments.

Memory Dump Analysis Services (DumpAnalysis.com) organizes a free Webinar
Date: 13th of June 2011
Time: 18:45 (BST) 13:45 (EST) 10:45 (PST)
Duration: 60 minutes
Topics include:
- What’s old
- What’s new
- Orbifold memory spaces
- Methodology and best practices
- Cloud-specific patterns
- Hands-on exercises
Prerequisites: working knowledge of basic memory dump analysis or live debugging.
Space is limited.
Reserve your Webinar seat now at:
https://www3.gotomeeting.com/register/597101206
- Dmitry Vostokov @ DumpAnalysis.org + TraceAnalysis.org -
Posted in .NET Debugging, Announcements, Cloud Memory Dump Analysis, Crash Dump Analysis, Debugging, Memory Dump Analysis Services, Training and Seminars, Webinars | No Comments »
April 5th, 2011
Finally, after the numerous delays, the first Windows Debugging Notebook is almost ready for publication by the end of this month with a new cover and a foreword written by Mario Hewardt, the author of Advanced Windows Debugging and Advanced .NET Debugging books:
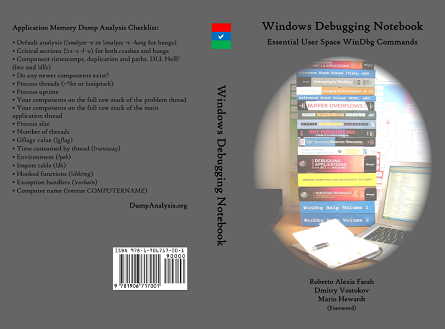
It is the first notebook because we have decided to split it into 3 different memory space volumes and one additional overview volume for concepts and tools:
- Windows Debugging Notebook: Essential User Space WinDbg Commands (ISBN: 978-1906717001 and 978-0955832857)
- Windows Debugging Notebook: Essential Kernel Space WinDbg Commands (ISBN: 978-1908043146)
- Windows Debugging Notebook: Essential Managed Space WinDbg .NET Commands (ISBN: 978-1908043153)
- Windows Debugging Notebook: Essential Concepts and Tools (ISBN: 978-1908043160)
On a bookshelf you would be able to distinguish between the first 3 volumes by a 3 color spine stripe with an appropriate check on it: red for kernel, blue for user, and green for managed space.
The Table of Contents has been changed too.
- Dmitry Vostokov @ DumpAnalysis.org + TraceAnalysis.org -
Posted in Announcements, Assembly Language, Books, Crash Dump Analysis, Debugging, Escalation Engineering, Publishing, Reverse Engineering, Security, Software Engineering, Software Technical Support, WinDbg Scripts, WinDbg Tips and Tricks | 2 Comments »
April 5th, 2011
This is a kernel space counterpart to Custom Exception Handler pattern in user space. In the following stack trace below we see that DriverA code intercepted an access violation exception resulted from dereferencing a NULL pointer and generated a custom bugcheck:
kd> !analyze -v
[...]
EXCEPTION_RECORD: fffff8801c757158 -- (.exr 0xfffff8801c757158)

ExceptionAddress: fffff88003977de1 (DriverA!foo+0x0000000000000381)

ExceptionCode: c0000005 (Access violation)

  ExceptionFlags: 00000000

NumberParameters: 2

  Parameter[0]: 0000000000000000

  Parameter[1]: 0000000000000070

Attempt to read from address 0000000000000070
TRAP_FRAME: fffff8801c757200 -- (.trap 0xfffff8801c757200)

NOTE: The trap frame does not contain all registers.

Some register values may be zeroed or incorrect.

rax=0000000000000000 rbx=0000000000000000 rcx=fffff8a00da3f3c0

rdx=0000000000000000 rsi=0000000000000000 rdi=0000000000000000

rip=fffff88003977de1 rsp=fffff8801c757390 rbp=fffffa8009a853f0

 r8=0000000000000000 r9=0000000000000000 r10=006800740020006e

r11=fffff8a00da3f3c6 r12=0000000000000000 r13=0000000000000000

r14=0000000000000000 r15=0000000000000000

iopl=0 nv up ei pl zr na po nc

DriverA!foo+0×381:

fffff880`03977de1 0fb74070 movzx eax,word ptr [rax+70h] ds:0703:0070=????

Resetting default scope
[...]
kd> kL 100

Child-SP          RetAddr           Call Site

fffff880`1c7560f8 fffff880`039498f7 nt!KeBugCheckEx

fffff880`1c756100 fffff880`039352a0 DriverA!MyBugCheckEx+0×93

fffff880`1c756140 fffff800`016f1d1c DriverA!MyExceptionFilter+0×1d0

fffff880`1c756210 fffff800`016e940d nt!_C_specific_handler+0×8c

fffff880`1c756280 fffff800`016f0a90 nt!RtlpExecuteHandlerForException+0xd

fffff880`1c7562b0 fffff800`016fd9ef nt!RtlDispatchException+0×410

fffff880`1c756990 fffff800`016c2d82 nt!KiDispatchException+0×16f

fffff880`1c757020 fffff800`016c18fa nt!KiExceptionDispatch+0xc2

fffff880`1c757200 fffff880`03977de1 nt!KiPageFault+0×23a

fffff880`1c757390 fffff880`03977754 DriverA!foo+0×381

fffff880`1c757430 fffff880`0396f006 DriverA!bar+0×74

[…]

fffff880`1c7579b0 fffff800`019a6e0a DriverA!QueryInformation+0×30b

fffff880`1c757a70 fffff800`016c2993 nt!NtQueryInformationFile+0×535

fffff880`1c757bb0 00000000`76e5fe6a nt!KiSystemServiceCopyEnd+0×13

00000000`0a08dfe8 00000000`00000000 0×76e5fe6a
kd> !exchain

24 stack frames, scanning for handlers...

Frame 0×05: nt!RtlpExecuteHandlerForException+0xd (fffff800`016e940d)

  ehandler nt!RtlpExceptionHandler (fffff800`016e93d0)

Frame 0×07: nt!KiDispatchException+0×16f (fffff800`016fd9ef)

  ehandler nt!_GSHandlerCheck_SEH (fffff800`0169aec0)

Frame 0×0b: DriverA!bar+0×74 (fffff880`03977754)

  ehandler DriverA!__GSHandlerCheck (fffff880`039a12fc)

[…]

Frame 0×14: DriverA!QueryInformation+0×30b (fffff880`039303ab)

  ehandler DriverA!_C_specific_handler (fffff880`039a1864)

Frame 0×15: nt!NtQueryInformationFile+0×535 (fffff800`019a6e0a)

  ehandler nt!_C_specific_handler (fffff800`016f1c90)

Frame 0×16: nt!KiSystemServiceCopyEnd+0×13 (fffff800`016c2993)

  ehandler nt!KiSystemServiceHandler (fffff800`016c2580)

Frame 0×17: error getting module for 0000000076e5fe6a
- Dmitry Vostokov @ DumpAnalysis.org + TraceAnalysis.org -
Posted in Crash Dump Analysis, Crash Dump Patterns, Debugging, Kernel Development, x64 Windows | No Comments »
April 1st, 2011
Just curious about wetware patterns. I think that if any meaningful patterns are found in wetware they would be on a micro scale…
- Dmitry Vostokov @ DumpAnalysis.org + TraceAnalysis.org -
Posted in Announcements, Wetware Patterns | No Comments »
March 28th, 2011
Data Correlation is a general pattern where values found in different parts of a memory dump correlate between each other according to some rules, for example, in some proportion. Here we show a variant for function parameters.
A process user memory dump showed a C++ exception:
0:000> kL

  *** Stack trace for last set context - .thread/.cxr resets it

ChildEBP RetAddr

0012e950 78158e89 kernel32!RaiseException+0x53

0012e988 7830770c msvcr80!_CxxThrowException+0×46

0012e99c 783095bc mfc80u!AfxThrowMemoryException+0×19

0012e9b4 02afa8ca mfc80u!operator new+0×27

0012e9c8 02b0992f ModuleA!std::_Allocate<…>+0×1a

0012e9e0 02b09e7c ModuleA!std::vector<double,std::allocator<double> >::vector<double,std::allocator<double> >+0×3f

[…]
We suspected an out-of-memory condition and looked for function parameters:
0:000> kv 5

ChildEBP RetAddr  Args to Child

0012e950 78158e89 e06d7363 00000001 00000003 kernel32!RaiseException+0x53

0012e988 7830770c 0012e998 783b0110 783c8d68 msvcr80!_CxxThrowException+0x46

0012e99c 783095bc 0000a7c0 0012ea40 000014f8 mfc80u!AfxThrowMemoryException+0x19

0012e9b4 02afa8ca 0000a7c0 089321b0 089321f0 mfc80u!operator new+0×27 (FPO: [Uses EBP] [1,0,0])

0012e9c8 02b0992f 000014f8 00000000 00000008 ModuleA!std::_Allocate<…>+0×1a (FPO: [2,3,0])
Because of FPO optimization we originally thought that stack arguments would be invalid. However, bearing in mind the function prototype and semantics of operator new and std::vector double element type we immediately see the correlation between 0xa7c0 and 0×14f8 which are proportional to sizeof(double) == 8:
0:000> ? 0000a7c0/000014f8

Evaluate expression: 8 = 00000000`00000008
We therefore conclude without looking at disassembly that memory allocation size was 42944 bytes:
0:000> .formats 0000a7c0

Evaluate expression:

  Hex:     00000000`0000a7c0

  Decimal: 42944

  Octal:   0000000000000000123700

  Binary:  00000000 00000000 00000000 00000000 00000000 00000000 10100111 11000000

  Chars:   ……..

  Time:    Thu Jan 01 11:55:44 1970

  Float:   low 6.01774e-041 high 0

  Double:  2.12172e-319
- Dmitry Vostokov @ DumpAnalysis.org + TraceAnalysis.org -
Posted in Crash Dump Analysis, Crash Dump Patterns, Debugging | No Comments »
March 26th, 2011
I’m speechless for this occasion, look with awe at what has been done, and can only show a slide from the yesterday’s presentation Introduction to Pattern-Driven Software Problem Solving:

- Dmitry Vostokov @ DumpAnalysis.org + TraceAnalysis.org -
Posted in Announcements, History | 1 Comment »