Bugtation No.159
September 25th, 2012Software diagnosis requires intelligence.
- Dmitry Vostokov @ DumpAnalysis.org + TraceAnalysis.org -
Software diagnosis requires intelligence.
- Dmitry Vostokov @ DumpAnalysis.org + TraceAnalysis.org -
This is a high contention pattern variant where the contention is around a monitor object. For example, we have a distributed CPU spike for some threads:
0:000> !runaway

 User Mode Time

  Thread       Time

   9:6ff4      0 days 0:07:39.019

  12:6b88      0 days 0:06:19.786

  11:6bf0      0 days 0:06:13.889

  10:6930      0 days 0:06:09.240

  16:3964      0 days 0:05:44.483

  17:6854      0 days 0:05:35.326

  13:668c      0 days 0:05:35.123

  14:5594      0 days 0:05:34.858

  15:7248      0 days 0:05:23.111

   2:c54       0 days 0:00:41.215

   4:1080      0 days 0:00:00.349

   7:10f0      0 days 0:00:00.302

   0:c3c       0 days 0:00:00.271

[...]
If we look at their stack traces we find them all blocked trying to enter a monitor, for example:
0:000> ~*k
[...]
  12  Id: d50.6b88 Suspend: 0 Teb: 000007ff`fffd8000 Unfrozen

Child-SP          RetAddr           Call Site

00000000`1a98e798 000007fe`fd0c1420 ntdll!ZwWaitForMultipleObjects+0xa

00000000`1a98e7a0 00000000`76e82cf3 KERNELBASE!WaitForMultipleObjectsEx+0xe8

00000000`1a98e8a0 000007fe`f82e0669 kernel32!WaitForMultipleObjectsExImplementation+0xb3

00000000`1a98e930 000007fe`f82dbec9 mscorwks!WaitForMultipleObjectsEx_SO_TOLERANT+0xc1

00000000`1a98e9d0 000007fe`f82a0569 mscorwks!Thread::DoAppropriateAptStateWait+0x41

00000000`1a98ea30 000007fe`f82beaec mscorwks!Thread::DoAppropriateWaitWorker+0x191

00000000`1a98eb30 000007fe`f81f1b9a mscorwks!Thread::DoAppropriateWait+0x5c

00000000`1a98eba0 000007fe`f82fd3c9 mscorwks!CLREvent::WaitEx+0xbe

00000000`1a98ec50 000007fe`f81ac6be mscorwks!AwareLock::EnterEpilog+0xc9

00000000`1a98ed20 000007fe`f81c7b2b mscorwks!AwareLock::Enter+0x72

00000000`1a98ed50 000007fe`f87946af mscorwks!AwareLock::Contention+0x1fb

00000000`1a98ee20 000007ff`00161528 mscorwks!JITutil_MonContention+0xdf

00000000`1a98efd0 000007ff`0016140e 0×7ff`00161528

00000000`1a98f040 000007ff`00167271 0×7ff`0016140e

00000000`1a98f0a0 000007fe`f74e2bbb 0×7ff`00167271

00000000`1a98f130 000007fe`f753ed76 mscorlib_ni+0×2f2bbb

00000000`1a98f180 000007fe`f8390282 mscorlib_ni+0×34ed76

00000000`1a98f1d0 000007fe`f8274363 mscorwks!CallDescrWorker+0×82

00000000`1a98f220 000007fe`f8274216 mscorwks!CallDescrWorkerWithHandler+0xd3

00000000`1a98f2c0 000007fe`f81c96a7 mscorwks!DispatchCallDebuggerWrapper+0×3e

00000000`1a98f320 000007fe`f830ae42 mscorwks!DispatchCallNoEH+0×5f

00000000`1a98f3a0 000007fe`f81bdc00 mscorwks!AddTimerCallback_Worker+0×92

00000000`1a98f430 000007fe`f82a41a5 mscorwks!ManagedThreadCallState::IsAppDomainEqual+0×4c

00000000`1a98f480 000007fe`f82df199 mscorwks!SVR::gc_heap::make_heap_segment+0×155

00000000`1a98f550 000007fe`f82ececa mscorwks!DoOpenIAssemblyStress::DoOpenIAssemblyStress+0×99

00000000`1a98f590 000007fe`f830c0db mscorwks!AddTimerCallbackEx+0xba

00000000`1a98f650 000007fe`f81ebb37 mscorwks!ThreadpoolMgr::AsyncTimerCallbackCompletion+0×53

00000000`1a98f6b0 000007fe`f81fe92a mscorwks!UnManagedPerAppDomainTPCount::DispatchWorkItem+0×157

00000000`1a98f750 000007fe`f81bb1fc mscorwks!ThreadpoolMgr::WorkerThreadStart+0×1ba

00000000`1a98f7f0 00000000`76e7652d mscorwks!Thread::intermediateThreadProc+0×78

00000000`1a98fcc0 00000000`76fac521 kernel32!BaseThreadInitThunk+0xd

00000000`1a98fcf0 00000000`00000000 ntdll!RtlUserThreadStart+0×1d
[...]
  15  Id: d50.7248 Suspend: 0 Teb: 000007ff`ffee6000 Unfrozen

Child-SP          RetAddr           Call Site

00000000`1c16e6f0 000007fe`f87946af mscorwks!AwareLock::Contention+0×13b

00000000`1c16e7c0 000007ff`0016135e mscorwks!JITutil_MonContention+0xdf

00000000`1c16e970 000007ff`0016726b 0×7ff`0016135e

00000000`1c16e9c0 000007fe`f74e2bbb 0×7ff`0016726b

00000000`1c16ea50 000007fe`f753ed76 mscorlib_ni+0×2f2bbb

00000000`1c16eaa0 000007fe`f8390282 mscorlib_ni+0×34ed76

00000000`1c16eaf0 000007fe`f8274363 mscorwks!CallDescrWorker+0×82

00000000`1c16eb40 000007fe`f8274216 mscorwks!CallDescrWorkerWithHandler+0xd3

00000000`1c16ebe0 000007fe`f81c96a7 mscorwks!DispatchCallDebuggerWrapper+0×3e

00000000`1c16ec40 000007fe`f830ae42 mscorwks!DispatchCallNoEH+0×5f

00000000`1c16ecc0 000007fe`f81bdc00 mscorwks!AddTimerCallback_Worker+0×92

00000000`1c16ed50 000007fe`f82a41a5 mscorwks!ManagedThreadCallState::IsAppDomainEqual+0×4c

00000000`1c16eda0 000007fe`f82df199 mscorwks!SVR::gc_heap::make_heap_segment+0×155

00000000`1c16ee70 000007fe`f82ececa mscorwks!DoOpenIAssemblyStress::DoOpenIAssemblyStress+0×99

00000000`1c16eeb0 000007fe`f830c0db mscorwks!AddTimerCallbackEx+0xba

00000000`1c16ef70 000007fe`f81ebb37 mscorwks!ThreadpoolMgr::AsyncTimerCallbackCompletion+0×53

00000000`1c16efd0 000007fe`f81fe92a mscorwks!UnManagedPerAppDomainTPCount::DispatchWorkItem+0×157

00000000`1c16f070 000007fe`f81bb1fc mscorwks!ThreadpoolMgr::WorkerThreadStart+0×1ba

00000000`1c16f110 00000000`76e7652d mscorwks!Thread::intermediateThreadProc+0×78

00000000`1c16f9e0 00000000`76fac521 kernel32!BaseThreadInitThunk+0xd

00000000`1c16fa10 00000000`00000000 ntdll!RtlUserThreadStart+0×1d
[...]
Thread #15 seems was caught at the time it was trying to enter and not waiting yet. If we check a monitor object the thread #12 tries to enter we see it has an address 01af0be8:
0:000> !u 000007ff`00161528

Normal JIT generated code

[…]

000007ff`00161505 90              nop

000007ff`00161506 48b8f089ae1100000000 mov rax,11AE89F0h

000007ff`00161510 488b00          mov     rax,qword ptr [rax]

000007ff`00161513 48894528        mov     qword ptr [rbp+28h],rax

000007ff`00161517 488b4528        mov     rax,qword ptr [rbp+28h]

000007ff`0016151b 48894518        mov     qword ptr [rbp+18h],rax

000007ff`0016151f 488b4d28        mov     rcx,qword ptr [rbp+28h]

000007ff`00161523 e8b8d422f8      call    mscorwks!JIT_MonEnter (000007fe`f838e9e0)

>>> 000007ff`00161528 90              nop

000007ff`00161529 90              nop

000007ff`0016152a 90              nop

[…]

000007ff`001615d2 4883c430        add     rsp,30h

000007ff`001615d6 5d              pop     rbp

000007ff`001615d7 f3c3            rep ret
0:000> dps 11AE89F0h l1

00000000`11ae89f0  00000000`01af0be8
This object seems to be owned by the thread #17:
0:000> !syncblk

Index         SyncBlock MonitorHeld Recursion Owning Thread Info          SyncBlock Owner

 1362 000000001ba7b6c0           15         1 000000001c0173b0  6854  17   0000000001af0be8 System.Object

[…]
This thread seems to be blocked in ALPC:
0:017> k

Child-SP          RetAddr           Call Site

00000000`1d55c9e8 000007fe`fee1a776 ntdll!NtAlpcSendWaitReceivePort+0xa

00000000`1d55c9f0 000007fe`fee14e42 rpcrt4!LRPC_CCALL::SendReceive+0x156

00000000`1d55cab0 000007fe`ff0828c0 rpcrt4!I_RpcSendReceive+0x42

00000000`1d55cae0 000007fe`ff08282f ole32!ThreadSendReceive+0x40

00000000`1d55cb30 000007fe`ff08265b ole32!CRpcChannelBuffer::SwitchAptAndDispatchCall+0xa3

00000000`1d55cbd0 000007fe`fef3daaa ole32!CRpcChannelBuffer::SendReceive2+0x11b

00000000`1d55cd90 000007fe`fef3da0c ole32!CAptRpcChnl::SendReceive+0x52

00000000`1d55ce60 000007fe`ff08205d ole32!CCtxComChnl::SendReceive+0x68

00000000`1d55cf10 000007fe`feebfd61 ole32!NdrExtpProxySendReceive+0x45

00000000`1d55cf40 000007fe`ff07f82f rpcrt4!NdrpClientCall2+0x9ea

00000000`1d55d6b0 000007fe`fef3d8a2 ole32!ObjectStublessClient+0x1ad

00000000`1d55da40 000007fe`fa511ba8 ole32!ObjectStubless+0x42

[...]
- Dmitry Vostokov @ DumpAnalysis.org + TraceAnalysis.org -
Learn from this Webinar about phenomenological, hermeneutical and analytical approaches to software diagnostics and its knowledge, foundations, norms, theories, logic, methodology, language, ontology, nature and truth. This seminar is hosted by Software Diagnostics Services.

Title: Introduction to Philosophy of Software Diagnostics
Date: 17th of December, 2012
Time: 19:00 GMT
Duration: 60 minutes
Space is limited.
Reserve your Webinar seat now at:
https://www3.gotomeeting.com/register/872846486
- Dmitry Vostokov @ DumpAnalysis.org + TraceAnalysis.org -
I was very pleased to find out this book that uses WinDbg as OS reversing tool. Not only you learn a very important aspect of Windows internals related to crash and hang memory dump analysis (all crash processing starts from memory manager) but you also learn many WinDbg commands from practical reversing experiments. I was even more pleased to find the output of WinDbg command on the page 0, before even the table of contents.
What Makes It Page?: The Windows 7 (x64) Virtual Memory Manager
- Dmitry Vostokov @ DumpAnalysis.org + TraceAnalysis.org -
If you liked An Introduction to General Systems Thinking book then you really need this comprehensive introduction which is more formal. Don’t be overwhelmed by the number of pages, you only need to read part 1, the first 218 pages as the rest is a collection of articles you can read selectively later on. For me one of the great features was the coverage of systems literature including some mathematical treatment books (including category theory in addition to famous Rosen’s books such as Anticipatory Systems). I also liked the discussion of critics of general systems theory that points to the fact that it should be called general systems-theory not general-systems theory. Highly recommended.
Facets of Systems Science (IFSR International Series on Systems Science and Engineering)
- Dmitry Vostokov @ LiterateScientist.com -
We tried to post this positive review on Amazon 3 times and each time it was rejected despite being an Amazon verified purchase:
We decided that we never post a review on Amazon again due to such censoring of an opinion about mathematical physics and category theory textbook.
- Dmitry Vostokov @ LiterateScientist.com -
This book came to my attention because it starts with category theory in the first chapters and then moves to traditional contemporary mathematical physics topics such as topology and operators. It also covers groups, vector spaces, their duals, tensors, associative and Lie algebras, representation theory, spectral theorem, distributions, homotopy and homology. The author also provides physical examples along the way such as Fock vector spaces, dynamical systems, Minkowski space and algebra of observables. The flow of this mathematical text is very smooth (proofs can be omitted from reading) and explanations are very intuitive. The latter seems to be the main goal of this text. It is also structured into 56 chapters so it can be possible to casually read this book in 2 months during commuting like I did. One strange thing I noticed though is the avoidance of the manifold terminology: the author only uses the word “manifold” only once and without an explanation what it is about so you may even not notice that.
Mathematical Physics (Chicago Lectures in Physics)
- Dmitry Vostokov @ LiterateScientist.com -
We continue with such problem pattern category and discuss Unresponsive Window pattern. The previous one was Error Message Box. We all see hang windows from time to time. This can happen, for example, from a main thread blocked in a wait chain. Some windows become unresponsive only temporary, for example, when a window message loop results in a CPU intensive window procedure code path. When I open large WinDbg logs generated by WinDbg scripts running on a complete memory dump in Notepad it opens up a frozen window for some seconds and sometimes for a minute or two. To get an unresponsive window for a longer time I opened a PDF file with a size of a few MB and I attached WinDbg. I got this stack trace:
0:000> k

Child-SP          RetAddr           Call Site

00000000`001ecce0 000007fe`ff9fdf89 USP10!otlCacheManager::GetNextLookup+0x12a

00000000`001ecd40 000007fe`ff9fa134 USP10!ApplyFeatures+0x489

00000000`001ed000 000007fe`ff9e1600 USP10!SubstituteOtlGlyphs+0x224

00000000`001ed0b0 000007fe`ff9d4b60 USP10!GenericEngineGetGlyphs+0x1000

00000000`001ed450 000007fe`ff9989c5 USP10!ShlShape+0x7a0

00000000`001ed670 000007fe`ff9a7363 USP10!ScriptShape+0x205

00000000`001ed710 000007fe`ff9a8ac9 USP10!RenderItemNoFallback+0x433

00000000`001ed7d0 000007fe`ff9a8d86 USP10!RenderItemWithFallback+0x129

00000000`001ed820 000007fe`ff9aa5f7 USP10!RenderItem+0x36

00000000`001ed870 000007fe`ff99b2c9 USP10!ScriptStringAnalyzeGlyphs+0x277

00000000`001ed910 000007fe`ff30285c USP10!ScriptStringAnalyse+0x399

00000000`001ed990 000007fe`ff3031c1 LPK!EditStringAnalyse+0x1d4

00000000`001eda70 000007fe`fc876c05 LPK!EditCchInWidth+0x4e

00000000`001edad0 000007fe`fc85862e COMCTL32!EditML_BuildchLines+0x221

00000000`001edba0 000007fe`fc878f56 COMCTL32!Edit_ResetTextInfo+0x82

00000000`001edbe0 000007fe`fc85a566 COMCTL32!EditML_WndProc+0x456

00000000`001edcd0 00000000`77a19bd1 COMCTL32!Edit_WndProc+0xe0a

00000000`001edd70 00000000`77a16aa8 USER32!UserCallWinProcCheckWow+0x1ad

00000000`001ede30 00000000`77a16bad USER32!SendMessageWorker+0x682

00000000`001edec0 00000000`ff7f4256 USER32!SendMessageW+0x5c

00000000`001edf10 00000000`ff7f43d6 NOTEPAD!LoadFile+0x7cb

00000000`001ee260 00000000`ff7f1018 NOTEPAD!NPInit+0x802

00000000`001efbb0 00000000`ff7f133c NOTEPAD!WinMain+0xc7

00000000`001efc30 00000000`7764652d NOTEPAD!DisplayNonGenuineDlgWorker+0x2da

00000000`001efcf0 00000000`77b2c521 kernel32!BaseThreadInitThunk+0xd

00000000`001efd20 00000000`00000000 ntdll!RtlUserThreadStart+0x1d
Another notepad.exe instance had this similar stack trace:
0:000> k

Child-SP          RetAddr           Call Site

00000000`0015ca60 000007fe`ff9e2152 USP10!ShapingLibraryInternal::RestoreCharMap+0x12

00000000`0015cab0 000007fe`ff9d80b8 USP10!GenericEngineGetGlyphPositions+0x2a2

00000000`0015ce60 000007fe`ff9d548e USP10!ShapingGetGlyphPositions+0x8c8

00000000`0015d030 000007fe`ff998c72 USP10!ShlPlace+0x2de

00000000`0015d1e0 000007fe`ff9a742d USP10!ScriptPlace+0x1f2

00000000`0015d270 000007fe`ff9a8ac9 USP10!RenderItemNoFallback+0x4fd

00000000`0015d330 000007fe`ff9a8d86 USP10!RenderItemWithFallback+0x129

00000000`0015d380 000007fe`ff9aa5f7 USP10!RenderItem+0x36

00000000`0015d3d0 000007fe`ff99b2c9 USP10!ScriptStringAnalyzeGlyphs+0x277

00000000`0015d470 000007fe`ff30285c USP10!ScriptStringAnalyse+0x399

00000000`0015d4f0 000007fe`ff3031c1 LPK!EditStringAnalyse+0x1d4

00000000`0015d5d0 000007fe`fc876c05 LPK!EditCchInWidth+0x4e

00000000`0015d630 000007fe`fc85862e COMCTL32!EditML_BuildchLines+0x221

00000000`0015d700 000007fe`fc878f56 COMCTL32!Edit_ResetTextInfo+0x82

00000000`0015d740 000007fe`fc85a566 COMCTL32!EditML_WndProc+0x456

00000000`0015d830 00000000`77a19bd1 COMCTL32!Edit_WndProc+0xe0a

00000000`0015d8d0 00000000`77a16aa8 USER32!UserCallWinProcCheckWow+0x1ad

00000000`0015d990 00000000`77a16bad USER32!SendMessageWorker+0x682

00000000`0015da20 00000000`ff7f4256 USER32!SendMessageW+0x5c

00000000`0015da70 00000000`ff7f43d6 NOTEPAD!LoadFile+0×7cb

00000000`0015ddc0 00000000`ff7f1018 NOTEPAD!NPInit+0×802

00000000`0015f710 00000000`ff7f133c NOTEPAD!WinMain+0xc7

00000000`0015f790 00000000`7764652d NOTEPAD!DisplayNonGenuineDlgWorker+0×2da

00000000`0015f850 00000000`77b2c521 kernel32!BaseThreadInitThunk+0xd

00000000`0015f880 00000000`00000000 ntdll!RtlUserThreadStart+0×1d
This thread is also spiking and all work was done in a Unicode script processor as the PDF file was obviously not an ASCII text file:
0:000> !runaway f

User Mode Time

Thread       Time

0:fa0       0 days 0:00:12.402

Kernel Mode Time

Thread       Time

0:fa0       0 days 0:00:10.826

Elapsed Time

Thread       Time

0:fa0       0 days 0:00:34.654
0:000> lmv m USP10

start             end                 module name

000007fe`ff990000 000007fe`ffa59000   USP10      (pdb symbols)          c:\mss\usp10.pdb\DB4EC1196F91457FBB0A462D9D0AFEC31\usp10.pdb

Loaded symbol image file: C:\Windows\system32\USP10.dll

Image path: C:\Windows\system32\USP10.dll

Image name: USP10.dll

Timestamp:        Sat Nov 20 13:15:33 2010 (4CE7C9F5)

CheckSum:         000C4B61

ImageSize:        000C9000

File version:     1.626.7601.17514

Product version:  1.626.7601.17514

File flags:       0 (Mask 3F)

File OS:          40004 NT Win32

File type:        2.0 Dll

File date:        00000000.00000000

Translations:     0409.04b0

CompanyName:      Microsoft Corporation

ProductName:      Microsoft(R) Uniscribe Unicode script processor

InternalName:     Uniscribe

OriginalFilename: Uniscribe

ProductVersion:   1.0626.7601.17514

FileVersion:      1.0626.7601.17514 (win7sp1_rtm.101119-1850)

FileDescription:  Uniscribe Unicode script processor

LegalCopyright:   © Microsoft Corporation. All rights reserved.
We see LoadFile function and find a file name from execution residue on the raw stack:
0:000> dpu 00000000`0015da70

00000000`0015da70  00000000`00000000

00000000`0015da78  00000000`00000000

00000000`0015da80  00000000`00000000

00000000`0015da88  00000000`00000000

00000000`0015da90  00000000`02b40040 "%PDF-1.4..%µµµµ..1 0 obj..<</Type/Catalog/Pages 2 0 R/L"

00000000`0015da98  00000000`00576a62

00000000`0015daa0  00000000`00000000

00000000`0015daa8  00000000`00000000

00000000`0015dab0  00000000`025c0000

00000000`0015dab8  00000000`00000000

00000000`0015dac0  00000000`00000000

00000000`0015dac8  00000000`00000100

00000000`0015dad0  00000000`00000000

00000000`0015dad8  00000000`025c0000

00000000`0015dae0  00000000`00000265

00000000`0015dae8  00000000`ff800b40 "C:\DL\History-Russian-Literature-VIII-Volume2.pdf"

[...]
- Dmitry Vostokov @ DumpAnalysis.org + TraceAnalysis.org -
This is a variant of Handled Exception pattern in kernel space (similar to user and managed spaces). The crash dump was the same as in Hidden Exception in kernel space pattern:
fffff880`0a83d910  00000000`00000000

fffff880`0a83d918  fffff6fc`40054fd8

fffff880`0a83d920  fffff880`0a83dca0

fffff880`0a83d928  fffff800`016bcc1c nt!_C_specific_handler+0xcc

fffff880`0a83d930  00000000`00000000

fffff880`0a83d938  00000000`00000000

fffff880`0a83d940  00000000`00000000

fffff880`0a83d948  00000000`00000000

fffff880`0a83d950  fffff800`0189ee38 nt!BBTBuffer <PERF> (nt+0x280e38)

fffff880`0a83d958  fffff880`0a83e940

fffff880`0a83d960  fffff800`016ad767 nt!IopCompleteRequest+0x147

fffff880`0a83d968  fffff880`0a83de40

fffff880`0a83d970  fffff800`01665e40 nt!_GSHandlerCheck_SEH

fffff880`0a83d978  fffff800`017e5338 nt!_imp_NtOpenSymbolicLinkObject+0xfe30

fffff880`0a83d980  fffff880`0a83e310

fffff880`0a83d988  00000000`00000000

fffff880`0a83d990  00000000`00000000

fffff880`0a83d998  fffff800`016b42dd nt!RtlpExecuteHandlerForException+0xd

fffff880`0a83d9a0  fffff800`017d7d0c nt!_imp_NtOpenSymbolicLinkObject+0×2804

fffff880`0a83d9a8  fffff880`0a83eab0

fffff880`0a83d9b0  00000000`00000000
0: kd> ub fffff800`016b42dd

nt!RtlpExceptionHandler+0x24:

fffff800`016b42c4 cc              int     3

fffff800`016b42c5 cc              int     3

fffff800`016b42c6 cc              int     3

fffff800`016b42c7 cc              int     3

fffff800`016b42c8 0f1f840000000000 nop     dword ptr [rax+rax]

nt!RtlpExecuteHandlerForException:

fffff800`016b42d0 4883ec28        sub     rsp,28h

fffff800`016b42d4 4c894c2420      mov     qword ptr [rsp+20h],r9

fffff800`016b42d9 41ff5130        call    qword ptr [r9+30h]
- Dmitry Vostokov @ DumpAnalysis.org + TraceAnalysis.org -
This is an example of Hidden Exception pattern in kernel space:
0: kd> !thread

THREAD fffffa800d4bf9c0  Cid 0e88.56e0  Teb: 000007fffffd8000 Win32Thread: 0000000000000000 RUNNING on processor 0

Not impersonating

DeviceMap                 fffff8a001e91950

Owning Process            fffffa800b33cb30       Image:         svchost.exe

Attached Process          N/A            Image:         N/A

Wait Start TickCount      13154529       Ticks: 0

Context Switch Count      1426

UserTime                  00:00:00.015

KernelTime                00:00:00.124

Win32 Start Address 0x0000000077728d20

Stack Init fffff8800a83fdb0 Current fffff8800a83eb90

Base fffff8800a840000 Limit fffff8800a83a000 Call 0

Priority 10 BasePriority 10 UnusualBoost 0 ForegroundBoost 0 IoPriority 2 PagePriority 5

[…]
0: kd> dps fffff8800a83a000 fffff8800a840000

[...]

fffff880`0a83e180  fffff880`0a83ea10

fffff880`0a83e188  fffff880`0a83e6d0

fffff880`0a83e190  fffff880`0a83e968

fffff880`0a83e198  fffff800`016c88cf nt!KiDispatchException+0×16f

fffff880`0a83e1a0  fffff880`0a83e968

fffff880`0a83e1a8  fffff880`0a83e1d0

fffff880`0a83e1b0  fffff880`00000000

fffff880`0a83e1b8  00000000`00000000

fffff880`0a83e1c0  00000000`00000000

fffff880`0a83e1c8  00000000`00000000

[…]
0: kd> .cxr fffff880`0a83e1d0

rax=0000000000000009 rbx=fffffa800d4c1de0 rcx=0000000000000000

rdx=fffff8800a83ece0 rsi=0000000000000000 rdi=0000000000000000

rip=fffff800016ad74f rsp=fffff8800a83eba0 rbp=00000000a000000c

r8=fffff8800a83ecd8  r9=fffff8800a83ecc0 r10=0000000000000000

r11=fffff8800a83ed58 r12=0000000000000000 r13=0000000000000000

r14=fffffa800d4bf9c0 r15=fffffa800d4c1ea0

iopl=0  nv up ei pl zr na po nc

cs=0010  ss=0018  ds=002b  es=002b  fs=0053  gs=002b  efl=00010246

nt!IopCompleteRequest+0x12f:

fffff800`016ad74f 48894108 mov qword ptr [rcx+8],rax ds:002b:00000000`00000008=????????????????
- Dmitry Vostokov @ DumpAnalysis.org + TraceAnalysis.org -
This is a collage image based on colors and layout of Software Diagnostics Services training course logos such as Accelerated and Advanced Windows Memory Dump Analysis plus 8, 16, 32, and 64 pt Consolas font sizes symbolizing different memory pointer sizes. Colors symbolize kernel, user, managed and physical memory spaces.

- Dmitry Vostokov @ DumpAnalysis.org + TraceAnalysis.org -
This book I bought more than 5 years ago after I recognized that systems approach was needed for memory dump analysis. However, I read it only recently while preparing to talk on systemic software diagnostics. While reading I realized that I already applied some systems theory ideas, for example, about isomorphism of disciplines as systems (which I named as metaphorical bijection): from literary narratology to software narratology and from that to network trace analysis. So if you are interested in systems either computer software ones or human organizational then I would greatly recommend this book as an introduction. The recommended literature in exercises is also useful.
An Introduction to General Systems Thinking (Silver Anniversary Edition)
- Dmitry Vostokov @ LiterateScientist.com -
Bought this book in Russian translation and quickly read from cover to cover. Very lively introduction without any utopian suggestions to change the world like in another introduction I read previously: Marx and the Alternative to Capitalism. A few funny cartoons like an employee who fires himself to save his company. Recommended to read before more cryptic The Philosophy of Marx
- Dmitry Vostokov @ LiterateScientist.com -
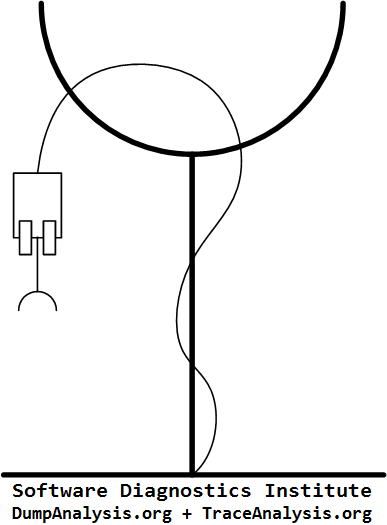
Software Diagnostics Institute main page now features the brand new medical-style logo with UML 2 components and interface sinks:
- Dmitry Vostokov @ DumpAnalysis.org + TraceAnalysis.org -
A lively autobiography of Paul Feyerabend that shows human side on every page and prompts a reader to think about life and love after turning the last page in contrast to much more formal autobiography of Saunders Mac Lane
Killing Time: The Autobiography of Paul Feyerabend
- Dmitry Vostokov @ LiterateScientist.com -
This is the first pattern that emerged after applying the same pattern-driven software diagnostics methodology to Mac OS X. I had problems using GDB which is so portable that hardly has operating system support like WinDbg has. Fortunately, I found a workaround by complementing core dumps with logs and reports from OS such as crash reports and vmmap data. I call this pattern Paratext which I borrowed from the concept of an extended software trace and software narratology where it borrowed the same concept from literary interpretation (paratext). Typical examples of such pattern usage can be the list of modules with version and path info, application crash specific information, memory region names with attribution and boundaries:
// from .crash reports
0x108f99000 - 0x109044ff7 com.apple.FontBook (198.4 - 198) <7244D36E-4563-3E42-BA46-1F279D30A6CE> /Applications/Font Book.app/Contents/MacOS/Font Book
Exception Type:  EXC_BAD_INSTRUCTION (SIGILL)

Exception Codes: 0x0000000000000001, 0x0000000000000000
Application Specific Information:

objc[195]: garbage collection is OFF

*** error for object 0x7fd7fb818e08: incorrect checksum for freed object - object was probably modified after being freed.
// from vmmap logs
[...]

==== Writable regions for process 966

[...]

Stack                  0000000101f71000-0000000101ff3000 [  520K] rw-/rwx SM=PRV  thread 1

MALLOC_LARGE           0000000103998000-00000001039b8000 [  128K] rw-/rwx SM=PRV  DefaultMallocZone_0x101e6e000

MALLOC_SMALL (freed)   00000001039b9000-00000001039bb000 [    8K] rw-/rwx SM=PRV

mapped file            0000000103a05000-0000000103f32000 [ 5300K] rw-/rwx SM=COW  ...box.framework/Versions/A/Resources/Extras2.rsrc

mapped file            0000000104409000-00000001046d2000 [ 2852K] rw-/rwx SM=COW  /System/Library/Fonts/Helvetica.dfont

MALLOC_LARGE           0000000104f6e000-0000000104f8e000 [  128K] rw-/rwx SM=PRV  DefaultMallocZone_0x101e6e000

MALLOC_LARGE (freed)   0000000108413000-0000000108540000 [ 1204K] rw-/rwx SM=COW

MALLOC_LARGE (freed)   0000000108540000-0000000108541000 [    4K] rw-/rwx SM=PRV

MALLOC_TINY            00007fefe0c00000-00007fefe0d00000 [ 1024K] rw-/rwx SM=COW  DefaultMallocZone_0x101e6e000

MALLOC_TINY            00007fefe0d00000-00007fefe0e00000 [ 1024K] rw-/rwx SM=PRV  DispatchContinuations_0x101f38000

MALLOC_TINY            00007fefe0e00000-00007fefe0f00000 [ 1024K] rw-/rwx SM=COW  DefaultMallocZone_0x101e6e000

MALLOC_SMALL           00007fefe1000000-00007fefe107b000 [  492K] rw-/rwx SM=ZER  DefaultMallocZone_0x101e6e000

MALLOC_SMALL           00007fefe107b000-00007fefe1083000 [   32K] rw-/rwx SM=PRV  DefaultMallocZone_0x101e6e000

MALLOC_SMALL           00007fefe1083000-00007fefe1149000 [  792K] rw-/rwx SM=ZER  DefaultMallocZone_0x101e6e000

MALLOC_SMALL (freed)   00007fefe1149000-00007fefe1166000 [  116K] rw-/rwx SM=PRV  DefaultMallocZone_0x101e6e000

MALLOC_SMALL (freed)   00007fefe1166000-00007fefe1800000 [ 6760K] rw-/rwx SM=ZER  DefaultMallocZone_0x101e6e000

MALLOC_SMALL           00007fefe1800000-00007fefe18ff000 [ 1020K] rw-/rwx SM=ZER  DefaultMallocZone_0x101e6e000

MALLOC_SMALL (freed)   00007fefe18ff000-00007fefe1901000 [    8K] rw-/rwx SM=PRV  DefaultMallocZone_0x101e6e000

MALLOC_SMALL           00007fefe1901000-00007fefe2000000 [ 7164K] rw-/rwx SM=ZER  DefaultMallocZone_0x101e6e000

MALLOC_TINY (freed)    00007fefe2000000-00007fefe2100000 [ 1024K] rw-/rwx SM=PRV  DispatchContinuations_0x101f38000

MALLOC_TINY            00007fefe2100000-00007fefe2200000 [ 1024K] rw-/rwx SM=PRV  DefaultMallocZone_0x101e6e000

Stack                  00007fff61186000-00007fff61985000 [ 8188K] rw-/rwx SM=ZER  thread 0

Stack                  00007fff61985000-00007fff61986000 [    4K] rw-/rwx SM=COW

[...]
- Dmitry Vostokov @ DumpAnalysis.org + TraceAnalysis.org -
Forthcoming Training: Accelerated Mac OS X Core Dump Analysis
This is a Mac OS X / GDB counterpart to Truncated Dump pattern previously described for Windows platforms:
(gdb) info threads

Cannot access memory at address 0x7fff885e9e42

4 0x00007fff885e9e42 in ?? ()

3 0x00007fff885e9e42 in ?? ()

2 0x00007fff885e9e42 in ?? ()

* 1 0x00007fff885e9e42 in ?? ()

warning: Couldn't restore frame in current thread, at frame 0

0x00007fff885e9e42 in ?? ()
(gdb) disass 0x00007fff885e9e42

No function contains specified address.
(gdb) info r rsp

rsp            0x7fff67fe8a18	0x7fff67fe8a18
(gdb) x/100a  0x7fff67fe8a18

0x7fff67fe8a18:	Cannot access memory at address 0x7fff67fe8a18
This often happens if there is no space to save a full core dump.
- Dmitry Vostokov @ DumpAnalysis.org + TraceAnalysis.org -
Forthcoming Training: Accelerated Mac OS X Core Dump Analysis
This is a Mac OS X / GDB counterpart to C++ Exception pattern previously described for Windows platforms:
(gdb) bt

#0  0x00007fff88bd582a in __kill ()

#1  0x00007fff8c184a9c in abort ()

#2  0x00007fff852f57bc in abort_message ()

#3  0x00007fff852f2fcf in default_terminate ()

#4  0x00007fff852f3001 in safe_handler_caller ()

#5  0x00007fff852f305c in std::terminate ()

#6  0×00007fff852f4152 in __cxa_throw ()

#7  0×000000010e402be8 in bar ()

#8  0×000000010e402c99 in foo ()

#9  0×000000010e402cbb in main (argc=1, argv=0×7fff6e001b18)
The modeling application source code:
class Exception
{
int code;
std::string description;
public:
Exception(int _code, std::string _desc) : code(_code), description(_desc) {}
};
void bar()
{
throw new Exception(5, “Access Denied”);
}
void foo()
{
bar();
}
int main(int argc, const char * argv[])
{
foo();
return 0;
}
- Dmitry Vostokov @ DumpAnalysis.org + TraceAnalysis.org -
Forthcoming Training: Accelerated Mac OS X Core Dump Analysis
This is a Mac OS X / GDB counterpart to Local Buffer Overflow pattern previously described for Windows platforms. Most of the time simple mistakes in using memory and string manipulation functions are easily detected by runtime:
(gdb) bt

#0  0x00007fff885e982a in __kill ()

#1  0x00007fff83288b6c in __abort ()

#2  0×00007fff8325a89f in __chk_fail ()

#3  0×00007fff8325a83e in __memcpy_chk ()

#4  0×000000010914edf3 in bar ()

#5  0×000000010914ee5e in foo ()

#6  0×000000010914ee9b in main (argc=1, argv=0×7fff68d4daf0)
This detection happens in a default optimized release version as well:
(gdb) bt
#0 0x00007fff885e982a in __kill ()
#1 0x00007fff83288b6c in __abort ()
#2 0×00007fff8325a89f in __chk_fail ()
#3 0×00007fff8325a83e in __memcpy_chk ()
#4 0×000000010f59cea8 in bar [inlined] ()
#5 0×000000010f59cea8 in foo [inlined] ()
#6 0×000000010f59cea8 in main (argc=
argv=
The more sophisticated example which overwrites stack trace without being detected involves overwriting indirectly via a pointer to a local buffer passed to the called function. In such cases we might see incorrect and truncated stack traces:
(gdb) bt

#0  0x00007fff885e982a in __kill ()

#1  0x00007fff83288b6c in __abort ()

#2  0×00007fff83285070 in __stack_chk_fail ()

#3  0×000000010524de77 in foo ()

#4  0xca4000007fff64e5 in ?? ()
(gdb) bt

#0  0x00007fff885e982a in __kill ()

#1  0x00007fff83288b6c in __abort ()

#2  0×00007fff83285070 in __stack_chk_fail ()

#3  0×0000000105ad8df7 in foo ()
Inspection of the raw stack shows ASCII-like memory values around foo symbolic reference instead of expected main and start functions:
(gdb) info r rsp

rsp            0x7fff656d79d8	0x7fff656d79d8
(gdb) x/100a 0x7fff656d79d8
0x7fff656d79d8: 0x7fff83288b6c <__abort+193> 0x0
0x7fff656d79e8: 0x0 0xffffffdf
0x7fff656d79f8: 0x7fff656d7a40 0x7fff656d7a80
0x7fff656d7a08: 0x7fff83285070 <__guard_setup> 0x6675426c61636f4c
0x7fff656d7a18: 0x7265764f726566 0x0
0x7fff656d7a28: 0x0 0x0
0x7fff656d7a38: 0x0 0x73205d343336325b
0x7fff656d7a48: 0x65766f206b636174 0x776f6c6672
0x7fff656d7a58: 0x0 0x0
0x7fff656d7a68: 0x0 0x343336326d7ab0
0x7fff656d7a78: 0x0 0x7fff656d7ab0
0x7fff656d7a88: 0x105ad8df7
0×7fff656d7a98: 0×794d000000000000 0×6769422077654e20
0×7fff656d7aa8: 0×6666754220726567 0×7265
0×7fff656d7ab8: 0×0 0×0
0×7fff656d7ac8: 0×0 0×0
0×7fff656d7ad8: 0×0 0×0
0×7fff656d7ae8: 0×0 0×0
[…]
The modeling application source code:
void bar(char *buffer)
{
char data[100] = “My New Bigger Buffer”;
memcpy (buffer, data, sizeof(data));
}
void foo()
{
char data[10] = “My Buffer”;
bar(data);
}
int main(int argc, const char * argv[])
{
foo();
return 0;
}
- Dmitry Vostokov @ DumpAnalysis.org + TraceAnalysis.org -
Forthcoming Training: Accelerated Mac OS X Core Dump Analysis