User Interface Problem Analysis Patterns (Part 1)

Forthcoming Webinar on Pattern-Driven Software Diagnostics

2012 - The Year of Software Trace Analysis

Accelerated Memory Dump Analysis Training

Sponsored link: Memory Dump Analysis Services

Debugging Experts Magazine Online

Debugging Today Daily Newspaper

Debugging TV

As a part of unified debugging pattern and generative debugging approach we extend software behavior analysis patterns such as memory dump and software trace analysis with UI abnormal behaviour patterns. Here by abnormality we mean behavior that users should not encounter while using software. Typical example is some error message or GUI distortion during execution of a functional use case. Such patterns will extend software behavior analysis pattern language we use for description of various post-construction software problems.

The first pattern we start with is called Error Message Box and we link it to Message Box and Self-Diagnosis memory analysis patterns. You can download x86 and x64 modeling examples from this location:

UIPMessageBox.zip

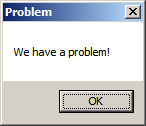
When we start the application it shows a message box:

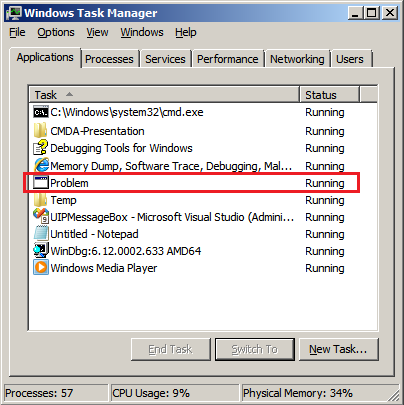
We then launch Task Manager and find the window:

Then we save a crash dump using right-click context menu:

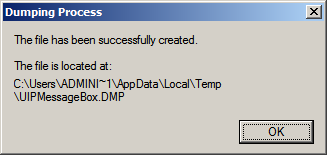
When we open the process memory dump we see this stack trace:

0:000> ~*kL

.  0  Id: d30.71c Suspend: 0 Teb: 000007ff`fffdd000 Unfrozen
Child-SP          RetAddr           Call Site
00000000`002ff1e8 00000000`77837214 user32!ZwUserWaitMessage+0xa
00000000`002ff1f0 00000000`778374a5 user32!DialogBox2+0x274
00000000`002ff280 00000000`778827f0 user32!InternalDialogBox+0x135
00000000`002ff2e0 00000000`77881ae5 user32!SoftModalMessageBox+0x9b4
00000000`002ff410 00000000`7788133b user32!MessageBoxWorker+0x31d
00000000`002ff5d0 00000000`77881232 user32!MessageBoxTimeoutW+0xb3
00000000`002ff6a0 00000001`3ffa101d user32!MessageBoxW+0×4e
00000000`002ff6e0 00000001`3ffa1039 UIPMessageBox!bar+0×1d
00000000`002ff710 00000001`3ffa1052 UIPMessageBox!foo+0×9
00000000`002ff740 00000001`3ffa11ea UIPMessageBox!wmain+0×12
00000000`002ff770 00000000`7770f56d UIPMessageBox!__tmainCRTStartup+0×15a
00000000`002ff7b0 00000000`77942cc1 kernel32!BaseThreadInitThunk+0xd
00000000`002ff7e0 00000000`00000000 ntdll!RtlUserThreadStart+0×1d

We see there that foo function called bar function which displayed the message box. In real scenarios function name could me more meaningful and give a clue for troubleshooting and debugging in addition to message text:

0:000> ub 00000001`3ffa101d
UIPMessageBox!__unguarded_readlc_active+0xfff:
00000001`3ffa0fff add     byte ptr [rax-7Dh],cl
00000001`3ffa1002 in      al,dx
00000001`3ffa1003 sub     byte ptr [rbp+33h],al
00000001`3ffa1006 leave
00000001`3ffa1007 lea     r8,[UIPMessageBox!__mnames+0×28 (00000001`3ffa83c8)]
00000001`3ffa100e lea     rdx,[UIPMessageBox!__mnames+0×38 (00000001`3ffa83d8)]
00000001`3ffa1015 xor     ecx,ecx
00000001`3ffa1017 call    qword ptr [UIPMessageBox!_imp_MessageBoxW (00000001`3ffa71d8)]

0:000> du 00000001`3ffa83c8
00000001`3ffa83c8  “Problem”

0:000> du 00000001`3ffa83d8
00000001`3ffa83d8  “We have a problem!”

- Dmitry Vostokov @ DumpAnalysis.org + TraceAnalysis.org -

Sponsored link: Professional Software Debugging Services

/* Malware and Software Defects -> Victimware.org */

Copyright © 2006 - 2012. This is a non-profit research and scientific project.


Citrix and Microsoft Customer Forum

Museum of Debugging and Memory Dumps

7/7/2011 - 8/8/2011 Annual Competition: Tell Your Windows Debugging Story

Crash and Hang Analysis Audit Service

CARE: Crash Analysis Report Environment

Crash Dump and Software Trace Analysis Training and Seminars

Access OpenTask Titles on Safari Books Online

DATA (Dump Analysis + Trace Analysis) Facebook group
Please join the community of memory (dump) and trace analysis engineers. This group promotes scientific methods and memory dump-based worldview.

Twitter @ DumpAnalysis
You can now follow portal and blog news at DumpAnalysis on Twitter

LinkedIn Group Dr. Watson Enthusiasts
All about Dr. Watson errors and more. Get news, excerpts and progress reports about the forthcoming book The Science of Dr. Watson: An Illustrated History of Debugging (ISBN 978-1906717070)

2010 (0x7DA) - The Year of Dump Analysis
2011 (0x7DB) - 2020 (0x7E4) The Debugging Decade

International Memory Analysts and Debuggers Day:
07.07 and/or 08.08 starting from The Year of Dump Analysis, 2010, 7DA

Announcements

Coming Soon:

Resume and CV: As a Book

Fundamentals of Complete Crash and Hang Memory Dump Analysis

Management Bits: An Anthology from Reductionist Manager

Crash Dump Analysis: Practical Foundations (Windows Edition, Systematic Software Fault Analysis Series)

Crash Dump Analysis for System Administrators and Support Engineers

New Magazines:

Debugged! MZ/PE: MagaZine for/from Practicing Engineers


New Books:

Advanced Windows Memory Dump Analysis with Data Structures: Training Course Transcript and WinDbg Practice Exercises with Notes

Accelerated .NET Memory Dump Analysis: Training Course Transcript and WinDbg Practice Exercises with Notes

Accelerated Windows Memory Dump Analysis: Training Course Transcript and WinDbg Practice Exercises with Notes

Introduction to Pattern-Driven Software Problem Solving

Memory Dump Analysis Anthology: Color Supplement for Volumes 4-5

Windows Debugging Notebook: Essential User Space WinDbg Commands

Memory Dump Analysis Anthology, Volume 5

Memory Dump Analysis Anthology, Volume 4

Memory Dump Analysis Anthology: Color Supplement for Volumes 1-3

Memory Dump Analysis Anthology, Volume 3

First Fault Software Problem Solving: A Guide for Engineers, Managers and Users

x64 Windows Debugging: Practical Foundations

Also available:

Windows Debugging: Practical Foundations

DLL List Landscape: The Art from Computer Memory Space

Dumps, Bugs and Debugging Forensics: The Adventures of Dr. Debugalov

WinDbg: A Reference Poster and Learning Cards

Memory Dump Analysis Anthology, Volume 2

Memory Dump Analysis Anthology, Volume 1

New Children's Book:

Baby Turing

Leave a Reply