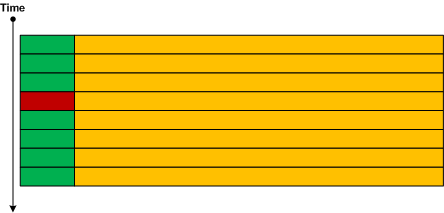
When looking at the module list (lmv), searching for modules (.imgscan) or examining the particular module (!address, !dh) we may notice one of them as Deviant Module. The deviation may be in (but not limited to as anything is possible):
- suspicious module name
- suspicious protection
- suspicious module load address
0:005> .imgscan

MZ at 00040000, prot 00000040, type 00020000 - size 1d000

MZ at 00340000, prot 00000002, type 01000000 - size 9c000

Name: iexplore.exe

MZ at 02250000, prot 00000002, type 00040000 - size 2000

MZ at 023b0000, prot 00000002, type 01000000 - size b000

Name: msimtf.dll

MZ at 03f80000, prot 00000002, type 00040000 - size 2000

MZ at 10000000, prot 00000004, type 00020000 - size 5000

Name: screens_dll.dll

MZ at 16080000, prot 00000002, type 01000000 - size 25000

Name: mdnsNSP.dll

MZ at 6ab50000, prot 00000002, type 01000000 - size 26000

Name: DSSENH.dll

MZ at 6b030000, prot 00000002, type 01000000 - size 5b0000

Name: MSHTML.dll

MZ at 6ba10000, prot 00000002, type 01000000 - size b4000

Name: JSCRIPT.dll

MZ at 6cec0000, prot 00000002, type 01000000 - size 1b000

Name: CRYPTNET.dll

MZ at 6d260000, prot 00000002, type 01000000 - size e000

Name: PNGFILTER.DLL

MZ at 6d2f0000, prot 00000002, type 01000000 - size 29000

Name: msls31.dll

MZ at 6d700000, prot 00000002, type 01000000 - size 30000

Name: MLANG.dll

MZ at 6d740000, prot 00000002, type 01000000 - size 4d000

Name: SSV.DLL

MZ at 6d7b0000, prot 00000002, type 01000000 - size c000

Name: ImgUtil.dll

MZ at 6ddb0000, prot 00000002, type 01000000 - size 2f000

Name: iepeers.DLL

MZ at 6df20000, prot 00000002, type 01000000 - size 33000

Name: IEShims.dll

MZ at 6eb80000, prot 00000002, type 01000000 - size a94000

Name: IEFRAME.dll

MZ at 703b0000, prot 00000002, type 01000000 - size 53000

Name: SWEEPRX.dll

MZ at 70740000, prot 00000002, type 01000000 - size 40000

Name: SWEEPRX.dll

MZ at 725a0000, prot 00000002, type 01000000 - size 12000

Name: PNRPNSP.dll

MZ at 725d0000, prot 00000002, type 01000000 - size 8000

Name: WINRNR.dll

MZ at 725e0000, prot 00000002, type 01000000 - size 136000

Name: MSXML3.dll

MZ at 72720000, prot 00000002, type 01000000 - size c000

Name: wshbth.dll

MZ at 72730000, prot 00000002, type 01000000 - size f000

Name: NAPINSP.dll

MZ at 72890000, prot 00000002, type 01000000 - size 6000

Name: SensApi.dll

MZ at 72ec0000, prot 00000002, type 01000000 - size 42000

Name: WINSPOOL.DRV

MZ at 734b0000, prot 00000002, type 01000000 - size 6000

Name: rasadhlp.dll

MZ at 736b0000, prot 00000002, type 01000000 - size 85000

Name: COMCTL32.dll

MZ at 73ac0000, prot 00000002, type 01000000 - size 7000

Name: MIDIMAP.dll

MZ at 73ae0000, prot 00000002, type 01000000 - size 14000

Name: MSACM32.dll

MZ at 73b00000, prot 00000002, type 01000000 - size 66000

Name: audioeng.dll

MZ at 73c30000, prot 00000002, type 01000000 - size 9000

Name: MSACM32.DRV

MZ at 73c60000, prot 00000002, type 01000000 - size 21000

Name: AudioSes.DLL

MZ at 73c90000, prot 00000002, type 01000000 - size 2f000

Name: WINMMDRV.dll

MZ at 74290000, prot 00000002, type 01000000 - size bb000

Name: PROPSYS.dll

MZ at 74390000, prot 00000002, type 01000000 - size f000

Name: nlaapi.dll

MZ at 743a0000, prot 00000002, type 01000000 - size 4000

Name: ksuser.dll

MZ at 74430000, prot 00000002, type 01000000 - size 15000

Name: Cabinet.dll

MZ at 74450000, prot 00000002, type 01000000 - size 3d000

Name: OLEACC.dll

MZ at 74490000, prot 00000002, type 01000000 - size 1ab000

Name: gdiplus.dll

MZ at 74640000, prot 00000002, type 01000000 - size 28000

Name: MMDevAPI.DLL

MZ at 74670000, prot 00000002, type 01000000 - size 32000

Name: WINMM.dll

MZ at 746b0000, prot 00000002, type 01000000 - size 31000

Name: TAPI32.dll

MZ at 749e0000, prot 00000002, type 01000000 - size 19e000

Name: COMCTL32.dll

MZ at 74b80000, prot 00000002, type 01000000 - size 7000

Name: AVRT.dll

MZ at 74ba0000, prot 00000002, type 01000000 - size 4a000

Name: RASAPI32.dll

MZ at 74ce0000, prot 00000002, type 01000000 - size 3f000

Name: UxTheme.dll

MZ at 74de0000, prot 00000002, type 01000000 - size 2d000

Name: WINTRUST.dll

MZ at 74ea0000, prot 00000002, type 01000000 - size 14000

Name: rasman.dll

MZ at 74f70000, prot 00000002, type 01000000 - size c000

Name: rtutils.dll

MZ at 74f80000, prot 00000002, type 01000000 - size 5000

Name: WSHTCPIP.dll

MZ at 74fb0000, prot 00000002, type 01000000 - size 21000

Name: NTMARTA.dll

MZ at 75010000, prot 00000002, type 01000000 - size 3b000

Name: RSAENH.dll

MZ at 75050000, prot 00000002, type 01000000 - size 5000

Name: MSIMG32.dll

MZ at 75060000, prot 00000002, type 01000000 - size 15000

Name: GPAPI.dll

MZ at 750a0000, prot 00000002, type 01000000 - size 46000

Name: SCHANNEL.dll

MZ at 752b0000, prot 00000002, type 01000000 - size 3b000

Name: MSWSOCK.dll

MZ at 75370000, prot 00000002, type 01000000 - size 45000

Name: bcrypt.dll

MZ at 753f0000, prot 00000002, type 01000000 - size 5000

Name: WSHIP6.dll

MZ at 75400000, prot 00000002, type 01000000 - size 8000

Name: VERSION.dll

MZ at 75420000, prot 00000002, type 01000000 - size 7000

Name: CREDSSP.dll

MZ at 75430000, prot 00000002, type 01000000 - size 35000

Name: ncrypt.dll

MZ at 75480000, prot 00000002, type 01000000 - size 22000

Name: dhcpcsvc6.DLL

MZ at 754b0000, prot 00000002, type 01000000 - size 7000

Name: WINNSI.DLL

MZ at 754c0000, prot 00000002, type 01000000 - size 35000

Name: dhcpcsvc.DLL

MZ at 75500000, prot 00000002, type 01000000 - size 19000

Name: IPHLPAPI.DLL

MZ at 75590000, prot 00000002, type 01000000 - size 3a000

Name: slc.dll

MZ at 755d0000, prot 00000002, type 01000000 - size f2000

Name: CRYPT32.dll

MZ at 75740000, prot 00000002, type 01000000 - size 12000

Name: MSASN1.dll

MZ at 75760000, prot 00000002, type 01000000 - size 11000

Name: SAMLIB.dll

MZ at 75780000, prot 00000002, type 01000000 - size 76000

Name: NETAPI32.dll

MZ at 75800000, prot 00000002, type 01000000 - size 2c000

Name: DNSAPI.dll

MZ at 75a70000, prot 00000002, type 01000000 - size 5f000

Name: sxs.dll

MZ at 75ad0000, prot 00000002, type 01000000 - size 2c000

Name: apphelp.dll

MZ at 75b30000, prot 00000002, type 01000000 - size 14000

Name: Secur32.dll

MZ at 75b50000, prot 00000002, type 01000000 - size 1e000

Name: USERENV.dll

MZ at 75c90000, prot 00000002, type 01000000 - size 7000

Name: PSAPI.DLL

MZ at 75ca0000, prot 00000002, type 01000000 - size c3000

Name: RPCRT4.dll

MZ at 75d70000, prot 00000002, type 01000000 - size 73000

Name: COMDLG32.dll

MZ at 75df0000, prot 00000002, type 01000000 - size 9000

Name: LPK.dll

MZ at 75e00000, prot 00000002, type 01000000 - size dc000

Name: KERNEL32.dll

MZ at 75ee0000, prot 00000002, type 01000000 - size aa000

Name: msvcrt.dll

MZ at 75f90000, prot 00000002, type 01000000 - size 1e8000

Name: iertutil.dll

MZ at 76180000, prot 00000002, type 01000000 - size 29000

Name: imagehlp.dll

MZ at 761b0000, prot 00000002, type 01000000 - size 6000

Name: NSI.dll

MZ at 761c0000, prot 00000002, type 01000000 - size 84000

Name: CLBCatQ.DLL

MZ at 76250000, prot 00000002, type 01000000 - size 49000

Name: WLDAP32.dll

MZ at 762a0000, prot 00000002, type 01000000 - size c6000

Name: ADVAPI32.dll

MZ at 76370000, prot 00000002, type 01000000 - size 4b000

Name: GDI32.dll

MZ at 763c0000, prot 00000002, type 01000000 - size 59000

Name: SHLWAPI.dll

MZ at 76420000, prot 00000002, type 01000000 - size e6000

Name: WININET.dll

MZ at 76510000, prot 00000002, type 01000000 - size b10000

Name: SHELL32.dll

MZ at 77020000, prot 00000002, type 01000000 - size 145000

Name: ole32.dll

MZ at 77170000, prot 00000002, type 01000000 - size 7d000

Name: USP10.dll

MZ at 771f0000, prot 00000002, type 01000000 - size 8d000

Name: OLEAUT32.dll

MZ at 77280000, prot 00000002, type 01000000 - size 18a000

Name: SETUPAPI.dll

MZ at 77410000, prot 00000002, type 01000000 - size 9d000

Name: USER32.dll

MZ at 774b0000, prot 00000002, type 01000000 - size 133000

Name: urlmon.dll

MZ at 775f0000, prot 00000002, type 01000000 - size 127000

Name: ntdll.dll

MZ at 77720000, prot 00000002, type 01000000 - size 3000

Name: Normaliz.dll

MZ at 77730000, prot 00000002, type 01000000 - size 2d000

Name: WS2_32.dll

MZ at 77760000, prot 00000002, type 01000000 - size 1e000

Name: IMM32.dll

MZ at 77780000, prot 00000002, type 01000000 - size c8000

Name: MSCTF.dll

MZ at 7c340000, prot 00000002, type 01000000 - size 56000

Name: MSVCR71.dll
0:005> !address 00040000

Usage:                  <unclassified>

Allocation Base:        00040000

Base Address:           00040000

End Address:            0005d000

Region Size:            0001d000

Type:                   00020000 MEM_PRIVATE

State:                  00001000 MEM_COMMIT

Protect:                00000040 PAGE_EXECUTE_READWRITE
0:005> !address 10000000

Usage:                  <unclassified>

Allocation Base:        10000000

Base Address:           10000000

End Address:            10001000

Region Size:            00001000

Type:                   00020000 MEM_PRIVATE

State:                  00001000 MEM_COMMIT

Protect:                00000004 PAGE_READWRITE
- suspicious text inside
See this case study for an example.
- suspicious import table (screen grabbing) or its absence (dynamic imports)
0:005> !dh 10000000

[...]

2330 [      50] address [size] of Export Directory

20E0 [      78] address [size] of Import Directory

0 [       0] address [size] of Resource Directory

0 [       0] address [size] of Exception Directory

0 [       0] address [size] of Security Directory

4000 [      34] address [size] of Base Relocation Directory

2060 [      1C] address [size] of Debug Directory

0 [       0] address [size] of Description Directory

0 [       0] address [size] of Special Directory

0 [       0] address [size] of Thread Storage Directory

0 [       0] address [size] of Load Configuration Directory

0 [       0] address [size] of Bound Import Directory

2000 [      58] address [size] of Import Address Table Directory

0 [       0] address [size] of Delay Import Directory

0 [       0] address [size] of COR20 Header Directory

0 [       0] address [size] of Reserved Directory

[…]
0:005> dps 10000000+2000 10000000+2000+58

10002000  76376101 gdi32!CreateCompatibleDC

10002004  763793d6 gdi32!StretchBlt

10002008  76377461 gdi32!CreateDIBSection

1000200c  763762a0 gdi32!SelectObject

10002010  00000000

10002014  75e4a411 kernel32!lstrcmpW

10002018  75e440aa kernel32!VirtualFree

1000201c  75e4ad55 kernel32!VirtualAlloc

10002020  00000000

10002024  77429ced user32!ReleaseDC

10002028  77423ba7 user32!NtUserGetWindowDC

1000202c  77430e21 user32!GetWindowRect

10002030  00000000

10002034  744a75e9 GdiPlus!GdiplusStartup

10002038  744976dd GdiPlus!GdipSaveImageToStream

1000203c  744cdd38 GdiPlus!GdipGetImageEncodersSize

10002040  744971cf GdiPlus!GdipDisposeImage

10002044  744a8591 GdiPlus!GdipCreateBitmapFromHBITMAP

10002048  744cdbae GdiPlus!GdipGetImageEncoders

1000204c  00000000

10002050  7707d51b ole32!CreateStreamOnHGlobal

10002054  00000000

10002058  00000000
0:000> !dh 012a0000

[...]

0 [       0] address [size] of Export Directory

0 [       0] address [size] of Import Directory

0 [       0] address [size] of Resource Directory

0 [       0] address [size] of Exception Directory

0 [       0] address [size] of Security Directory

8000 [      FC] address [size] of Base Relocation Directory

4000 [      1C] address [size] of Debug Directory

0 [       0] address [size] of Description Directory

0 [       0] address [size] of Special Directory

0 [       0] address [size] of Thread Storage Directory

0 [       0] address [size] of Load Configuration Directory

0 [       0] address [size] of Bound Import Directory

0 [       0] address [size] of Import Address Table Directory

0 [       0] address [size] of Delay Import Directory

0 [       0] address [size] of COR20 Header Directory

0 [       0] address [size] of Reserved Directory

[…]
- suspicious path names
Age: 7, Pdb: d:\work\BekConnekt\Client_src_code_New\Release\Blackjoe_new.pdb
Debug Directories(1)

Type       Size     Address  Pointer

cv           46        2094      894	Format: RSDS, guid, 1, C:\MyWork\screens_dll\Release\screens_dll.pdb
- suspicious image path (although could be just dynamic code generation for .NET assemblies)
- uninitialized image resources
0:002> lmv m C6DC

start    end        module name

012a0000 012a9000   C6DC     C (no symbols)

Loaded symbol image file: C6DC.tmp

Image path: C:\Users\User\AppData\Local\Temp\C6DC.tmp

Image name: C6DC.tmp

Timestamp:        Sun May 30 20:18:32 2010 (4C02BA08)

CheckSum:         00000000

ImageSize:        00009000

File version:     0.0.0.0

Product version:  0.0.0.0

File flags:       0 (Mask 0)

File OS:          0 Unknown Base

File type:        0.0 Unknown

File date:        00000000.00000000

Translations:     0000.04b0 0000.04e4 0409.04b0 0409.04e4
- suspicious (small) image size
- Dmitry Vostokov @ DumpAnalysis.org + TraceAnalysis.org -
 - Dmitry Vostokov @ DumpAnalysis.org + TraceAnalysis.org -