Trace Analysis Patterns (Part 97)

November 29th, 2014

Some traces and logs may have Periodic Message Blocks with very similar message structure and content (mostly Message Invariants). The only significant difference between them is some unique data. We call such pattern Visitor Trace by analogy with Visitor design pattern where tracing code “visits” each object data or data part to log its content or status.

- Dmitry Vostokov @ DumpAnalysis.org + TraceAnalysis.org -

Trace Analysis Patterns (Part 96)

November 19th, 2014

There are events that by design or system configuration should be seen in a log only once or not seen at all if code responsible for them was executed before tracing session. For example, the launch of certain services during system initialization shouldn’t be seen again when we trace system activity long after that. It can also be just messages from singleton objects in the application log. The appearance of extra Singleton Events may point to design violations or some abnormal system events such as process restart. The latter may Intra-Correlate with the start of the fault handling process such as WerFault.exe in Windows Process Monitor logs (Guest Component).

- Dmitry Vostokov @ DumpAnalysis.org + TraceAnalysis.org -

Crash Dump Analysis Patterns (Part 216)

November 19th, 2014

Sometimes what looks like a memory leak when we install the new product version is not really a leak. With the previous version we had 400 MB typical memory usage but suddenly we get twice as more. We shouldn’t panic but collect a process memory dump to calmly inspect it offline. We may see Dry Weight increase: the size of all module images. For some products the new release may mean complete redesign with a new more powerful framework or incorporation of the significant number of new 3rd-party components (Module Variety). Additional sign against the memory leak hypothesis is simultaneous memory usage increase for many product processes. Although, this may be some shared module with leaking code. For example, in the example below 50% of all committed memory was image memory:

0:000> !address -summary

--- Usage Summary ---------------- RgnCount ----------- Total Size -------- %ofBusy %ofTotal
[...]
Image                                  1806        0`19031000 ( 402.535 Mb)   4.29%    0.00%
Heap                                     72        0`02865000 (  40.395 Mb)   0.44%    0.00%
[…]

--- Type Summary (for busy) ------ RgnCount ----------- Total Size -------- %ofBusy %ofTotal
[...]
MEM_IMAGE                              2281        0`19AA8000 ( 413.000 Mb)   4.40%    0.00%
[…]

--- State Summary ---------------- RgnCount ----------- Total Size -------- %ofBusy %ofTotal
[...]
MEM_COMMIT                             2477        0`326e8000 ( 806.906 Mb)   8.76%    0.00%
[…]

WinDbg lmt command shows almost 50 new .NET components.

- Dmitry Vostokov @ DumpAnalysis.org + TraceAnalysis.org -

Crash Dump Analysis Patterns (Part 215)

November 16th, 2014

Sometimes Wait Chains such as involving critical sections may have a Missing Thread endpoint. But in some cases we might see a Ghost Thread whose TID was reused by subsequent thread creation in a different process. For example, critical section structure may refer to such TID as in the example below.

// Critical section from LSASS process

THREAD fffffa803431cb50 Cid 03e8.2718 Teb: 000007fffff80000 Win32Thread: 0000000000000000 WAIT: (UserRequest) UserMode Non-Alertable
fffffa80330e0500 SynchronizationEvent
Impersonation token: fffff8a00b807060 (Level Impersonation)
Owning Process            fffffa8032354c40     Image: lsass.exe
Attached Process          N/A            Image:         N/A
Wait Start TickCount      107175         Ticks: 19677 (0:00:05:06.963)
Context Switch Count      2303           IdealProcessor: 1
UserTime                  00:00:00.218
KernelTime                00:00:00.109
Win32 Start Address ntdll!TppWorkerThread (0×0000000076e1f2e0)
Stack Init fffff88008e5fdb0 Current fffff88008e5f900
Base fffff88008e60000 Limit fffff88008e5a000 Call 0
Priority 10 BasePriority 10 UnusualBoost 0 ForegroundBoost 0 IoPriority 2 PagePriority 5
Kernel stack not resident.
Child-SP RetAddr Call Site
fffff880`08e5f940 fffff800`01c7cf72 nt!KiSwapContext+0×7a
fffff880`08e5fa80 fffff800`01c8e39f nt!KiCommitThreadWait+0×1d2
fffff880`08e5fb10 fffff800`01f7fe3e nt!KeWaitForSingleObject+0×19f
fffff880`08e5fbb0 fffff800`01c867d3 nt!NtWaitForSingleObject+0xde
fffff880`08e5fc20 00000000`76e5067a nt!KiSystemServiceCopyEnd+0×13 (TrapFrame @ fffff880`08e5fc20)
00000000`0427cca8 00000000`76e4d808 ntdll!NtWaitForSingleObject+0xa
00000000`0427ccb0 00000000`76e4d6fb ntdll!RtlpWaitOnCriticalSection+0xe8
00000000`0427cd60 000007fe`f46a4afe ntdll!RtlEnterCriticalSection+0xd1

[…]

1: kd> .process /r /p fffffa8032354c40
Implicit process is now fffffa80`32353b30
Loading User Symbols

1: kd> !cs -l -o -s
-----------------------------------------
DebugInfo          = 0x0000000003475220
Critical section   = 0x0000000003377740 (+0x3377740)
LOCKED
LockCount          = 0×10
WaiterWoken        = No
OwningThread       = 0×00000000000004e4
RecursionCount     = 0×0
LockSemaphore      = 0×0
SpinCount          = 0×0000000000000000
OwningThread       = .thread fffffa80344e4c00
[…]

// The "owner" thread is from winlogon.exe

1: kd> !thread fffffa80344e4c00 3f
THREAD fffffa80344e4c00 Cid 21d0.14e4 Teb: 000007fffffae000 Win32Thread: fffff900c0998c20 WAIT: (WrUserRequest) UserMode Non-Alertable
fffffa80355817d0 SynchronizationEvent
Not impersonating
DeviceMap            fffff8a0000088f0
Owning Process       fffffa8034ff77c0       Image: winlogon.exe
[…]

A PML (Process Monitor) log was recorded before the complete memory dump was forced, and it clearly shows Glued Activity trace analysis pattern. The thread was owned by LSASS but then exited and its TID was subsequently reused by 2 other processes.

- Dmitry Vostokov @ DumpAnalysis.org + TraceAnalysis.org -

Trace Analysis Patterns (Part 95)

November 16th, 2014

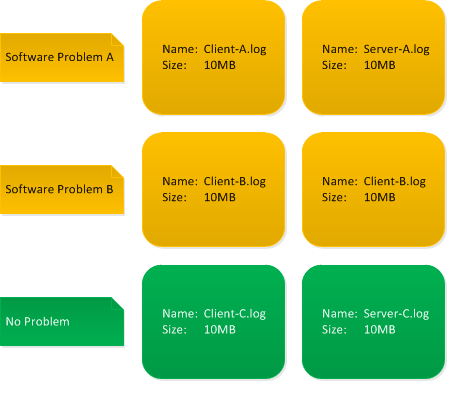
Trace and log analysis starts with assessment of artifact File Size, especially with multiple logging scenarios in distributed systems. If all log files are of the same size we might have either Circular Traces or Truncated Traces. Both point to wrong trace timing plan or just using default tracing tool configuration.

- Dmitry Vostokov @ DumpAnalysis.org + TraceAnalysis.org -

Crash Dump Analysis Patterns (Part 61b)

November 15th, 2014

We recently encountered Invalid Handle pattern in the context of .NET program execution. We decided to model it and wrote a small C# program:

namespace SafeHandle
{
    class Program
    {
        static void Main(string[] args)
        {
            SafeFileHandle hFile =
                 new SafeFileHandle(new IntPtr(0xDEAD), true);
            Console.WriteLine("About to close");
            Console.ReadKey();
        }
    }
}

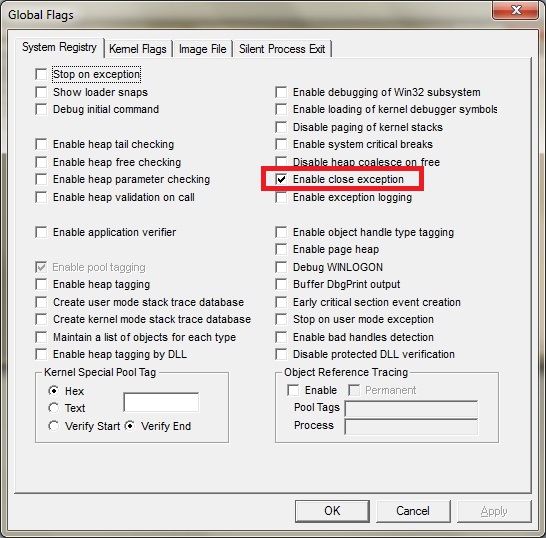
Of course, when we execute it nothing happens. Invalid handles are ignored by default. However, to change the behavior we enabled “Enable close exception” in glags.exe:
And if we run it we get this Managed Stack Trace:
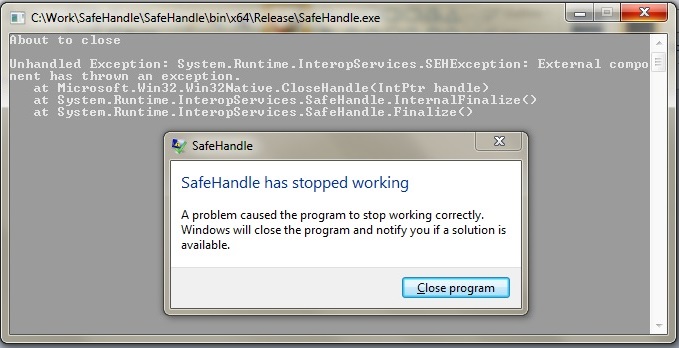
We could have detected invalid handle if we enabled Application Verifier but then we wouldn’t have Managed Code Exception.

So we load a crash dump (saved because we enabled LocalDumps) and load SOS extension:

0:002> lmv m clr
start end module name
000007fe`ed880000 000007fe`ee1eb000 clr (pdb symbols)
Loaded symbol image file: clr.dll
Image path: C:\Windows\Microsoft.NET\Framework64\v4.0.30319\clr.dll
[...]

0:002> .load C:\Windows\Microsoft.NET\Framework64\v4.0.30319\sos

0:002> !pe
Exception object: 0000000002ab5fe8
Exception type: System.Runtime.InteropServices.SEHException
Message: External component has thrown an exception.

InnerException:
StackTrace (generated):
SP IP Function
000000001B40EDD0 0000000000000000 mscorlib_ni!Microsoft.Win32.Win32Native.CloseHandle(IntPtr)+0×1
000000001B40F2F0 0000000000000000 mscorlib_ni!System.Runtime.InteropServices.SafeHandle.InternalFinalize()+0×1
000000001B40F2F0 000007FEEC62F7A6 mscorlib_ni!System.Runtime.InteropServices.SafeHandle.Finalize()+0×26

StackTraceString:
HResult: 80004005

Our unmanaged CLR Thread Exception Stack Trace is quite simple:

0:002> k
Child-SP RetAddr Call Site
00000000`1b40d6e8 000007fe`fd651430 ntdll!NtWaitForMultipleObjects+0xa
00000000`1b40d6f0 00000000`77621723 KERNELBASE!WaitForMultipleObjectsEx+0xe8
00000000`1b40d7f0 00000000`7769b5e5 kernel32!WaitForMultipleObjectsExImplementation+0xb3
00000000`1b40d880 00000000`7769b767 kernel32!WerpReportFaultInternal+0x215
00000000`1b40d920 00000000`7769b7bf kernel32!WerpReportFault+0x77
00000000`1b40d950 00000000`7769b9dc kernel32!BasepReportFault+0x1f
00000000`1b40d980 00000000`778b3398 kernel32!UnhandledExceptionFilter+0x1fc
00000000`1b40da60 00000000`778385c8 ntdll! ?? ::FNODOBFM::`string'+0x2365
00000000`1b40da90 00000000`77849d2d ntdll!_C_specific_handler+0x8c
00000000`1b40db00 00000000`778391cf ntdll!RtlpExecuteHandlerForException+0xd
00000000`1b40db30 00000000`778397c8 ntdll!RtlDispatchException+0x45a
00000000`1b40e210 00000000`778712c7 ntdll!RtlRaiseException+0x22f
00000000`1b40ebc0 000007fe`fd651873 ntdll!KiRaiseUserExceptionDispatcher+0×3a
00000000`1b40ec90 00000000`77621991 KERNELBASE!CloseHandle+0×13

00000000`1b40ecc0 000007fe`ec720418 kernel32!CloseHandleImplementation+0×3d
00000000`1b40edd0 000007fe`ed8e9e03 mscorlib_ni+0×580418
00000000`1b40eea0 000007fe`ed8e9e7e clr!CallDescrWorkerInternal+0×83
00000000`1b40eee0 000007fe`ed8ec860 clr!CallDescrWorkerWithHandler+0×4a
00000000`1b40ef20 000007fe`ed8f1a1d clr!DispatchCallSimple+0×85
00000000`1b40efb0 000007fe`ed8f19ac clr!SafeHandle::RunReleaseMethod+0×69
00000000`1b40f050 000007fe`ed8f180a clr!SafeHandle::Release+0×122
00000000`1b40f120 000007fe`eda4863e clr!SafeHandle::Dispose+0×36
00000000`1b40f190 000007fe`ec62f7a6 clr!SafeHandle::Finalize+0xa2
00000000`1b40f2f0 000007fe`ed8e9d56 mscorlib_ni+0×48f7a6
00000000`1b40f330 000007fe`eda83c4e clr!FastCallFinalizeWorker+0×6
00000000`1b40f360 000007fe`eda83bc3 clr!MethodDesc::RequiresFullSlotNumber+0×72
00000000`1b40f3a0 000007fe`eda83b0f clr!MethodTable::CallFinalizer+0xa3
00000000`1b40f3e0 000007fe`ed9fee46 clr!SVR::CallFinalizer+0×5f
00000000`1b40f420 000007fe`ed9aac5b clr!SVR::CallFinalizer+0×102
00000000`1b40f4e0 000007fe`ed8f458c clr!WKS::GCHeap::IsPromoted+0xee
00000000`1b40f520 000007fe`ed8f451a clr!Frame::Pop+0×50
00000000`1b40f560 000007fe`ed8f4491 clr!COMCustomAttribute::PopSecurityContextFrame+0×192
00000000`1b40f660 000007fe`ed9d1bfe clr!COMCustomAttribute::PopSecurityContextFrame+0xbd
00000000`1b40f6f0 000007fe`ed9d1e59 clr!ManagedThreadBase_NoADTransition+0×3f
00000000`1b40f750 000007fe`ed9533de clr!WKS::GCHeap::FinalizerThreadStart+0×193
00000000`1b40f790 00000000`776159ed clr!Thread::intermediateThreadProc+0×7d
00000000`1b40f850 00000000`7784c541 kernel32!BaseThreadInitThunk+0xd
00000000`1b40f880 00000000`00000000 ntdll!RtlUserThreadStart+0×1d

We see that exception processing happened during object finalization. We can infer the value of the handle (may be Small Value) via disassembly if this is possible:

0:002> kn
# Child-SP RetAddr Call Site
00 00000000`1b40d6e8 000007fe`fd651430 ntdll!NtWaitForMultipleObjects+0xa
01 00000000`1b40d6f0 00000000`77621723 KERNELBASE!WaitForMultipleObjectsEx+0xe8
02 00000000`1b40d7f0 00000000`7769b5e5 kernel32!WaitForMultipleObjectsExImplementation+0xb3
03 00000000`1b40d880 00000000`7769b767 kernel32!WerpReportFaultInternal+0x215
04 00000000`1b40d920 00000000`7769b7bf kernel32!WerpReportFault+0x77
05 00000000`1b40d950 00000000`7769b9dc kernel32!BasepReportFault+0x1f
06 00000000`1b40d980 00000000`778b3398 kernel32!UnhandledExceptionFilter+0x1fc
07 00000000`1b40da60 00000000`778385c8 ntdll! ?? ::FNODOBFM::`string'+0x2365
08 00000000`1b40da90 00000000`77849d2d ntdll!_C_specific_handler+0x8c
09 00000000`1b40db00 00000000`778391cf ntdll!RtlpExecuteHandlerForException+0xd
0a 00000000`1b40db30 00000000`778397c8 ntdll!RtlDispatchException+0x45a
0b 00000000`1b40e210 00000000`778712c7 ntdll!RtlRaiseException+0x22f
0c 00000000`1b40ebc0 000007fe`fd651873 ntdll!KiRaiseUserExceptionDispatcher+0x3a
0d 00000000`1b40ec90 00000000`77621991 KERNELBASE!CloseHandle+0×13
0e 00000000`1b40ecc0 000007fe`ec720418 kernel32!CloseHandleImplementation+0×3d
0f 00000000`1b40edd0 000007fe`ed8e9e03 mscorlib_ni+0×580418
10 00000000`1b40eea0 000007fe`ed8e9e7e clr!CallDescrWorkerInternal+0×83
11 00000000`1b40eee0 000007fe`ed8ec860 clr!CallDescrWorkerWithHandler+0×4a
12 00000000`1b40ef20 000007fe`ed8f1a1d clr!DispatchCallSimple+0×85
13 00000000`1b40efb0 000007fe`ed8f19ac clr!SafeHandle::RunReleaseMethod+0×69
14 00000000`1b40f050 000007fe`ed8f180a clr!SafeHandle::Release+0×122
15 00000000`1b40f120 000007fe`eda4863e clr!SafeHandle::Dispose+0×36
16 00000000`1b40f190 000007fe`ec62f7a6 clr!SafeHandle::Finalize+0xa2
17 00000000`1b40f2f0 000007fe`ed8e9d56 mscorlib_ni+0×48f7a6
18 00000000`1b40f330 000007fe`eda83c4e clr!FastCallFinalizeWorker+0×6
19 00000000`1b40f360 000007fe`eda83bc3 clr!MethodDesc::RequiresFullSlotNumber+0×72
1a 00000000`1b40f3a0 000007fe`eda83b0f clr!MethodTable::CallFinalizer+0xa3
1b 00000000`1b40f3e0 000007fe`ed9fee46 clr!SVR::CallFinalizer+0×5f
1c 00000000`1b40f420 000007fe`ed9aac5b clr!SVR::CallFinalizer+0×102
1d 00000000`1b40f4e0 000007fe`ed8f458c clr!WKS::GCHeap::IsPromoted+0xee
1e 00000000`1b40f520 000007fe`ed8f451a clr!Frame::Pop+0×50
1f 00000000`1b40f560 000007fe`ed8f4491 clr!COMCustomAttribute::PopSecurityContextFrame+0×192
20 00000000`1b40f660 000007fe`ed9d1bfe clr!COMCustomAttribute::PopSecurityContextFrame+0xbd
21 00000000`1b40f6f0 000007fe`ed9d1e59 clr!ManagedThreadBase_NoADTransition+0×3f
22 00000000`1b40f750 000007fe`ed9533de clr!WKS::GCHeap::FinalizerThreadStart+0×193
23 00000000`1b40f790 00000000`776159ed clr!Thread::intermediateThreadProc+0×7d
24 00000000`1b40f850 00000000`7784c541 kernel32!BaseThreadInitThunk+0xd
25 00000000`1b40f880 00000000`00000000 ntdll!RtlUserThreadStart+0×1d

0:002> .frame /c d
0d 00000000`1b40ec90 00000000`77621991 KERNELBASE!CloseHandle+0x13
rax=00000000c0000001 rbx=000000000000dead rcx=00000000009a0000
rdx=0000000000000001 rsi=000000001b40efd0 rdi=000000001b40eff8
rip=000007fefd651873 rsp=000000001b40ec90 rbp=000000001b40edf0
r8=000000001b40ce08 r9=000000001b40cf70 r10=0000000000000000
r11=0000000000000246 r12=0000000000000001 r13=0000000040000000
r14=000000001b40ef40 r15=0000000000000000
iopl=0 nv up ei pl zr na po nc
cs=0033 ss=002b ds=002b es=002b fs=0053 gs=002b efl=00000246
KERNELBASE!CloseHandle+0×13:
000007fe`fd651873 85c0 test eax,eax

0:002> ub 00000000`77621991
kernel32!CloseHandleImplementation+0×1e:
00000000`7762196e 83f9f4 cmp ecx,0FFFFFFF4h
00000000`77621971 0f83952e0100 jae kernel32!TlsGetValue+0×3ef0 (00000000`7763480c)
00000000`77621977 488bc3 mov rax,rbx
00000000`7762197a 2503000010 and eax,10000003h
00000000`7762197f 4883f803 cmp rax,3
00000000`77621983 0f847f8dfeff je kernel32!CloseHandleImplementation+0×56 (00000000`7760a708)
00000000`77621989 488bcb mov rcx,rbx
00000000`7762198c e81f000000 call kernel32!CloseHandle (00000000`776219b0)

Here we also check the value from the managed stack trace or from Execution Residue:

0:002> !CLRStack -a
OS Thread Id: 0x1390 (2)
Child SP IP Call Site
000000001b40edf8 000000007787186a [InlinedCallFrame: 000000001b40edf8] Microsoft.Win32.Win32Native.CloseHandle(IntPtr)
000000001b40edf8 000007feec720418 [InlinedCallFrame: 000000001b40edf8] Microsoft.Win32.Win32Native.CloseHandle(IntPtr)
000000001b40edd0 000007feec720418 DomainNeutralILStubClass.IL_STUB_PInvoke(IntPtr)
PARAMETERS:
<no data>

000000001b40eff8 000007feed8e9e03 [GCFrame: 000000001b40eff8]
000000001b40f148 000007feed8e9e03 [GCFrame: 000000001b40f148]
000000001b40f1f8 000007feed8e9e03 [HelperMethodFrame_1OBJ: 000000001b40f1f8] System.Runtime.InteropServices.SafeHandle.InternalFinalize()
000000001b40f2f0 000007feec62f7a6 System.Runtime.InteropServices.SafeHandle.Finalize()
PARAMETERS:
this (0x000000001b40f330) = 0×0000000002ab2d78

000000001b40f6a8 000007feed8e9d56 [DebuggerU2MCatchHandlerFrame: 000000001b40f6a8]

0:002> !dso
OS Thread Id: 0x1390 (2)
RSP/REG Object Name
000000001B40EEA0 0000000002ab2d78 Microsoft.Win32.SafeHandles.SafeFileHandle
000000001B40EFD0 0000000002ab2d78 Microsoft.Win32.SafeHandles.SafeFileHandle
000000001B40F038 0000000002ab2d78 Microsoft.Win32.SafeHandles.SafeFileHandle
000000001B40F050 0000000002ab2d78 Microsoft.Win32.SafeHandles.SafeFileHandle
000000001B40F090 0000000002ab2d78 Microsoft.Win32.SafeHandles.SafeFileHandle
000000001B40F120 0000000002ab2d78 Microsoft.Win32.SafeHandles.SafeFileHandle
000000001B40F190 0000000002ab2d78 Microsoft.Win32.SafeHandles.SafeFileHandle
000000001B40F1B8 0000000002ab2d78 Microsoft.Win32.SafeHandles.SafeFileHandle
000000001B40F240 0000000002ab2d78 Microsoft.Win32.SafeHandles.SafeFileHandle
000000001B40F2F8 0000000002ab2d78 Microsoft.Win32.SafeHandles.SafeFileHandle
000000001B40F330 0000000002ab2d78 Microsoft.Win32.SafeHandles.SafeFileHandle
000000001B40F360 0000000002ab5e10 System.Threading.Thread
000000001B40F390 0000000002ab2d78 Microsoft.Win32.SafeHandles.SafeFileHandle
000000001B40F3E0 0000000002ab2d78 Microsoft.Win32.SafeHandles.SafeFileHandle
000000001B40F3F0 0000000002ab2d78 Microsoft.Win32.SafeHandles.SafeFileHandle
000000001B40F430 0000000002ab58a8 Microsoft.Win32.SafeHandles.SafeViewOfFileHandle
000000001B40F4E0 0000000002ab2d78 Microsoft.Win32.SafeHandles.SafeFileHandle

0:002> !do 0000000002ab2d78
Name: Microsoft.Win32.SafeHandles.SafeFileHandle
MethodTable: 000007feec88a260
EEClass: 000007feec34d340
Size: 32(0x20) bytes
File: C:\windows\Microsoft.Net\assembly\GAC_64\mscorlib\v4.0_4.0.0.0__b77a5c561934e089\mscorlib.dll
Fields:
MT Field Offset Type VT Attr Value Name
000007feec88a338 400060d 8 System.IntPtr 1 instance dead handle
000007feec8892b8 400060e 10 System.Int32 1 instance 3 _state
000007feec887de0 400060f 14 System.Boolean 1 instance 1 _ownsHandle
000007feec887de0 4000610 15 System.Boolean 1 instance 1 _fullyInitialized

Please note that we don’t have global application flags:

0:002> !gflag
Current NtGlobalFlag contents: 0x00000000

Here is the exception stack trace from a different crash dump when we enable Application Verifier:

0:002> !gflag
Current NtGlobalFlag contents: 0x02000100
vrf - Enable application verifier
hpa - Place heap allocations at ends of pages

0:002> k
Child-SP RetAddr Call Site
00000000`24bac4a8 00000000`77cd3072 ntdll!NtWaitForSingleObject+0xa
00000000`24bac4b0 00000000`77cd32b5 ntdll!RtlReportExceptionEx+0x1d2
00000000`24bac5a0 000007fe`fa2c26fb ntdll!RtlReportException+0xb5
00000000`24bac620 00000000`77c2a5db verifier!AVrfpVectoredExceptionHandler+0x26b
00000000`24bac6b0 00000000`77c28e62 ntdll!RtlpCallVectoredHandlers+0xa8
00000000`24bac720 00000000`77c61248 ntdll!RtlDispatchException+0x22
00000000`24bace00 000007fe`fa2bae03 ntdll!KiUserExceptionDispatch+0x2e
00000000`24bad500 000007fe`fa2c268a verifier!VerifierStopMessageEx+0x6fb
00000000`24bad850 00000000`77c2a5db verifier!AVrfpVectoredExceptionHandler+0x1fa
00000000`24bad8e0 00000000`77c28e62 ntdll!RtlpCallVectoredHandlers+0xa8
00000000`24bad950 00000000`77c297c8 ntdll!RtlDispatchException+0x22
00000000`24bae030 00000000`77c612c7 ntdll!RtlRaiseException+0x22f
00000000`24bae9e0 000007fe`fa2d2386 ntdll!KiRaiseUserExceptionDispatcher+0x3a
00000000`24baeab0 000007fe`fdbd1873 verifier!AVrfpNtClose+0xbe
00000000`24baeae0 000007fe`fa2d4031 KERNELBASE!CloseHandle+0x13
00000000`24baeb10 000007fe`fa2d40cb verifier!AVrfpCloseHandleCommon+0x95
00000000`24baeb40 00000000`77a11991 verifier!AVrfpKernelbaseCloseHandle+0x23
00000000`24baeb80 000007fe`fa2d4031 kernel32!CloseHandleImplementation+0x3d
00000000`24baec90 000007fe`fa2d409c verifier!AVrfpCloseHandleCommon+0x95
*** WARNING: Unable to verify checksum for mscorlib.ni.dll
00000000`24baecc0 000007fe`e6a40418 verifier!AVrfpKernel32CloseHandle+0x2c
00000000`24baed00 000007fe`ec0e9e03 mscorlib_ni+0x580418
00000000`24baedd0 000007fe`ec0e9e7e clr!CallDescrWorkerInternal+0x83
00000000`24baee10 000007fe`ec0ec860 clr!CallDescrWorkerWithHandler+0x4a
00000000`24baee50 000007fe`ec0f1a1d clr!DispatchCallSimple+0x85
00000000`24baeee0 000007fe`ec0f19ac clr!SafeHandle::RunReleaseMethod+0x69
00000000`24baef80 000007fe`ec0f180a clr!SafeHandle::Release+0x122
00000000`24baf050 000007fe`ec24863e clr!SafeHandle::Dispose+0x36
00000000`24baf0c0 000007fe`e694f7a6 clr!SafeHandle::Finalize+0xa2
00000000`24baf220 000007fe`ec0e9d56 mscorlib_ni+0x48f7a6
00000000`24baf260 000007fe`ec283c4e clr!FastCallFinalizeWorker+0x6
00000000`24baf290 000007fe`ec283bc3 clr!MethodDesc::RequiresFullSlotNumber+0x72
00000000`24baf2d0 000007fe`ec283b0f clr!MethodTable::CallFinalizer+0xa3
00000000`24baf310 000007fe`ec1fee46 clr!SVR::CallFinalizer+0x5f
00000000`24baf350 000007fe`ec1aac5b clr!SVR::CallFinalizer+0x102
00000000`24baf410 000007fe`ec0f458c clr!WKS::GCHeap::IsPromoted+0xee
00000000`24baf450 000007fe`ec0f451a clr!Frame::Pop+0x50
00000000`24baf490 000007fe`ec0f4491 clr!COMCustomAttribute::PopSecurityContextFrame+0x192
00000000`24baf590 000007fe`ec1d1bfe clr!COMCustomAttribute::PopSecurityContextFrame+0xbd
00000000`24baf620 000007fe`ec1d1e59 clr!ManagedThreadBase_NoADTransition+0x3f
00000000`24baf680 000007fe`ec1533de clr!WKS::GCHeap::FinalizerThreadStart+0x193
00000000`24baf6c0 000007fe`fa2d4b87 clr!Thread::intermediateThreadProc+0x7d
00000000`24baf780 00000000`77a059ed verifier!AVrfpStandardThreadFunction+0x2b
00000000`24baf7c0 00000000`77c3c541 kernel32!BaseThreadInitThunk+0xd
00000000`24baf7f0 00000000`00000000 ntdll!RtlUserThreadStart+0x1d

0:002> !pe
There is no current managed exception on this thread

0:002> !CLRStack
OS Thread Id: 0x51e4 (2)
Child SP IP Call Site
0000000024baed28 0000000077c612fa [InlinedCallFrame: 0000000024baed28] Microsoft.Win32.Win32Native.CloseHandle(IntPtr)
0000000024baed28 000007fee6a40418 [InlinedCallFrame: 0000000024baed28] Microsoft.Win32.Win32Native.CloseHandle(IntPtr)
0000000024baed00 000007fee6a40418 DomainNeutralILStubClass.IL_STUB_PInvoke(IntPtr)
0000000024baef28 000007feec0e9e03 [GCFrame: 0000000024baef28]
0000000024baf078 000007feec0e9e03 [GCFrame: 0000000024baf078]
0000000024baf128 000007feec0e9e03 [HelperMethodFrame_1OBJ: 0000000024baf128] System.Runtime.InteropServices.SafeHandle.InternalFinalize()
0000000024baf220 000007fee694f7a6 System.Runtime.InteropServices.SafeHandle.Finalize()
0000000024baf5d8 000007feec0e9d56 [DebuggerU2MCatchHandlerFrame: 0000000024baf5d8]

0:002> !dso
OS Thread Id: 0x51e4 (2)
RSP/REG Object Name
0000000024BAEDD0 000000000c282d78 Microsoft.Win32.SafeHandles.SafeFileHandle
0000000024BAEF00 000000000c282d78 Microsoft.Win32.SafeHandles.SafeFileHandle
0000000024BAEF68 000000000c282d78 Microsoft.Win32.SafeHandles.SafeFileHandle
0000000024BAEF80 000000000c282d78 Microsoft.Win32.SafeHandles.SafeFileHandle
0000000024BAEFC0 000000000c282d78 Microsoft.Win32.SafeHandles.SafeFileHandle
0000000024BAF050 000000000c282d78 Microsoft.Win32.SafeHandles.SafeFileHandle
0000000024BAF0C0 000000000c282d78 Microsoft.Win32.SafeHandles.SafeFileHandle
0000000024BAF0E8 000000000c282d78 Microsoft.Win32.SafeHandles.SafeFileHandle
0000000024BAF170 000000000c282d78 Microsoft.Win32.SafeHandles.SafeFileHandle
0000000024BAF228 000000000c282d78 Microsoft.Win32.SafeHandles.SafeFileHandle
0000000024BAF260 000000000c282d78 Microsoft.Win32.SafeHandles.SafeFileHandle
0000000024BAF290 000000000c285e10 System.Threading.Thread
0000000024BAF2C0 000000000c282d78 Microsoft.Win32.SafeHandles.SafeFileHandle
0000000024BAF310 000000000c282d78 Microsoft.Win32.SafeHandles.SafeFileHandle
0000000024BAF320 000000000c282d78 Microsoft.Win32.SafeHandles.SafeFileHandle
0000000024BAF360 000000000c2858a8 Microsoft.Win32.SafeHandles.SafeViewOfFileHandle
0000000024BAF410 000000000c282d78 Microsoft.Win32.SafeHandles.SafeFileHandle

0:002> !CLRStack -a
OS Thread Id: 0x51e4 (2)
Child SP               IP Call Site
0000000024baed28 0000000077c612fa [InlinedCallFrame: 0000000024baed28] Microsoft.Win32.Win32Native.CloseHandle(IntPtr)
0000000024baed28 000007fee6a40418 [InlinedCallFrame: 0000000024baed28] Microsoft.Win32.Win32Native.CloseHandle(IntPtr)
0000000024baed00 000007fee6a40418 DomainNeutralILStubClass.IL_STUB_PInvoke(IntPtr)
PARAMETERS:
<no data>

0000000024baef28 000007feec0e9e03 [GCFrame: 0000000024baef28]
0000000024baf078 000007feec0e9e03 [GCFrame: 0000000024baf078]
0000000024baf128 000007feec0e9e03 [HelperMethodFrame_1OBJ: 0000000024baf128] System.Runtime.InteropServices.SafeHandle.InternalFinalize()
0000000024baf220 000007fee694f7a6 System.Runtime.InteropServices.SafeHandle.Finalize()
PARAMETERS:
this (0x0000000024baf260) = 0×000000000c282d78

0000000024baf5d8 000007feec0e9d56 [DebuggerU2MCatchHandlerFrame: 0000000024baf5d8]

0:002> !do 0x000000000c282d78
Name: Microsoft.Win32.SafeHandles.SafeFileHandle
MethodTable: 000007fee6baa260
EEClass: 000007fee666d340
Size: 32(0x20) bytes
File: C:\windows\Microsoft.Net\assembly\GAC_64\mscorlib\v4.0_4.0.0.0__b77a5c561934e089\mscorlib.dll
Fields:
MT Field Offset Type VT Attr Value Name
000007fee6baa338 400060d 8 System.IntPtr 1 instance dead handle
000007fee6ba92b8 400060e 10 System.Int32 1 instance 3 _state
000007fee6ba7de0 400060f 14 System.Boolean 1 instance 1 _ownsHandle
000007fee6ba7de0 4000610 15 System.Boolean 1 instance 1 _fullyInitialized

- Dmitry Vostokov @ DumpAnalysis.org + TraceAnalysis.org -
Trace Analysis Patterns (Part 94)

November 11th, 2014

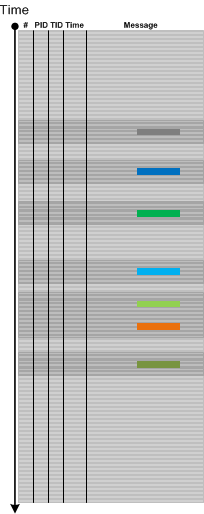
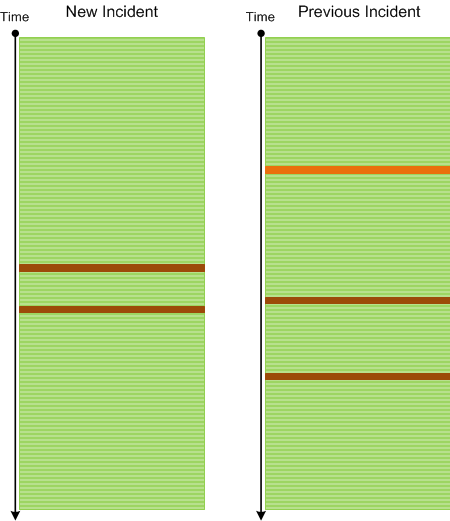
Trace messages may correspond to specific implementation code such as recording the status of an operation, dumping data values, printing errors, or they may correspond to higher levels of software design and architecture, and even to use case stories. We call such messages Milestones by analogy with project management. Alternative names can be Chapter Messages, Summary Messages, Checkpoints, or Use Case Messages. These are different from Macrofunctions which are collections messages grouped by some higher function. Milestone messages are specifically designed distinct trace statements:

They can also be a part of Significant Events, serve the role of Anchor Messages, and be a part of Basic Facts and Vocabulary Index.

- Dmitry Vostokov @ DumpAnalysis.org + TraceAnalysis.org -
Trace Analysis Patterns (Part 93)

November 9th, 2014

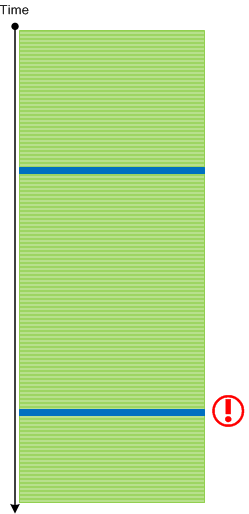
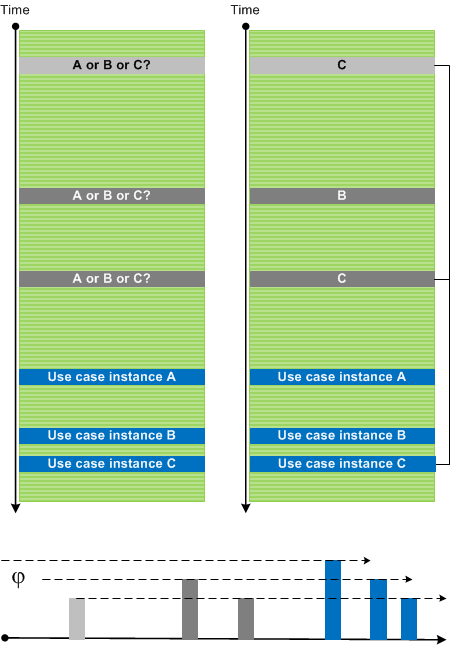
Sometimes we have several use case instances traced in one log file. Messages and Activity Regions from many Use Case Trails intermingle and make analysis difficult especially with the absence of UCID (Use Case ID), any other identification tags, or Message Links. However, initially most of the time we are interested in a sequence of Significant Events. After finding Anchor Messages we can use Time Deltas to differentiate between trace statements from different Use Case Trails. Here we assume correct Event Sequence Order. We call this pattern Event Sequence Phase by analogy with wave phases (all such individual “waves” may have different “shapes” due to various delays between different stages of their use case and implementation narratives):

In the picture above we also identified Dominant Event Sequence for use case instance C.

- Dmitry Vostokov @ DumpAnalysis.org + TraceAnalysis.org -
Trace Analysis Patterns (Part 92)

November 9th, 2014

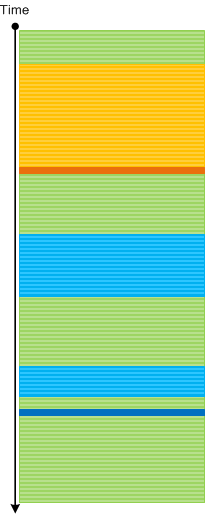
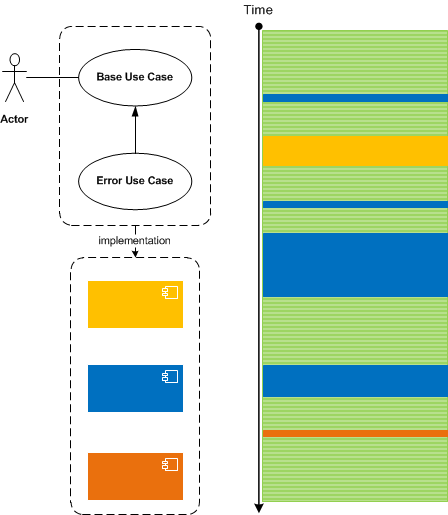
Use cases are implemented in various components such as subsystems, processes, modules, and source code files. Most of the time with good tracing implementation we are able to see Use Case Trails: log messages corresponding to use case scenarios. For simple systems one log may fully correspond to just one use case, but for complex systems, especially distributed client-server ones, there may be several use case instances present simultaneously in one log. One way to disentangle them in the absence of UCID (Use Case ID) or some other grouping tag is to use Event Sequence Phase, the subject of the next pattern.

Master Traces may also correspond to use cases but they should ideally correspond to only one use case instance.

- Dmitry Vostokov @ DumpAnalysis.org + TraceAnalysis.org -
Crash Dump Analysis Patterns (Part 20e)

October 30th, 2014

The set of memory dumps that prompted to introduce Insufficient Memory pattern for stack trace database also prompted to include a variant of Memory Leak pattern related to regions of virtual memory address space. We created this simple modeling application:

int _tmain(int argc, _TCHAR* argv[])
{
	int i,j;
	for (i = 1; i < 1000; ++i)
	{
		for (j = 1; j < 1000; ++j)
		{
			VirtualAlloc(NULL, 0x10000, MEM_RESERVE,
                                     PAGE_EXECUTE_READWRITE);
		}
		getc(stdin);
	}
	return 0;
}

We allocated only reserved memory regions. Committing them would probably at some stage manifest Insufficient Memory patterns for committed memory and physical memory. So we took a few consecutive memory dumps and see the ever increasing number of regions allocated at greater and greater virtual addresses:

0:000> !address
[...]
*        0`04070000        0`04080000        0`00010000 MEM_PRIVATE MEM_RESERVE                                    <unclassified>
*        0`04080000        0`04090000        0`00010000 MEM_PRIVATE MEM_RESERVE                                    <unclassified>
*        0`04090000        0`040a0000        0`00010000 MEM_PRIVATE MEM_RESERVE                                    <unclassified>
*        0`040a0000        0`040b0000        0`00010000 MEM_PRIVATE MEM_RESERVE                                    <unclassified>
*        0`040b0000        0`040c0000        0`00010000 MEM_PRIVATE MEM_RESERVE                                    <unclassified>
*        0`040c0000        0`040d0000        0`00010000 MEM_PRIVATE MEM_RESERVE                                    <unclassified>
*        0`040d0000        0`040e0000        0`00010000 MEM_PRIVATE MEM_RESERVE                                    <unclassified>
*        0`040e0000        0`040f0000        0`00010000 MEM_PRIVATE MEM_RESERVE                                    <unclassified>
*        0`040f0000        0`04100000        0`00010000 MEM_PRIVATE MEM_RESERVE                                    <unclassified>
*        0`04100000        0`04110000        0`00010000 MEM_PRIVATE MEM_RESERVE                                    <unclassified>
*        0`04110000        0`04120000        0`00010000 MEM_PRIVATE MEM_RESERVE                                    <unclassified>
*        0`04120000        0`04130000        0`00010000 MEM_PRIVATE MEM_RESERVE                                    <unclassified>
*        0`04130000        0`04140000        0`00010000 MEM_PRIVATE MEM_RESERVE                                    <unclassified>
*        0`04140000        0`04260000        0`00120000             MEM_FREE    PAGE_NOACCESS                      Free
[...]

0:000> !address
[...]
*        0`2eec0000        0`2eed0000        0`00010000 MEM_PRIVATE MEM_RESERVE                                    <unclassified>
*        0`2eed0000        0`2eee0000        0`00010000 MEM_PRIVATE MEM_RESERVE                                    <unclassified>
*        0`2eee0000        0`2eef0000        0`00010000 MEM_PRIVATE MEM_RESERVE                                    <unclassified>
*        0`2eef0000        0`2ef00000        0`00010000 MEM_PRIVATE MEM_RESERVE                                    <unclassified>
*        0`2ef00000        0`2ef10000        0`00010000 MEM_PRIVATE MEM_RESERVE                                    <unclassified>
*        0`2ef10000        0`2ef20000        0`00010000 MEM_PRIVATE MEM_RESERVE                                    <unclassified>
*        0`2ef20000        0`2ef30000        0`00010000 MEM_PRIVATE MEM_RESERVE                                    <unclassified>
*        0`2ef30000        0`2ef40000        0`00010000 MEM_PRIVATE MEM_RESERVE                                    <unclassified>
*        0`2ef40000        0`2ef50000        0`00010000 MEM_PRIVATE MEM_RESERVE                                    <unclassified>
*        0`2ef50000        0`2ef60000        0`00010000 MEM_PRIVATE MEM_RESERVE                                    <unclassified>
*        0`2ef60000        0`2ef70000        0`00010000 MEM_PRIVATE MEM_RESERVE                                    <unclassified>
*        0`2ef70000        0`2ef80000        0`00010000 MEM_PRIVATE MEM_RESERVE                                    <unclassified>
*        0`2ef80000        0`2ef90000        0`00010000 MEM_PRIVATE MEM_RESERVE                                    <unclassified>
*        0`2ef90000        0`2efa0000        0`00010000 MEM_PRIVATE MEM_RESERVE                                    <unclassified>
*        0`2efa0000        0`2efb0000        0`00010000 MEM_PRIVATE MEM_RESERVE                                    <unclassified>
*        0`2efb0000        0`2efc0000        0`00010000 MEM_PRIVATE MEM_RESERVE                                    <unclassified>
*        0`2efc0000        0`2efd0000        0`00010000 MEM_PRIVATE MEM_RESERVE                                    <unclassified>
*        0`2efd0000        0`2efe0000        0`00010000 MEM_PRIVATE MEM_RESERVE                                    <unclassified>
*        0`2efe0000        0`2eff0000        0`00010000 MEM_PRIVATE MEM_RESERVE                                    <unclassified>
*        0`2eff0000        0`2f000000        0`00010000 MEM_PRIVATE MEM_RESERVE                                    <unclassified>
*        0`2f000000        0`2f010000        0`00010000 MEM_PRIVATE MEM_RESERVE                                    <unclassified>
*        0`2f010000        0`2f170000        0`00160000             MEM_FREE    PAGE_NOACCESS                      Free
[...]

0:000> !address
[...]
*        0`697f0000        0`69800000        0`00010000 MEM_PRIVATE MEM_RESERVE                                    <unclassified>
*        0`69800000        0`69810000        0`00010000 MEM_PRIVATE MEM_RESERVE                                    <unclassified>
*        0`69810000        0`69820000        0`00010000 MEM_PRIVATE MEM_RESERVE                                    <unclassified>
*        0`69820000        0`69830000        0`00010000 MEM_PRIVATE MEM_RESERVE                                    <unclassified>
*        0`69830000        0`69840000        0`00010000 MEM_PRIVATE MEM_RESERVE                                    <unclassified>
*        0`69840000        0`69850000        0`00010000 MEM_PRIVATE MEM_RESERVE                                    <unclassified>
*        0`69850000        0`69860000        0`00010000 MEM_PRIVATE MEM_RESERVE                                    <unclassified>
*        0`69860000        0`69870000        0`00010000 MEM_PRIVATE MEM_RESERVE                                    <unclassified>
*        0`69870000        0`69880000        0`00010000 MEM_PRIVATE MEM_RESERVE                                    <unclassified>
*        0`69880000        0`69890000        0`00010000 MEM_PRIVATE MEM_RESERVE                                    <unclassified>
*        0`69890000        0`698a0000        0`00010000 MEM_PRIVATE MEM_RESERVE                                    <unclassified>
*        0`698a0000        0`699e0000        0`00140000             MEM_FREE    PAGE_NOACCESS                      Free
[...]

0:000> !address
[...]
*        0`c08c0000        0`c08d0000        0`00010000 MEM_PRIVATE MEM_RESERVE                                    <unclassified>
*        0`c08d0000        0`c08e0000        0`00010000 MEM_PRIVATE MEM_RESERVE                                    <unclassified>
*        0`c08e0000        0`c08f0000        0`00010000 MEM_PRIVATE MEM_RESERVE                                    <unclassified>
*        0`c08f0000        0`c0900000        0`00010000 MEM_PRIVATE MEM_RESERVE                                    <unclassified>
*        0`c0900000        0`c0910000        0`00010000 MEM_PRIVATE MEM_RESERVE                                    <unclassified>
*        0`c0910000        0`c0920000        0`00010000 MEM_PRIVATE MEM_RESERVE                                    <unclassified>
*        0`c0920000        0`c0930000        0`00010000 MEM_PRIVATE MEM_RESERVE                                    <unclassified>
*        0`c0930000        0`c0960000        0`00030000             MEM_FREE    PAGE_NOACCESS                      Free
[...]

0:000> !address
[...]
*        1`3d6a0000        1`3d6b0000        0`00010000 MEM_PRIVATE MEM_RESERVE                                    <unclassified>
*        1`3d6b0000        1`3d6c0000        0`00010000 MEM_PRIVATE MEM_RESERVE                                    <unclassified>
*        1`3d6c0000        1`3d6d0000        0`00010000 MEM_PRIVATE MEM_RESERVE                                    <unclassified>
*        1`3d6d0000        1`3d6e0000        0`00010000 MEM_PRIVATE MEM_RESERVE                                    <unclassified>
*        1`3d6e0000        1`3d6f0000        0`00010000 MEM_PRIVATE MEM_RESERVE                                    <unclassified>
*        1`3d6f0000        1`3d700000        0`00010000 MEM_PRIVATE MEM_RESERVE                                    <unclassified>
*        1`3d700000        1`3d710000        0`00010000 MEM_PRIVATE MEM_RESERVE                                    <unclassified>
*        1`3d710000        1`3d720000        0`00010000 MEM_PRIVATE MEM_RESERVE                                    <unclassified>
*        1`3d720000        1`3d730000        0`00010000 MEM_PRIVATE MEM_RESERVE                                    <unclassified>
*        1`3d730000        1`3d7a0000        0`00070000             MEM_FREE    PAGE_NOACCESS                      Free
[...]

0:000> !address -summary

--- Usage Summary ---------------- RgnCount ———– Total Size ——– %ofBusy %ofTotal
Free                                     15      7fe`c275e000 (   7.995 Tb)           99.94%
<unclassified>                        80928        1`3d193000 (   4.955 Gb)  99.86%    0.06%
Image                                    28        0`0034b000 (   3.293 Mb)   0.06%    0.00%
Stack                                     6        0`00200000 (   2.000 Mb)   0.04%    0.00%
MemoryMappedFile                          8        0`001af000 (   1.684 Mb)   0.03%    0.00%
TEB                                       2        0`00004000 (  16.000 kb)   0.00%    0.00%
PEB                                       1        0`00001000 (   4.000 kb)   0.00%    0.00%

--- Type Summary (for busy) ------ RgnCount ----------- Total Size -------- %ofBusy %ofTotal
MEM_PRIVATE                           80936        1`3d397000 (   4.957 Gb)  99.90%    0.06%
MEM_IMAGE                                29        0`0034c000 (   3.297 Mb)   0.06%    0.00%
MEM_MAPPED                                8        0`001af000 (   1.684 Mb)   0.03%    0.00%

--- State Summary ---------------- RgnCount ----------- Total Size -------- %ofBusy %ofTotal
MEM_FREE                                 15      7fe`c275e000 (   7.995 Tb)           99.94%
MEM_RESERVE                           80926        1`3d438000 (   4.957 Gb)  99.91%    0.06%
MEM_COMMIT                               47        0`0045a000 (   4.352 Mb)   0.09%    0.00%

--- Protect Summary (for commit) - RgnCount ----------- Total Size -------- %ofBusy %ofTotal
PAGE_EXECUTE_READ                         4        0`001ef000 (   1.934 Mb)   0.04%    0.00%
PAGE_READONLY                            19        0`001de000 (   1.867 Mb)   0.04%    0.00%
PAGE_READWRITE                           17        0`00080000 ( 512.000 kb)   0.01%    0.00%
PAGE_WRITECOPY                            5        0`00008000 (  32.000 kb)   0.00%    0.00%
PAGE_READWRITE|PAGE_GUARD                 2        0`00005000 (  20.000 kb)   0.00%    0.00%

--- Largest Region by Usage ----------- Base Address -------- Region Size ----------
Free                                      1`3fac7000      7fd`bdc79000 (   7.991 Tb)
<unclassified>                            0`7f0e0000        0`00f00000 (  15.000 Mb)
Image                                     0`77831000        0`00102000 (   1.008 Mb)
Stack                                     0`00170000        0`000fb000 (1004.000 kb)
MemoryMappedFile                          0`7efe5000        0`000fb000 (1004.000 kb)
TEB                                     7ff`fffdc000        0`00002000 (   8.000 kb)
PEB                                     7ff`fffd3000        0`00001000 (   4.000 kb)

Examination of such regions for Execution Residue such as Module Hint may point into further troubleshooting directions especially if live debugging is not possible.

- Dmitry Vostokov @ DumpAnalysis.org + TraceAnalysis.org -
Crash Dump Analysis Patterns (Part 13k)

October 27th, 2014

While working on Insufficient Memory pattern for stack trace database we noticed the expansion of certain memory regions. Of course, after some time expanding region consumes remaining free or reserved space available before some other region. Generalizing from this we may say there can be Insufficient Memory pattern variant for any region expanding region. Region expansion may also be implemented via its move into some over position in memory virtual address space. This movement also has its limits. for example, we created this modeling application and found out it stops reallocating memory long before it reaches 2,000,000,000 byte size:

int _tmain(int argc, _TCHAR* argv[])
{
	int i = 100000000;
	void *p = malloc(i);
	for (i = 200000000; i < 2000000000; i+=100000000)
	{
		p = realloc(p, i);
		getc(stdin);
	}
	return 0;
}

We took memory dumps after each loop iteration and after 6 or 8 iterations the memory size was constant and there were no further reallocations:

0:000> !heap -s
[...]
Virtual block: 0000000006370000 - 0000000006370000 (size 0000000000000000)
[...]

0:000> !address
[...]
+ 0`00550000 0`06370000 0`05e20000 MEM_FREE PAGE_NOACCESS Free
+ 0`06370000 0`1222d000 0`0bebd000 MEM_PRIVATE MEM_COMMIT PAGE_READWRITE Heap [ID: 0; Handle: 0000000000310000; Type: Large block]
+ 0`1222d000 0`77710000 0`654e3000 MEM_FREE PAGE_NOACCESS Free
+ 0`77710000 0`77711000 0`00001000 MEM_IMAGE MEM_COMMIT PAGE_READONLY Image [kernel32; “C:\windows\system32\kernel32.dll”]
[…]

0:000> !heap -s
[...]
Virtual block: 0000000012230000 - 0000000012230000 (size 0000000000000000)
[...]

0:000> !address
[...]
+ 0`005d0000 0`12230000 0`11c60000 MEM_FREE PAGE_NOACCESS Free
+ 0`12230000 0`2404b000 0`11e1b000 MEM_PRIVATE MEM_COMMIT PAGE_READWRITE Heap [ID: 0; Handle: 0000000000310000; Type: Large block]
+ 0`2404b000 0`77710000 0`536c5000 MEM_FREE PAGE_NOACCESS Free
+ 0`77710000 0`77711000 0`00001000 MEM_IMAGE MEM_COMMIT PAGE_READONLY Image [kernel32; “C:\windows\system32\kernel32.dll”]
[…]

0:000> !heap -s
[...]
Virtual block: 0000000024050000 - 0000000024050000 (size 0000000000000000)
[...]

0:000> !address
[...]
+ 0`00590000 0`24050000 0`23ac0000 MEM_FREE PAGE_NOACCESS Free
+ 0`24050000 0`3bdc9000 0`17d79000 MEM_PRIVATE MEM_COMMIT PAGE_READWRITE Heap [ID: 0; Handle: 0000000000310000; Type: Large block]
+ 0`3bdc9000 0`77710000 0`3b947000 MEM_FREE PAGE_NOACCESS Free
+ 0`77710000 0`77711000 0`00001000 MEM_IMAGE MEM_COMMIT PAGE_READONLY Image [kernel32; “C:\windows\system32\kernel32.dll”]
[…]

We skip a few iterations and finally come to a region that will not move and not increase:

0:000> !heap -s
[...]
Virtual block: 0000000041d30000 - 0000000041d30000 (size 0000000000000000)
[...]

0:000> !address
[...]
+ 0`006c0000 0`41d30000 0`41670000 MEM_FREE PAGE_NOACCESS Free
+ 0`41d30000 0`6b8c3000 0`29b93000 MEM_PRIVATE MEM_COMMIT PAGE_READWRITE Heap [ID: 0; Handle: 0000000000310000; Type: Large block]
+ 0`6b8c3000 0`77710000 0`0be4d000 MEM_FREE PAGE_NOACCESS Free
+ 0`77710000 0`77711000 0`00001000 MEM_IMAGE MEM_COMMIT PAGE_READONLY Image [kernel32; “C:\windows\system32\kernel32.dll”]
[…]

- Dmitry Vostokov @ DumpAnalysis.org + TraceAnalysis.org -
Crash Dump Analysis Patterns (Part 13j)

October 27th, 2014

Once we have seen a sequence of process memory dumps with the largest one almost 4GB. They were all saved from the process with growing memory consumption from 200MB initially. Initially we suspected process heap Memory Leak. However, heap statistics (!heap -s) was normal. There were not even large block allocations. The dumps were also supplied with UMDH logs but their difference only showed Memory Fluctuation and not increase. Stack Trace Collection revealed one Spiking Thread was logging a heap allocation into user mode stack trace database. We could also see that it was Distributed Spike. Inspection of address space showed large number of sequential regions of the same size with Stack Trace Database entries inside. So we concluded that it was stack trace logging Instrumentation Side Effect and advised to limit stack backtrace size in gflags.exe.

To make sure we understood that problem correctly we decided to model it. We didn’t come to the same results probably due to different logging implementation but memory dumps clearly show the possibility of Insufficient Memory pattern variant. Here’s the source code:

void foo20 (int size)
{
    free(malloc(size));
}
#define FOO(x,y) void foo##x (int size) { foo##y(size); }
FOO(19,20)
FOO(18,19)
FOO(17,18)
FOO(16,17)
FOO(15,16)
FOO(14,15)
FOO(13,14)
FOO(12,13)
FOO(11,12)
FOO(10,11)
FOO(9,10)
FOO(8,9)
FOO(7,8)
FOO(6,7)
FOO(5,6)
FOO(4,5)
FOO(3,4)
FOO(2,3)
FOO(1,2)
typedef void (*PFN) (int);
#define ARRSZ 20
PFN pfnArr[ARRSZ]  = {foo1, foo2, foo3, foo4, foo5, foo6, foo7,
    foo8, foo9, foo10, foo11, foo12, foo13, foo14,
    foo15, foo16, foo17, foo18, foo19, foo20};
int _tmain(int argc, _TCHAR* argv[])
{
    int i;
    for (i = 1; i < 1000000000; ++i) 
    {
        pfnArr[i%ARRSZ](i);
    }
    Sleep(-1); 
    return 0;
}

It allocates and then freezes heap entries of different size from 1 byte to 1,000,000,000 bytes all with different 20 possible stack traces. We choose different stack traces to increase the number of different {size, stack backtrace} pairs as several allocation of similar size having the same stack trace may be recorded only once in the database. We emulate different stack traces by calling different entries in pfnArr. Each call then leads to foo20 but the resulting stack trace depth is different. We also enabled “Create user mode stack trace database” checkbox in gflags.exe for our application called AllocFree.exe.

Then we see the expansion of Stack Trace Database regions (addresses are different because memory dumps were taken from different application runs):

0:000> !address
[...]
+ 0`00240000 0`00312000 0`000d2000 MEM_PRIVATE MEM_COMMIT PAGE_READWRITE Other [Stack Trace Database]
0`00312000 0`01a37000 0`01725000 MEM_PRIVATE MEM_RESERVE Other [Stack Trace Database]
0`01a37000 0`01a40000 0`00009000 MEM_PRIVATE MEM_COMMIT PAGE_READWRITE Other [Stack Trace Database]

0:000> !address
[...]
+ 0`001b0000 0`0188c000 0`016dc000 MEM_PRIVATE MEM_COMMIT PAGE_READWRITE Other [Stack Trace Database]
0`0188c000 0`0188d000 0`00001000 MEM_PRIVATE MEM_RESERVE Other [Stack Trace Database]
0`0188d000 0`019b0000 0`00123000 MEM_PRIVATE MEM_COMMIT PAGE_READWRITE Other [Stack Trace Database]

Heap stays the same:

0:000> !heap -s
NtGlobalFlag enables following debugging aids for new heaps:
stack back traces
LFH Key                   : 0x000000f841c4f9c0
Termination on corruption : ENABLED
           Heap     Flags   Reserv  Commit  Virt   Free  List   UCR  Virt  Lock
  Fast
                             (k)     (k)    (k)     (k) length      blocks cont.
 heap
-------------------------------------------------------------------------------
------
0000000001a40000 08000002    4096   1444   4096   1164     4     3    0      0
   LFH
External fragmentation  80 % (4 free blocks)
0000000000010000 08008000      64      4     64      1     1     1    0      0
0000000000020000 08008000      64     64     64     61     1     1    0      0
-------------------------------------------------------------------------------
------
0:000> !heap -s
NtGlobalFlag enables following debugging aids for new heaps:
stack back traces
LFH Key                   : 0x000000473a639107
Termination on corruption : ENABLED
           Heap     Flags   Reserv  Commit  Virt   Free  List   UCR  Virt  Lock
  Fast
                             (k)     (k)    (k)     (k) length      blocks cont.
 heap
-------------------------------------------------------------------------------
------
00000000019c0000 08000002    4096   1444   4096   1164     4     3    0      0
   LFH
External fragmentation  80 % (4 free blocks)
0000000000010000 08008000      64      4     64      1     1     1    0      0
0000000000020000 08008000      64     64     64     61     1     1    0      0
-------------------------------------------------------------------------------
------

But we see the thread consuming much CPU and caught while logging stack backtrace:

0:000> kc
Call Site
ntdll!RtlpStdLogCapturedStackTrace
ntdll!RtlStdLogStackTrace
ntdll!RtlLogStackBackTraceEx

ntdll!RtlpAllocateHeap
ntdll!RtlAllocateHeap
AllocFree!_heap_alloc
AllocFree!malloc

AllocFree!foo20
AllocFree!foo19
AllocFree!foo18
AllocFree!foo17
AllocFree!foo16
AllocFree!foo15
AllocFree!foo14
AllocFree!foo13
AllocFree!foo12
AllocFree!foo11
AllocFree!foo10
AllocFree!foo9
AllocFree!foo8
AllocFree!foo7
AllocFree!foo6
AllocFree!foo5
AllocFree!foo4
AllocFree!foo3
AllocFree!foo2
AllocFree!foo1
AllocFree!wmain
AllocFree!__tmainCRTStartup
kernel32!BaseThreadInitThunk
ntdll!RtlUserThreadStart

0:000> !runaway f
 User Mode Time
  Thread       Time
   0:53b8      0 days 3:22:02.354
 Kernel Mode Time
  Thread       Time
   0:53b8      0 days 0:20:39.022
 Elapsed Time
  Thread       Time
   0:53b8      0 days 10:11:23.596

If we dump some portion of the region we see recorded stack backtraces:

0:000> dps 0`0188c000-200 L200/8
00000000`0188be00 00000000`77891142 ntdll!RtlpAllocateHeap+0x33bd
00000000`0188be08 00000000`778834d8 ntdll!RtlAllocateHeap+0x16c
00000000`0188be10 00000001`3fcc13cb AllocFree!malloc+0x5b
00000000`0188be18 00000001`3fcc1015 AllocFree!foo20+0x15
00000000`0188be20 00000001`3fcc1041 AllocFree!foo19+0x11
00000000`0188be28 00000001`3fcc1061 AllocFree!foo18+0x11
00000000`0188be30 00000001`3fcc12e3 AllocFree!wmain+0x53
00000000`0188be38 00000001`3fcc156c AllocFree!__tmainCRTStartup+0x144
00000000`0188be40 00000000`777259ed kernel32!BaseThreadInitThunk+0xd
00000000`0188be48 00000000`7785c541 ntdll!RtlUserThreadStart+0x1d
00000000`0188be50 00000000`0188b1d0
00000000`0188be58 0009457d`00024fff
00000000`0188be60 00000000`77891142 ntdll!RtlpAllocateHeap+0x33bd
00000000`0188be68 00000000`778834d8 ntdll!RtlAllocateHeap+0x16c
00000000`0188be70 00000001`3fcc13cb AllocFree!malloc+0x5b
00000000`0188be78 00000001`3fcc1015 AllocFree!foo20+0x15
00000000`0188be80 00000001`3fcc1041 AllocFree!foo19+0x11
00000000`0188be88 00000001`3fcc12e3 AllocFree!wmain+0x53
00000000`0188be90 00000001`3fcc156c AllocFree!__tmainCRTStartup+0x144
00000000`0188be98 00000000`777259ed kernel32!BaseThreadInitThunk+0xd
00000000`0188bea0 00000000`7785c541 ntdll!RtlUserThreadStart+0x1d
00000000`0188bea8 00000000`00000000
00000000`0188beb0 00000000`0188b230
00000000`0188beb8 0008457e`00023fff
00000000`0188bec0 00000000`77891142 ntdll!RtlpAllocateHeap+0x33bd
00000000`0188bec8 00000000`778834d8 ntdll!RtlAllocateHeap+0x16c
00000000`0188bed0 00000001`3fcc13cb AllocFree!malloc+0x5b
00000000`0188bed8 00000001`3fcc1015 AllocFree!foo20+0x15
00000000`0188bee0 00000001`3fcc12e3 AllocFree!wmain+0x53
00000000`0188bee8 00000001`3fcc156c AllocFree!__tmainCRTStartup+0x144
00000000`0188bef0 00000000`777259ed kernel32!BaseThreadInitThunk+0xd
00000000`0188bef8 00000000`7785c541 ntdll!RtlUserThreadStart+0x1d
00000000`0188bf00 00000000`0188b280
00000000`0188bf08 001b457f`0002dfff
00000000`0188bf10 00000000`77891142 ntdll!RtlpAllocateHeap+0x33bd
00000000`0188bf18 00000000`778834d8 ntdll!RtlAllocateHeap+0x16c
00000000`0188bf20 00000001`3fcc13cb AllocFree!malloc+0x5b
00000000`0188bf28 00000001`3fcc1015 AllocFree!foo20+0x15
00000000`0188bf30 00000001`3fcc1041 AllocFree!foo19+0x11
00000000`0188bf38 00000001`3fcc1061 AllocFree!foo18+0x11
00000000`0188bf40 00000001`3fcc1081 AllocFree!foo17+0x11
00000000`0188bf48 00000001`3fcc10a1 AllocFree!foo16+0x11
00000000`0188bf50 00000001`3fcc10c1 AllocFree!foo15+0x11
00000000`0188bf58 00000001`3fcc10e1 AllocFree!foo14+0x11
00000000`0188bf60 00000001`3fcc1101 AllocFree!foo13+0x11
00000000`0188bf68 00000001`3fcc1121 AllocFree!foo12+0x11
00000000`0188bf70 00000001`3fcc1141 AllocFree!foo11+0x11
00000000`0188bf78 00000001`3fcc1161 AllocFree!foo10+0x11
00000000`0188bf80 00000001`3fcc1181 AllocFree!foo9+0x11
00000000`0188bf88 00000001`3fcc11a1 AllocFree!foo8+0x11
00000000`0188bf90 00000001`3fcc11c1 AllocFree!foo7+0x11
00000000`0188bf98 00000001`3fcc11e1 AllocFree!foo6+0x11
00000000`0188bfa0 00000001`3fcc1201 AllocFree!foo5+0x11
00000000`0188bfa8 00000001`3fcc1221 AllocFree!foo4+0x11
00000000`0188bfb0 00000001`3fcc1241 AllocFree!foo3+0x11
00000000`0188bfb8 00000001`3fcc1261 AllocFree!foo2+0x11
00000000`0188bfc0 00000001`3fcc1281 AllocFree!foo1+0x11
00000000`0188bfc8 00000001`3fcc12e3 AllocFree!wmain+0x53
00000000`0188bfd0 00000001`3fcc156c AllocFree!__tmainCRTStartup+0x144
00000000`0188bfd8 00000000`777259ed kernel32!BaseThreadInitThunk+0xd
00000000`0188bfe0 00000000`7785c541 ntdll!RtlUserThreadStart+0x1d
00000000`0188bfe8 00000000`00000000
00000000`0188bff0 00000000`00000000
00000000`0188bff8 00000000`00000000

- Dmitry Vostokov @ DumpAnalysis.org + TraceAnalysis.org -
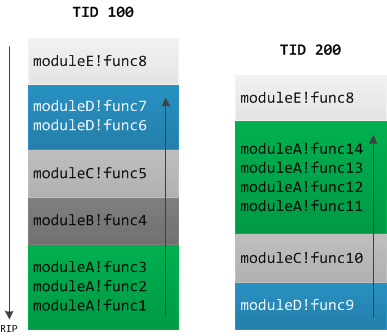
Crash Dump Analysis Patterns (Part 42m)

October 23rd, 2014

Most if not all Wait Chain patterns are about waiting for some synchronization objects. Stack Traces of involved threads may point to Blocking and Top modules. In some situations we may consider a module (which functions were called) itself as a pseudo-synchronization object where a module (who called it) is waiting for it to return back (to become “signaled”). All this is problem and context dependent where some intermediate modules may be Pass Through or Well-Tested. When we see module inversion, such as in the case of callbacks we may provisionally suspect some kind of a deadlock and then investigate these threads in terms of synchronization objects or their corresponding source code:

- Dmitry Vostokov @ DumpAnalysis.org + TraceAnalysis.org -
Crash Dump Analysis Patterns (Part 25d)

October 21st, 2014

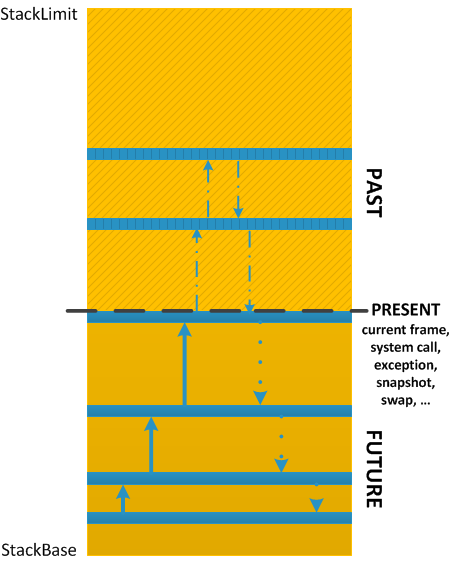
Some troubleshooting and debugging techniques involve saving every Stack Trace that leads to a specific action such as a memory allocation of opening of a resource handle to be saved in some region in memory, called stack trace database. Typical pattern usage examples include Process Heap Memory Leak, Insufficient Memory due to Handle Leak. Typical entry in such a database consists of return addresses saved during function calls (which may be Truncated Stack Trace):

00000000`00325da0 000007fe`fd5e37aa KERNELBASE!InitializeCriticalSectionAndSpinCount+0xa
00000000`00325da8 00000001`3fd72239 AllocFree!_ioinit+0×2cd
00000000`00325db0 00000001`3fd71115 AllocFree!__tmainCRTStartup+0xc5
00000000`00325db8 00000000`773759ed kernel32!BaseThreadInitThunk+0xd
00000000`00325dc0 00000000`774ac541 ntdll!RtlUserThreadStart+0×1d

0:001> ub 00000001`3fd72239
AllocFree!_ioinit+0×2af:
00000001`3fd7221b cmp eax,3
00000001`3fd7221e jne AllocFree!_ioinit+0×2be (00000001`3fd7222a)
00000001`3fd72220 movsx eax,byte ptr [rbx+8]
00000001`3fd72224 or eax,8
00000001`3fd72227 mov byte ptr [rbx+8],al
00000001`3fd7222a lea rcx,[rbx+10h]
00000001`3fd7222e mov edx,0FA0h
00000001`3fd72233 call qword ptr [AllocFree!_imp_InitializeCriticalSectionAndSpinCount (00000001`3fd78090)

This slightly differs from ‘k’-style stack trace format where the return address belongs to the function on the next line if moving downwards:

0:000> k
Child-SP RetAddr Call Site
00000000`002ff9f8 000007fe`fd5e1203 ntdll!ZwDelayExecution+0xa
00000000`002ffa00 00000001`3fd71018 KERNELBASE!SleepEx+0xab
00000000`002ffaa0 00000001`3fd71194 AllocFree!wmain+0×18
00000000`002ffad0 00000000`773759ed AllocFree!__tmainCRTStartup+0×144
00000000`002ffb10 00000000`774ac541 kernel32!BaseThreadInitThunk+0xd
00000000`002ffb40 00000000`00000000 ntdll!RtlUserThreadStart+0×1d

0:000> ub 00000001`3fd71194
AllocFree!__tmainCRTStartup+0×11b:
00000001`3fd7116b je AllocFree!__tmainCRTStartup+0×124 (00000001`3fd71174)
00000001`3fd7116d mov ecx,eax
00000001`3fd7116f call AllocFree!_amsg_exit (00000001`3fd718ec)
00000001`3fd71174 mov r8,qword ptr [AllocFree!_wenviron (00000001`3fd80868)]
00000001`3fd7117b mov qword ptr [AllocFree!__winitenv (00000001`3fd80890)],r8
00000001`3fd71182 mov rdx,qword ptr [AllocFree!__wargv (00000001`3fd80858)]
00000001`3fd71189 mov ecx,dword ptr [AllocFree!__argc (00000001`3fd8084c)]
00000001`3fd7118f call AllocFree!wmain (00000001`3fd71000)

Sometimes we can see such traces as Execution Residue inside a stack or some other region. If user mode stack trace database is enabled in gflags.exe we might be able to dump the specific database region:

0:001> !gflag
Current NtGlobalFlag contents: 0x00001000
ust - Create user mode stack trace database

0:001> !address
[...]
BaseAddress  EndAddress+1 RegionSize Type        State       Protect        Usage
------------------------------------------------------------------------------------------------------------------------
[...]
+ 0`00300000 0`00326000   0`00026000 MEM_PRIVATE MEM_COMMIT  PAGE_READWRITE Other [Stack Trace Database]
0`00326000 0`01aff000   0`017d9000 MEM_PRIVATE MEM_RESERVE                Other [Stack Trace Database]
0`01aff000 0`01b00000   0`00001000 MEM_PRIVATE MEM_COMMIT  PAGE_READWRITE Other [Stack Trace Database]
[…]

0:001> dps 0`00326000-1000 0`00326000
[…]
00000000`003257e0 00000000`00000000
00000000`003257e8 00030001`00001801
00000000`003257f0 00000000`774c34eb ntdll!LdrpInitializeProcess+0×7e6
00000000`003257f8 00000000`774c1937 ntdll! ?? ::FNODOBFM::`string’+0×28ff0
00000000`00325800 00000000`774ac34e ntdll!LdrInitializeThunk+0xe
00000000`00325808 00000000`00000000
00000000`00325810 00000000`00000000
00000000`00325818 00030002`00001801
00000000`00325820 00000000`774c3511 ntdll!LdrpInitializeProcess+0×80c
00000000`00325828 00000000`774c1937 ntdll! ?? ::FNODOBFM::`string’+0×28ff0
00000000`00325830 00000000`774ac34e ntdll!LdrInitializeThunk+0xe
00000000`00325838 00000000`00000000
00000000`00325840 00000000`00000000
00000000`00325848 00040003`00001801
00000000`00325850 00000000`774bda86 ntdll!RtlCreateHeap+0×506
00000000`00325858 00000000`774c3557 ntdll!LdrpInitializeProcess+0×851
00000000`00325860 00000000`774c1937 ntdll! ?? ::FNODOBFM::`string’+0×28ff0
00000000`00325868 00000000`774ac34e ntdll!LdrInitializeThunk+0xe
00000000`00325870 00000000`00000000
00000000`00325878 00050004`00002801
00000000`00325880 00000000`7751998a ntdll! ?? ::FNODOBFM::`string’+0xdc1a
00000000`00325888 00000000`774bdaee ntdll!RtlCreateHeap+0×56e
00000000`00325890 00000000`774c3557 ntdll!LdrpInitializeProcess+0×851
00000000`00325898 00000000`774c1937 ntdll! ?? ::FNODOBFM::`string’+0×28ff0
00000000`003258a0 00000000`774ac34e ntdll!LdrInitializeThunk+0xe
00000000`003258a8 00000000`00000000
00000000`003258b0 00000000`00000000
00000000`003258b8 00030005`00001801
00000000`003258c0 00000000`774c359e ntdll!LdrpInitializeProcess+0×902
00000000`003258c8 00000000`774c1937 ntdll! ?? ::FNODOBFM::`string’+0×28ff0
00000000`003258d0 00000000`774ac34e ntdll!LdrInitializeThunk+0xe
00000000`003258d8 00000000`00000000
00000000`003258e0 00000000`00000000
00000000`003258e8 00030006`00001801
00000000`003258f0 00000000`774c35af ntdll!LdrpInitializeProcess+0×913
00000000`003258f8 00000000`774c1937 ntdll! ?? ::FNODOBFM::`string’+0×28ff0
00000000`00325900 00000000`774ac34e ntdll!LdrInitializeThunk+0xe
00000000`00325908 00000000`00000000
00000000`00325910 00000000`00000000
00000000`00325918 00090007`00004801
00000000`00325920 00000000`774bda86 ntdll!RtlCreateHeap+0×506
00000000`00325928 00000000`774c47ff ntdll!CsrpConnectToServer+0×41f
00000000`00325930 00000000`774c43c5 ntdll!CsrClientConnectToServer+0×230
00000000`00325938 000007fe`fd5ee232 KERNELBASE!KernelBaseDllInitialize+0×148
00000000`00325940 00000000`774bb108 ntdll!LdrpRunInitializeRoutines+0×1fe
00000000`00325948 00000000`774c42fd ntdll!LdrGetProcedureAddressEx+0×2aa
00000000`00325950 00000000`774c1ddc ntdll!LdrpInitializeProcess+0×1a0b
00000000`00325958 00000000`774c1937 ntdll! ?? ::FNODOBFM::`string’+0×28ff0
00000000`00325960 00000000`774ac34e ntdll!LdrInitializeThunk+0xe
00000000`00325968 00000000`00000000
00000000`00325970 00000000`00000000
00000000`00325978 000a0008`00004801
00000000`00325980 00000000`7751998a ntdll! ?? ::FNODOBFM::`string’+0xdc1a
00000000`00325988 00000000`774bdaee ntdll!RtlCreateHeap+0×56e
00000000`00325990 00000000`774c47ff ntdll!CsrpConnectToServer+0×41f
00000000`00325998 00000000`774c43c5 ntdll!CsrClientConnectToServer+0×230
00000000`003259a0 000007fe`fd5ee232 KERNELBASE!KernelBaseDllInitialize+0×148
00000000`003259a8 00000000`774bb108 ntdll!LdrpRunInitializeRoutines+0×1fe
00000000`003259b0 00000000`774c42fd ntdll!LdrGetProcedureAddressEx+0×2aa
00000000`003259b8 00000000`774c1ddc ntdll!LdrpInitializeProcess+0×1a0b
00000000`003259c0 00000000`774c1937 ntdll! ?? ::FNODOBFM::`string’+0×28ff0
00000000`003259c8 00000000`774ac34e ntdll!LdrInitializeThunk+0xe
00000000`003259d0 00000000`00000000
00000000`003259d8 00080009`00003801
00000000`003259e0 000007fe`fd5edf81 KERNELBASE!NlsProcessInitialize+0×11
00000000`003259e8 000007fe`fd604439 KERNELBASE!BaseNlsDllInitialize+0×29
00000000`003259f0 000007fe`fd5ee446 KERNELBASE!KernelBaseDllInitialize+0×40c
00000000`003259f8 00000000`774bb108 ntdll!LdrpRunInitializeRoutines+0×1fe
00000000`00325a00 00000000`774c42fd ntdll!LdrGetProcedureAddressEx+0×2aa
00000000`00325a08 00000000`774c1ddc ntdll!LdrpInitializeProcess+0×1a0b
00000000`00325a10 00000000`774c1937 ntdll! ?? ::FNODOBFM::`string’+0×28ff0
00000000`00325a18 00000000`774ac34e ntdll!LdrInitializeThunk+0xe
00000000`00325a20 00000000`00000000
00000000`00325a28 0008000a`00003801
00000000`00325a30 000007fe`fd5edfa0 KERNELBASE!NlsProcessInitialize+0×30
00000000`00325a38 000007fe`fd604439 KERNELBASE!BaseNlsDllInitialize+0×29
00000000`00325a40 000007fe`fd5ee446 KERNELBASE!KernelBaseDllInitialize+0×40c
00000000`00325a48 00000000`774bb108 ntdll!LdrpRunInitializeRoutines+0×1fe
00000000`00325a50 00000000`774c42fd ntdll!LdrGetProcedureAddressEx+0×2aa
00000000`00325a58 00000000`774c1ddc ntdll!LdrpInitializeProcess+0×1a0b
00000000`00325a60 00000000`774c1937 ntdll! ?? ::FNODOBFM::`string’+0×28ff0
00000000`00325a68 00000000`774ac34e ntdll!LdrInitializeThunk+0xe
00000000`00325a70 00000000`00000000
00000000`00325a78 0007000b`00003801
00000000`00325a80 000007fe`fd604a21 KERNELBASE!BasepInitComputerNameCache+0×11
00000000`00325a88 000007fe`fd603d20 KERNELBASE!KernelBaseDllInitialize+0×419
00000000`00325a90 00000000`774bb108 ntdll!LdrpRunInitializeRoutines+0×1fe
00000000`00325a98 00000000`774c42fd ntdll!LdrGetProcedureAddressEx+0×2aa
00000000`00325aa0 00000000`774c1ddc ntdll!LdrpInitializeProcess+0×1a0b
00000000`00325aa8 00000000`774c1937 ntdll! ?? ::FNODOBFM::`string’+0×28ff0
00000000`00325ab0 00000000`774ac34e ntdll!LdrInitializeThunk+0xe
00000000`00325ab8 00000000`00000000
00000000`00325ac0 00000000`00000000
00000000`00325ac8 0006000c`00002801
00000000`00325ad0 00000000`77375699 kernel32!BaseDllInitialize+0×2f9
00000000`00325ad8 00000000`774bb108 ntdll!LdrpRunInitializeRoutines+0×1fe
00000000`00325ae0 00000000`774c42fd ntdll!LdrGetProcedureAddressEx+0×2aa
00000000`00325ae8 00000000`774c1ddc ntdll!LdrpInitializeProcess+0×1a0b
00000000`00325af0 00000000`774c1937 ntdll! ?? ::FNODOBFM::`string’+0×28ff0
00000000`00325af8 00000000`774ac34e ntdll!LdrInitializeThunk+0xe
00000000`00325b00 00000000`00000000
00000000`00325b08 0007000d`00003801
00000000`00325b10 00000000`773771f7 kernel32!InitializeConsoleConnectionInfo+0xe7
00000000`00325b18 00000000`773756ae kernel32!BaseDllInitialize+0×30e
00000000`00325b20 00000000`774bb108 ntdll!LdrpRunInitializeRoutines+0×1fe
00000000`00325b28 00000000`774c42fd ntdll!LdrGetProcedureAddressEx+0×2aa
00000000`00325b30 00000000`774c1ddc ntdll!LdrpInitializeProcess+0×1a0b
00000000`00325b38 00000000`774c1937 ntdll! ?? ::FNODOBFM::`string’+0×28ff0
00000000`00325b40 00000000`774ac34e ntdll!LdrInitializeThunk+0xe
00000000`00325b48 00000000`00000000
00000000`00325b50 00000000`00000000
00000000`00325b58 0009000e`00004801
00000000`00325b60 00000000`774bda86 ntdll!RtlCreateHeap+0×506
00000000`00325b68 00000000`773787f7 kernel32!ConsoleConnect+0×1d7
00000000`00325b70 00000000`773770de kernel32!ConnectConsoleInternal+0×147
00000000`00325b78 00000000`773756fe kernel32!BaseDllInitialize+0×35e
00000000`00325b80 00000000`774bb108 ntdll!LdrpRunInitializeRoutines+0×1fe
00000000`00325b88 00000000`774c42fd ntdll!LdrGetProcedureAddressEx+0×2aa
00000000`00325b90 00000000`774c1ddc ntdll!LdrpInitializeProcess+0×1a0b
00000000`00325b98 00000000`774c1937 ntdll! ?? ::FNODOBFM::`string’+0×28ff0
00000000`00325ba0 00000000`774ac34e ntdll!LdrInitializeThunk+0xe
00000000`00325ba8 00000000`00000000
00000000`00325bb0 00000000`00000000
00000000`00325bb8 000a000f`00004801
00000000`00325bc0 00000000`7751998a ntdll! ?? ::FNODOBFM::`string’+0xdc1a
00000000`00325bc8 00000000`774bdaee ntdll!RtlCreateHeap+0×56e
00000000`00325bd0 00000000`773787f7 kernel32!ConsoleConnect+0×1d7
00000000`00325bd8 00000000`773770de kernel32!ConnectConsoleInternal+0×147
00000000`00325be0 00000000`773756fe kernel32!BaseDllInitialize+0×35e
00000000`00325be8 00000000`774bb108 ntdll!LdrpRunInitializeRoutines+0×1fe
00000000`00325bf0 00000000`774c42fd ntdll!LdrGetProcedureAddressEx+0×2aa
00000000`00325bf8 00000000`774c1ddc ntdll!LdrpInitializeProcess+0×1a0b
00000000`00325c00 00000000`774c1937 ntdll! ?? ::FNODOBFM::`string’+0×28ff0
00000000`00325c08 00000000`774ac34e ntdll!LdrInitializeThunk+0xe
00000000`00325c10 00000000`00000000
00000000`00325c18 00060010`00002801
00000000`00325c20 00000000`773757dc kernel32!BaseDllInitialize+0×43c
00000000`00325c28 00000000`774bb108 ntdll!LdrpRunInitializeRoutines+0×1fe
00000000`00325c30 00000000`774c42fd ntdll!LdrGetProcedureAddressEx+0×2aa
00000000`00325c38 00000000`774c1ddc ntdll!LdrpInitializeProcess+0×1a0b
00000000`00325c40 00000000`774c1937 ntdll! ?? ::FNODOBFM::`string’+0×28ff0
00000000`00325c48 00000000`774ac34e ntdll!LdrInitializeThunk+0xe
00000000`00325c50 00000000`00000000
00000000`00325c58 00060011`00002801
00000000`00325c60 00000000`7737582c kernel32!BaseDllInitialize+0×48c
00000000`00325c68 00000000`774bb108 ntdll!LdrpRunInitializeRoutines+0×1fe
00000000`00325c70 00000000`774c42fd ntdll!LdrGetProcedureAddressEx+0×2aa
00000000`00325c78 00000000`774c1ddc ntdll!LdrpInitializeProcess+0×1a0b
00000000`00325c80 00000000`774c1937 ntdll! ?? ::FNODOBFM::`string’+0×28ff0
00000000`00325c88 00000000`774ac34e ntdll!LdrInitializeThunk+0xe
00000000`00325c90 00000000`00000000
00000000`00325c98 00060012`0000280e
00000000`00325ca0 000007fe`fd5e37aa KERNELBASE!InitializeCriticalSectionAndSpinCount+0xa
00000000`00325ca8 00000001`3fd7319f AllocFree!_mtinitlocks+0×43
00000000`00325cb0 00000001`3fd717fc AllocFree!_mtinit+0×10
00000000`00325cb8 00000001`3fd710e4 AllocFree!__tmainCRTStartup+0×94
00000000`00325cc0 00000000`773759ed kernel32!BaseThreadInitThunk+0xd
00000000`00325cc8 00000000`774ac541 ntdll!RtlUserThreadStart+0×1d
00000000`00325cd0 00000000`00000000
00000000`00325cd8 000b0013`00005801
00000000`00325ce0 00000000`774c1131 ntdll!RtlpActivateLowFragmentationHeap+0×181
00000000`00325ce8 00000000`774c0f97 ntdll!RtlpPerformHeapMaintenance+0×27
00000000`00325cf0 00000000`774c0f5b ntdll!RtlpAllocateHeap+0×1819
00000000`00325cf8 00000000`774d34d8 ntdll!RtlAllocateHeap+0×16c
00000000`00325d00 00000000`774a9300 ntdll!RtlInitializeCriticalSectionAndSpinCount+0×183
00000000`00325d08 000007fe`fd5e37aa KERNELBASE!InitializeCriticalSectionAndSpinCount+0xa
00000000`00325d10 00000001`3fd7319f AllocFree!_mtinitlocks+0×43
00000000`00325d18 00000001`3fd717fc AllocFree!_mtinit+0×10
00000000`00325d20 00000001`3fd710e4 AllocFree!__tmainCRTStartup+0×94
00000000`00325d28 00000000`773759ed kernel32!BaseThreadInitThunk+0xd
00000000`00325d30 00000000`774ac541 ntdll!RtlUserThreadStart+0×1d
00000000`00325d38 00000000`00000000
00000000`00325d40 00000000`00000000
00000000`00325d48 00070014`00003801
00000000`00325d50 000007fe`fd5e37aa KERNELBASE!InitializeCriticalSectionAndSpinCount+0xa
00000000`00325d58 00000001`3fd7312f AllocFree!_mtinitlocknum+0×8f
00000000`00325d60 00000001`3fd72ff7 AllocFree!_lock+0×23
00000000`00325d68 00000001`3fd71f9b AllocFree!_ioinit+0×2f
00000000`00325d70 00000001`3fd71115 AllocFree!__tmainCRTStartup+0xc5
00000000`00325d78 00000000`773759ed kernel32!BaseThreadInitThunk+0xd
00000000`00325d80 00000000`774ac541 ntdll!RtlUserThreadStart+0×1d
00000000`00325d88 00000000`00000000
00000000`00325d90 00000000`00000000
00000000`00325d98 00050015`00002803
00000000`00325da0 000007fe`fd5e37aa KERNELBASE!InitializeCriticalSectionAndSpinCount+0xa
00000000`00325da8 00000001`3fd72239 AllocFree!_ioinit+0×2cd
00000000`00325db0 00000001`3fd71115 AllocFree!__tmainCRTStartup+0xc5
00000000`00325db8 00000000`773759ed kernel32!BaseThreadInitThunk+0xd
00000000`00325dc0 00000000`774ac541 ntdll!RtlUserThreadStart+0×1d
00000000`00325dc8 00000000`00000000
00000000`00325dd0 00000000`00000000
[…]

This database corresponds to this simple program:

int _tmain(int argc, _TCHAR* argv[])
{
    free(malloc(256));
    Sleep(-1);
    return 0;
}

- Dmitry Vostokov @ DumpAnalysis.org + TraceAnalysis.org -
Crash Dump Analysis Patterns (Part 25c)

October 12th, 2014

Sometimes threads related to file system operations may be blocked with not easily recognizable 3rd-party Top Module with only OS vendor modules such as NTFS or fltmgr present:

nt!KiSwapContext+0x7a
nt!KiCommitThreadWait+0x1d2
nt!KeWaitForSingleObject+0x19f
nt!FsRtlCancellableWaitForMultipleObjects+0x5e
nt!FsRtlCancellableWaitForSingleObject+0x27
fltmgr! ?? ::FNODOBFM::`string’+0×2bfa
fltmgr!FltpCreate+0×2a9

nt!IopParseDevice+0×14d3
nt!ObpLookupObjectName+0×588
nt!ObOpenObjectByName+0×306
nt!IopCreateFile+0×2bc
nt!NtCreateFile+0×78
nt!KiSystemServiceCopyEnd+0×13
ntdll!NtCreateFile+0xa
[…]

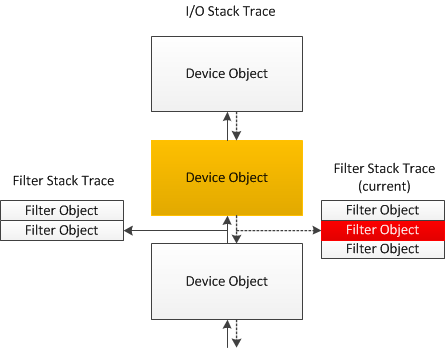
We see the same modules in I/O Request Stack Trace from the thread IRP. But because we see filter manager involved there may be some 3rd-party file system filters involved. Such filters are called before a device processes a request and also upon the completion of the request. There may be different filter callbacks registered for each case and they form a similar structure like I/O stack locations (we call this pattern Filter Stack Trace):

If one of such filters is blocked in a wait chain this may not be visible on I/O request or thread stacks because of possible asynchronous processing. But we may use !fltkd.irpctrl debugging extension command to examine the IRP context:

0: kd> !irp fffffa80162aa230
cmd flg cl Device File Completion-Context
[...]
[ 0, 0] 0 0 fffffa800cb28030 00000000 fffff880012048f0-fffffa8016f64010
\FileSystem\Ntfs fltmgr!FltpSynchronizedOperationCompletion
Args: 00000000 00000000 00000000 00000000
>[ 0, 0] 0 1 fffffa800ca00890 fffffa801060d070 00000000-00000000 pending
\FileSystem\FltMgr
Args: fffff88014450868 02000060 00000006 00000000

0: kd> !fltkd.irpctrl fffffa8016f64010
[...]
Cmd IrpFl OpFl CmpFl Instance FileObjt Completion-Context Node Adr
--------- -------- ----- ----- -------- -------- ------------------ --------
[0,0] 00000884 00 0000 fffffa800d29c010 fffffa801060d070 fffff8800518b474-0000000000000000 fffffa8016f641e0
("luafv","luafv") luafv!LuafvPostCreate
Args: fffff88014450868 0000000002000060 0000000000000006 0000000000000000 0000000000000000 0000000000000000
>[0,0] 00000884 00 0000 fffffa800e8051d0 fffffa801060d070 fffff88006808440-0000000000000000 fffffa8016f64160
(”3rdPartyFilter”,”3rdPartyFilter Instance”) FilterA!FltDriver_PostOperationCallback
Args: fffff88014450868 0000000002000060 0000000000000006 0000000000000000 0000000000000000 0000000000000000

[…]

So we see that FilterA module may be involved in blocking the thread (Blocking Module pattern extended to I/O request and filter stack traces).

- Dmitry Vostokov @ DumpAnalysis.org + TraceAnalysis.org -
Crash Dump Analysis Patterns (Part 25b)

October 12th, 2014

If a thread has an associated I/O Request Packet (IRP) we may see another type of a stack trace we call I/O Request Stack Trace. It also grows bottom-up as can be seen on the diagram 3. We can see this stack trace by using !irp WinDbg command:

0: kd> !thread fffffa801827a4c0 3f
THREAD fffffa801827a4c0 Cid 06c0.50cc Teb: 000007ffffec8000 Win32Thread: fffff900c1c64010 WAIT: (Executive) KernelMode Alertable
fffffa8016f64028 SynchronizationEvent
IRP List:
fffffa80162aa230: (0006,03a0) Flags: 00000884 Mdl: 00000000
[…]
nt!KiSwapContext+0×7a
nt!KiCommitThreadWait+0×1d2
nt!KeWaitForSingleObject+0×19f
nt!FsRtlCancellableWaitForMultipleObjects+0×5e
nt!FsRtlCancellableWaitForSingleObject+0×27
fltmgr! ?? ::FNODOBFM::`string’+0×2bfa
fltmgr!FltpCreate+0×2a9
nt!IopParseDevice+0×14d3
nt!ObpLookupObjectName+0×588
nt!ObOpenObjectByName+0×306
nt!IopCreateFile+0×2bc
nt!NtCreateFile+0×78
nt!KiSystemServiceCopyEnd+0×13
ntdll!NtCreateFile+0xa
[…]

0: kd> !irp fffffa80162aa230
Irp is active with 10 stacks 10 is current (= 0xfffffa80162aa588)
No Mdl: No System Buffer: Thread fffffa801827a4c0: Irp stack trace.
cmd flg cl Device File Completion-Context
[ 0, 0] 0 0 00000000 00000000 00000000-00000000

Args: 00000000 00000000 00000000 00000000
[ 0, 0] 0 0 00000000 00000000 00000000-00000000

Args: 00000000 00000000 00000000 00000000
[ 0, 0] 0 0 00000000 00000000 00000000-00000000

Args: 00000000 00000000 00000000 00000000
[ 0, 0] 0 0 00000000 00000000 00000000-00000000

Args: 00000000 00000000 00000000 00000000
[ 0, 0] 0 0 00000000 00000000 00000000-00000000

Args: 00000000 00000000 00000000 00000000
[ 0, 0] 0 0 00000000 00000000 00000000-00000000

Args: 00000000 00000000 00000000 00000000
[ 0, 0] 0 0 00000000 00000000 00000000-00000000

Args: 00000000 00000000 00000000 00000000
[ 0, 0] 0 0 00000000 00000000 00000000-00000000

Args: 00000000 00000000 00000000 00000000
[ 0, 0] 0 0 fffffa800cb28030 00000000 fffff880012048f0-fffffa8016f64010
\FileSystem\Ntfs fltmgr!FltpSynchronizedOperationCompletion
Args: 00000000 00000000 00000000 00000000

>[ 0, 0] 0 1 fffffa800ca00890 fffffa801060d070 00000000-00000000 pending
\FileSystem\FltMgr
Args: fffff88014450868 02000060 00000006 00000000

We see the current stack trace pointer points to the bottom I/O stack location. Non-empty top locations are analogous to Past Stack Trace. Further exploration of Device and File column information may point to further troubleshooting directions such as the Blocking File pattern example.

By analogy with Stack Trace Collection pattern that dumps stack traces from all threads based on memory dump type there is also I/O Stack Trace Collection pattern that dumps I/O request stack traces from all IRPs that were possible to find.

- Dmitry Vostokov @ DumpAnalysis.org + TraceAnalysis.org -

Crash Dump Analysis Patterns (Part 214)

October 8th, 2014

When we look at a stack trace in a memory dump we see only the current thread execution snapshot of function calls. Consider this stack trace, for example, from Spiking Thread:

0:000> k
Child-SP RetAddr  Call Site
00000000`0012d010 00000000`76eb59ed App!WinMain+0x1eda
00000000`0012f7c0 00000000`770ec541 kernel32!BaseThreadInitThunk+0xd
00000000`0012f7f0 00000000`00000000 ntdll!RtlUserThreadStart+0x1d

By looking at Rough Stack Trace we may be able to reconstruct Past Stack Trace of what had happened just before the memory snapshot was taken:

0:000> k
Child-SP RetAddr  Call Site
00000000`0012cfd8 00000000`76fd9e9e user32!ZwUserGetMessage+0xa
00000000`0012cfe0 00000000`ffd91a8c user32!GetMessageW+0x34
00000000`0012d010 00000000`76eb59ed App!WinMain+0x1dca
00000000`0012f7c0 00000000`770ec541 kernel32!BaseThreadInitThunk+0xd
00000000`0012f7f0 00000000`00000000 ntdll!RtlUserThreadStart+0x1d

The stack region “time” zones are illustrated on the following picture:

The “Future” zone takes its name from the not yet executed returns. Of course, each stack subtrace generates its own partition. A similar version of this pattern was first introduced in Debugging TV Frames episode 0×24. You watch the video here and can find source code, WinDbg logs, and presentation here.

- Dmitry Vostokov @ DumpAnalysis.org + TraceAnalysis.org -
Crash Dump Analysis Patterns (Part 213)

October 7th, 2014

Rough Stack Trace is an example of more general Execution Residue pattern or Caller-n-Callee for managed space. It’s just a collection of symbolic references (may also include Coincidental Symbolic Information) from the thread stack region or its fragment. In WinDbg we can get it by using dpS command:

0:003> !teb
TEB at 000007fffffd6000
ExceptionList:        0000000000000000
StackBase:            0000000002450000
StackLimit:           000000000244b000
SubSystemTib:         0000000000000000
FiberData:            0000000000001e00
ArbitraryUserPointer: 0000000000000000
Self:                 000007fffffd6000
EnvironmentPointer:   0000000000000000
ClientId:             00000000000047fc . 0000000000004824
RpcHandle:            0000000000000000
Tls Storage:          000007fffffd6058
PEB Address:          000007fffffda000
LastErrorValue:       0
LastStatusValue:      c0000302
Count Owned Locks:    0
HardErrorMode:        0

0:003> dpS 000000000244b000 0000000002450000
000007fe`fd4a8a2e ole32!InternalVerifyStackAvailable+0x44 [d:\winmain\minio\safealloca\alloca.c @ 317]
00000000`771d5430 ntdll!RtlpInterceptorRoutines
00000000`771134d8 ntdll!RtlAllocateHeap+0x16c
00000000`770ec9c3 ntdll!RtlAppendUnicodeStringToString+0x53
00000000`76eaebe5 kernel32!Wow64RedirectKeyPathInternal+0x2b7
00000000`770ec9c3 ntdll!RtlAppendUnicodeStringToString+0x53
00000000`771140fd ntdll!RtlFreeHeap+0x1a6
00000000`76eaec01 kernel32!ConstructKernelKeyPath+0x15f
00000000`76eaedd3 kernel32!Wow64NtOpenKey+0xee
00000000`771140fd ntdll!RtlFreeHeap+0x1a6
00000000`76ebc8aa kernel32!BaseRegOpenClassKeyFromLocation+0x3ba
00000000`76f3edf0 kernel32!`string'
00000000`771d5430 ntdll!RtlpInterceptorRoutines
00000000`76ebc9b9 kernel32!BaseRegGetUserPrefixLength+0xea
00000000`76f3ee38 kernel32!`string'
00000000`76f3edc8 kernel32!`string'
00000000`76ebc3a8 kernel32!BaseRegGetKeySemantics+0x1b8
00000000`771150d3 ntdll!RtlNtStatusToDosError+0x27
00000000`76eb36b7 kernel32!LocalBaseRegOpenKey+0x276
000007fe`fd4b6c79 ole32!GetUnquotedPath+0x29 [d:\w7rtm\com\ole32\com\objact\dllcache.cxx @ 2256]
000007fe`fd4b7019 ole32!CClassCache::CDllPathEntry::NegotiateDllInstantiationProperties2+0x145 [d:\w7rtm\com\ole32\com\objact\dllcache.cxx @ 3092]
00000000`771d5430 ntdll!RtlpInterceptorRoutines
00000000`771134d8 ntdll!RtlAllocateHeap+0x16c
00000000`77115cc4 ntdll!RtlpAllocateHeap+0xc12
000007fe`fdc10359 usp10!CUspShapingClient::AllocMem+0x49
000007fe`fdc48942 usp10!COtlsClient::AllocMem+0x12
000007fe`fdc1d4f1 usp10!UspFreeMem+0x61
000007fe`fdc4896e usp10!COtlsClient::FreeMem+0xe
000007fe`fdc6e817 usp10!ApplyFeatures+0xa17
000007fe`fdc6f2f2 usp10!ApplyLookup+0x592
000007fe`fdc48901 usp10!COtlsClient::GetDefaultGlyphs+0x131
000007fe`fdc60100 usp10!HangulEngineGetGlyphs+0x2c0
000007fe`fdc10359 usp10!CUspShapingClient::AllocMem+0x49
000007fe`fdc48942 usp10!COtlsClient::AllocMem+0x12
000007fe`fdc10359 usp10!CUspShapingClient::AllocMem+0x49
000007fe`fdc1d4f1 usp10!UspFreeMem+0x61
000007fe`fdc48942 usp10!COtlsClient::AllocMem+0x12
000007fe`fdc1d4f1 usp10!UspFreeMem+0x61
000007fe`fdc4896e usp10!COtlsClient::FreeMem+0xe
000007fe`fdc6e817 usp10!ApplyFeatures+0xa17
000007fe`fdc6aaa8 usp10!RePositionOtlGlyphs+0x238
000007fe`fdc48901 usp10!COtlsClient::GetDefaultGlyphs+0x131
000007fe`fdc60100 usp10!HangulEngineGetGlyphs+0x2c0
000007fe`fdc48798 usp10!COtlsClient::ReleaseOtlTable+0x78
000007fe`fdc6ae85 usp10!otlResourceMgr::detach+0xc5
00000000`7717c63e ntdll!EtwEventWriteNoRegistration+0xae
000007fe`fdc48a99 usp10!COtlsClient::Release+0x49
00000000`771150d3 ntdll!RtlNtStatusToDosError+0x27
00000000`7716bd85 ntdll!WaitForWerSvc+0x85
00000000`7717b94e ntdll!WerpAllocateAndInitializeSid+0xbe
00000000`7716bd90 ntdll! ?? ::FNODOBFM::`string'
00000000`77175dcf ntdll!WerpFreeSid+0x3f
00000000`7718123d ntdll!SendMessageToWERService+0x22d
00000000`77181260 ntdll! ?? ::FNODOBFM::`string'
00000000`77182308 ntdll!ReportExceptionInternal+0xc8
000007fe`fd061430 KERNELBASE!WaitForMultipleObjectsEx+0xe8
00000000`76ec1723 kernel32!WaitForMultipleObjectsExImplementation+0xb3
00000000`76f3b5e5 kernel32!WerpReportFaultInternal+0x215
00000000`76f3b767 kernel32!WerpReportFault+0x77
00000000`76f3b7bf kernel32!BasepReportFault+0x1f
00000000`76f3b9dc kernel32!UnhandledExceptionFilter+0x1fc
00000000`77118d7e ntdll!RtlpFindUnicodeStringInSection+0x50e
00000000`771198fc ntdll!LdrpFindLoadedDll+0x10c
00000000`770e9caa ntdll!RtlDecodePointer+0x2a
00000000`770c0000 ntdll!RtlDeactivateActivationContext <PERF> (ntdll+0x0)
00000000`771e8180 ntdll!`string'+0xc040
00000000`771e818c ntdll!`string'+0xc04c
00000000`77153398 ntdll! ?? ::FNODOBFM::`string'+0x2365
00000000`770d85c8 ntdll!_C_specific_handler+0x8c
00000000`770c0000 ntdll!RtlDeactivateActivationContext <PERF> (ntdll+0x0)
00000000`770ec541 ntdll!RtlUserThreadStart+0x1d
00000000`770e9d2d ntdll!RtlpExecuteHandlerForException+0xd
00000000`77202dd0 ntdll!CsrPortMemoryRemoteDelta <PERF> (ntdll+0x142dd0)
00000000`770d91cf ntdll!RtlDispatchException+0x45a
00000000`76fadda0 kernel32!__PchSym_ <PERF> (kernel32+0x10dda0)
00000000`7711920a ntdll!RtlDosApplyFileIsolationRedirection_Ustr+0x3da
00000000`77202dd0 ntdll!CsrPortMemoryRemoteDelta <PERF> (ntdll+0x142dd0)
00000000`771e8180 ntdll!`string'+0xc040
00000000`770c0000 ntdll!RtlDeactivateActivationContext <PERF> (ntdll+0x0)
00000000`770ec541 ntdll!RtlUserThreadStart+0x1d
00000000`770c0000 ntdll!RtlDeactivateActivationContext <PERF> (ntdll+0x0)
00000000`77202dd0 ntdll!CsrPortMemoryRemoteDelta <PERF> (ntdll+0x142dd0)
00000000`771d7718 ntdll!LdrpDefaultExtension
00000000`770d852c ntdll!_C_specific_handler
00000000`771e8180 ntdll!`string'+0xc040
000007fe`ff3625c0 msctf!s_szCompClassName
000007fe`fd602790 ole32!`string'
00000000`770e7a33 ntdll!LdrpFindOrMapDll+0x138
00000000`771192a8 ntdll!LdrpApplyFileNameRedirection+0x2d3
000007fe`fd602848 ole32!`string'
00000000`771d5430 ntdll!RtlpInterceptorRoutines
00000000`77113448 ntdll!RtlAllocateHeap+0xe4
00000000`76fd88b8 user32!GetPropW+0x4d
00000000`76fd7931 user32!IsWindow+0x9
00000000`770f41c8 ntdll!RtlpReAllocateHeap+0x178
000007fe`fb601381 uxtheme!CThemeWnd::_PreDefWindowProc+0x31
00000000`76eb59e0 kernel32!BaseThreadInitThunk
00000000`ffdbdb32 calc!CTimedCalc::Start+0xa9
00000000`ffd90000 calc!CCalculatorController::CCalculatorController <PERF> (calc+0x0)
00000000`ffe0ac64 calc!_dyn_tls_init_callback <PERF> (calc+0x7ac64)
00000000`76ea0000 kernel32!TestResourceDataMatchEntry <PERF> (kernel32+0x0)
00000000`76fadda0 kernel32!__PchSym_ <PERF> (kernel32+0x10dda0)
00000000`770c0000 ntdll!RtlDeactivateActivationContext <PERF> (ntdll+0x0)
00000000`77202dd0 ntdll!CsrPortMemoryRemoteDelta <PERF> (ntdll+0x142dd0)
00000000`76fd760e user32!RealDefWindowProcW+0x5a
000007fe`fb600037 uxtheme!operator delete <PERF> (uxtheme+0x37)
00000000`77111248 ntdll!KiUserExceptionDispatch+0x2e
000007fe`fb63fb40 uxtheme!$$VProc_ImageExportDirectory
00000000`ffdbdb27 calc!CTimedCalc::WatchDogThread+0xb2
00000000`76fe76c2 user32!DefDlgProcW+0x36
00000000`76fd9bef user32!UserCallWinProcCheckWow+0x1cb
00000000`76fd9b43 user32!UserCallWinProcCheckWow+0x99
00000000`76fd9bef user32!UserCallWinProcCheckWow+0x1cb
00000000`76fd72cb user32!DispatchClientMessage+0xc3
00000000`770e46b4 ntdll!NtdllDialogWndProc_W
00000000`ffdbdb27 calc!CTimedCalc::WatchDogThread+0xb2
00000000`77101530 ntdll!NtdllDispatchMessage_W
00000000`76fe505b user32!DialogBox2+0x2ec
00000000`ffd90000 calc!CCalculatorController::CCalculatorController <PERF> (calc+0x0)
00000000`76fe4edd user32!InternalDialogBox+0x135
00000000`ffdcedb0 calc!CTimedCalc::TimeOutDlgProc
00000000`ffd90000 calc!CCalculatorController::CCalculatorController <PERF> (calc+0x0)
00000000`76fe4f52 user32!DialogBoxIndirectParamAorW+0x58
00000000`ffdcedb0 calc!CTimedCalc::TimeOutDlgProc
00000000`ffd90000 calc!CCalculatorController::CCalculatorController <PERF> (calc+0x0)
00000000`76fdd476 user32!DialogBoxParamW+0x66
00000000`ffdcedb0 calc!CTimedCalc::TimeOutDlgProc
00000000`ffdbdafa calc!CTimedCalc::WatchDogThread+0x72
00000000`76eb59ed kernel32!BaseThreadInitThunk+0xd
00000000`770ec541 ntdll!RtlUserThreadStart+0x1d
00000000`76f3b7e0 kernel32!UnhandledExceptionFilter

The name for this pattern comes from rough sets in mathematics.

- Dmitry Vostokov @ DumpAnalysis.org + TraceAnalysis.org -

Trace Analysis Patterns (Part 91)

October 6th, 2014

Sometimes the absence of messages, for example, errors and exceptions, may save time during troubleshooting and debugging by pointing to what wasn’t happening and provide additional insight. For example, on the picture below we see the same exceptions in the new and old incidents. However, in the old incident we see another exception that was linked to one unavailable server in a distributed broker architecture. Therefore, we can assume provisionally that all servers were operational when the new incident happened.

Missing Message pattern is different from Missing Component pattern where the latter may point to the component that was not loaded or executed, or simply that it wasn’t selected for tracing.

- Dmitry Vostokov @ DumpAnalysis.org + TraceAnalysis.org -

Crash Dump Analysis Patterns (Part 212)

October 5th, 2014

Although in the case of system hangs we, usually, recommend dumping Stack Trace Collection, in some cases it is very time-consuming, especially when it involves thousands of processes such as in modern terminal services environments. In such a case, if the problem description indicates the last action such as a not progressing user logon or a recently launched process we first check the tail of the corresponding linked list where Last Object is usually added to the tail of the list:

Sometimes we can simply check the end of some enumerated collection such as sessions (dotted lines represent ALPC Wait Chains):

This analysis pattern can be added to the first tier of RSDP. If nothing found around a couple of Last Objects we then resort to the analysis of entire linked lists.

- Dmitry Vostokov @ DumpAnalysis.org + TraceAnalysis.org -