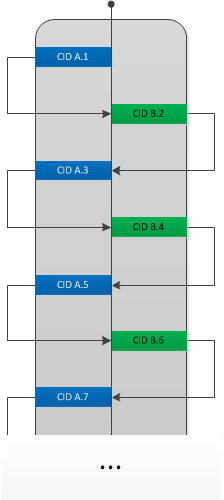
Here we provide another variant of a general Wait Chain pattern related to RtlAcquireResourceShared and RtlAcquireResourceExclusive calls:
THREAD fffffa8052d66060  Cid 03c0.3240  Teb: 000007fffff90000 Win32Thread: 0000000000000000 WAIT: (UserRequest) UserMode Non-Alertable

fffffa804a79ad50  Semaphore Limit 0x7fffffff

Impersonation token:  fffff8a01b19d060 (Level Impersonation)

DeviceMap                 fffff8a0035276c0

Owning Process            fffffa804a16b260       Image:         lsm.exe

Attached Process          N/A            Image:         N/A

Wait Start TickCount      73343513       Ticks: 1460259 (0:06:20:16.546)

Context Switch Count      17             IdealProcessor: 1

UserTime                  00:00:00.000

KernelTime                00:00:00.000

Win32 Start Address ntdll!TppWorkerThread (0x000000007735fbf0)

Stack Init fffff8800e870db0 Current fffff8800e870900

Base fffff8800e871000 Limit fffff8800e86b000 Call 0

Priority 9 BasePriority 8 UnusualBoost 0 ForegroundBoost 0 IoPriority 2 PagePriority 5

Kernel stack not resident.

Child-SP          RetAddr           Call Site

fffff880`0e870940 fffff800`01c76972 nt!KiSwapContext+0x7a

fffff880`0e870a80 fffff800`01c87d8f nt!KiCommitThreadWait+0x1d2

fffff880`0e870b10 fffff800`01f7b2be nt!KeWaitForSingleObject+0x19f

fffff880`0e870bb0 fffff800`01c801d3 nt!NtWaitForSingleObject+0xde

fffff880`0e870c20 00000000`773912fa nt!KiSystemServiceCopyEnd+0x13 (TrapFrame @ fffff880`0e870c20)

00000000`022ae6c8 00000000`773470b4 ntdll!NtWaitForSingleObject+0xa

00000000`022ae6d0 00000000`ff4013a3 ntdll!RtlAcquireResourceShared+0xd0

00000000`022ae710 00000000`ff401675 lsm!CAutoSharedLock::CAutoSharedLock+0×61

00000000`022ae7e0 00000000`ff402c68 lsm!CTSSession::getTerminal+0×21

00000000`022ae820 000007fe`fd8bff85 lsm!RpcGetEnumResult+0×202

00000000`022ae980 000007fe`fd8b4de2 RPCRT4!Invoke+0×65

00000000`022ae9e0 000007fe`fd8b17bd RPCRT4!NdrStubCall2+0×32a

00000000`022af000 000007fe`fd8b3254 RPCRT4!NdrServerCall2+0×1d

00000000`022af030 000007fe`fd8b33b6 RPCRT4!DispatchToStubInCNoAvrf+0×14

00000000`022af060 000007fe`fd8b3aa9 RPCRT4!RPC_INTERFACE::DispatchToStubWorker+0×146

00000000`022af180 000007fe`fd8b375d RPCRT4!LRPC_SCALL::DispatchRequest+0×149

00000000`022af260 000007fe`fd8d09ff RPCRT4!LRPC_SCALL::HandleRequest+0×20d

00000000`022af390 000007fe`fd8d05b5 RPCRT4!LRPC_ADDRESS::ProcessIO+0×3bf

00000000`022af4d0 00000000`7735b6bb RPCRT4!LrpcIoComplete+0xa5

00000000`022af560 00000000`7735ff2f ntdll!TppAlpcpExecuteCallback+0×26b

00000000`022af5f0 00000000`7713652d ntdll!TppWorkerThread+0×3f8

00000000`022af8f0 00000000`7736c541 kernel32!BaseThreadInitThunk+0xd

00000000`022af920 00000000`00000000 ntdll!RtlUserThreadStart+0×1d
These functions are undocumented but ReactOS source code shows they all take a pointer to RTL_RESOURCE structure which has handles to a shared and exclusive semaphores:
RTL_CRITICAL_SECTION  Lock

HANDLE  SharedSemaphore

ULONG  SharedWaiters

HANDLE  ExclusiveSemaphore

ULONG  ExclusiveWaiters

LONG  NumberActive

HANDLE  OwningThread

ULONG  TimeoutBoost

PVOID  DebugInfo
To double check that we disassemble RtlAcquireResourceShared and check the return address from NtWaitForSingleObject call (00000000`773470b4):
0: kd> .thread /r /p fffffa8052d66060

Implicit thread is now fffffa80`52d66060

Implicit process is now fffffa80`4a16b260

Loading User Symbols

..........................................
0: kd> uf ntdll!RtlAcquireResourceShared

[...]

ntdll!RtlAcquireResourceShared+0xc2:

00000000`773470a6 488b4b28        mov     rcx,qword ptr [rbx+28h]

00000000`773470aa 4c8bc6          mov     r8,rsi

00000000`773470ad 33d2            xor     edx,edx

00000000`773470af e83ca20400      call    ntdll!NtWaitForSingleObject (00000000`773912f0)

00000000`773470b4 3d02010000      cmp     eax,102h

00000000`773470b9 0f8402800600    je      ntdll! ?? ::FNODOBFM::`string’+0×12629 (00000000`773af0c1)

[…]

ntdll!RtlAcquireResourceShared:

00000000`77352af0 48895c2420      mov     qword ptr [rsp+20h],rbx

00000000`77352af5 57              push    rdi

00000000`77352af6 4883ec30        sub     rsp,30h

00000000`77352afa 448b4944        mov     r9d,dword ptr [rcx+44h]

00000000`77352afe 0fb6fa          movzx   edi,dl

00000000`77352b01 488bd9          mov     rbx,rcx

00000000`77352b04 4585c9          test    r9d,r9d

00000000`77352b07 0f88a7000000    js      ntdll!RtlAcquireResourceShared+0×65 (00000000`77352bb4)

[…]
We see the handle is taken from [RBX+28] and we see that RBX was saved at the function prologue and then the value of RCX was assigned to RBX. RCX as the first calling convention parameter should be a pointer to RTL_RESOURCE which has RTL_CRITICAL_SECTION as the first member and its size is 0×28:
0: kd> dt ntdll!_RTL_CRITICAL_SECTION

ntdll!_RTL_CRITICAL_SECTION

+0x000 DebugInfo        : Ptr64 _RTL_CRITICAL_SECTION_DEBUG

+0x008 LockCount        : Int4B

+0x00c RecursionCount   : Int4B

+0x010 OwningThread     : Ptr64 Void

+0x018 LockSemaphore    : Ptr64 Void

+0x020 SpinCount        : Uint8B
Therefore [RBX+28] contains SharedSemaphore field which is assigned to RCX as a first parameter to NtWaitForSingleObject. The similar fragment of RtlAcquireResourceExclusive has [RBX+36] which 0×10 further than 0×28 and corresponds to ExclusiveSemaphore handle field:
ntdll!RtlAcquireResourceExclusive+0xd2:

00000000`770c2a12 488b4b38        mov     rcx,qword ptr [rbx+38h]

00000000`770c2a16 4c8bc6          mov     r8,rsi

00000000`770c2a19 33d2            xor     edx,edx

00000000`770c2a1b e8d0e80400      call    ntdll!NtWaitForSingleObject (00000000`771112f0)

00000000`770c2a20 3d02010000      cmp     eax,102h

00000000`770c2a25 0f8401c60600    je      ntdll! ?? ::FNODOBFM::`string’+0×12591 (00000000`7712f02c)
So we just need to know the vale of RBX and dump the structure to find OwningThread field. We can either calculate it from RSP or use /c switch with .frame command:
0: kd> kn

*** Stack trace for last set context - .thread/.cxr resets it

# Child-SP          RetAddr           Call Site

00 fffff880`0e870940 fffff800`01c76972 nt!KiSwapContext+0x7a

01 fffff880`0e870a80 fffff800`01c87d8f nt!KiCommitThreadWait+0x1d2

02 fffff880`0e870b10 fffff800`01f7b2be nt!KeWaitForSingleObject+0x19f

03 fffff880`0e870bb0 fffff800`01c801d3 nt!NtWaitForSingleObject+0xde

04 fffff880`0e870c20 00000000`773912fa nt!KiSystemServiceCopyEnd+0x13

05 00000000`022ae6c8 00000000`773470b4 ntdll!NtWaitForSingleObject+0xa

06 00000000`022ae6d0 00000000`ff4013a3 ntdll!RtlAcquireResourceShared+0xd0

07 00000000`022ae710 00000000`ff401675 lsm!CAutoSharedLock::CAutoSharedLock+0×61

08 00000000`022ae7e0 00000000`ff402c68 lsm!CTSSession::getTerminal+0×21

09 00000000`022ae820 000007fe`fd8bff85 lsm!RpcGetEnumResult+0×202

0a 00000000`022ae980 000007fe`fd8b4de2 RPCRT4!Invoke+0×65

0b 00000000`022ae9e0 000007fe`fd8b17bd RPCRT4!NdrStubCall2+0×32a

0c 00000000`022af000 000007fe`fd8b3254 RPCRT4!NdrServerCall2+0×1d

0d 00000000`022af030 000007fe`fd8b33b6 RPCRT4!DispatchToStubInCNoAvrf+0×14

0e 00000000`022af060 000007fe`fd8b3aa9 RPCRT4!RPC_INTERFACE::DispatchToStubWorker+0×146

0f 00000000`022af180 000007fe`fd8b375d RPCRT4!LRPC_SCALL::DispatchRequest+0×149

10 00000000`022af260 000007fe`fd8d09ff RPCRT4!LRPC_SCALL::HandleRequest+0×20d

11 00000000`022af390 000007fe`fd8d05b5 RPCRT4!LRPC_ADDRESS::ProcessIO+0×3bf

12 00000000`022af4d0 00000000`7735b6bb RPCRT4!LrpcIoComplete+0xa5

13 00000000`022af560 00000000`7735ff2f ntdll!TppAlpcpExecuteCallback+0×26b

14 00000000`022af5f0 00000000`7713652d ntdll!TppWorkerThread+0×3f8

15 00000000`022af8f0 00000000`7736c541 kernel32!BaseThreadInitThunk+0xd

16 00000000`022af920 00000000`00000000 ntdll!RtlUserThreadStart+0×1d
0: kd> .frame /c 6

06 00000000`022ae6d0 00000000`ff4013a3 ntdll!RtlAcquireResourceShared+0xd0

rax=0000000000000000 rbx=00000000023ac128 rcx=0000000000000000

rdx=0000000000000000 rsi=0000000077472410 rdi=0000000000000001

rip=00000000773470b4 rsp=00000000022ae6d0 rbp=0000000000000000

r8=0000000000000000  r9=0000000000000000 r10=0000000000000000

r11=0000000000000000 r12=29406b2a1a85bd43 r13=0000000000000009

r14=000000000000000c r15=00000000022aef20

iopl=0         nv up di pl nz na pe nc

cs=0000  ss=0000  ds=0000  es=0000  fs=0000  gs=0000             efl=00000000

ntdll!RtlAcquireResourceShared+0xd0:

00000000`773470b4 3d02010000      cmp     eax,102h
0: kd> dp rbx+28 L10

00000000`023ac150  00000000`00001244 00000000`000001b5

00000000`023ac160  00000000`00000f3c ffffffff`00000000

00000000`023ac170  00000000`000021a0 00000000`00000000

00000000`023ac180  00000000`02735fc0 00000000`00000001

00000000`023ac190  00000000`00000000 01cf07ac`9fa06d27

00000000`023ac1a0  00000000`00000000 00000000`00000000

00000000`023ac1b0  ffffffff`ffffffff 00000000`00000000

00000000`023ac1c0  00000000`00000000 00000000`00000000
We check all these handles (OwnerThread seems comes earlier with NumberActive field missing but that could just differences between the old x86 structure implemented in ReactOS and x64 Windows):
0: kd> !handle 00000000`00001244
PROCESS fffffa804a16b260

SessionId: 0  Cid: 03c0    Peb: 7fffffdc000  ParentCid: 0350

DirBase: 195950000  ObjectTable: fffff8a0032424e0  HandleCount: 5252.

Image: lsm.exe
Handle table at fffff8a0032424e0 with 5252 entries in use
1244: Object: fffffa804a79ad50  GrantedAccess: 00100003 Entry: fffff8a022b39910

Object: fffffa804a79ad50  Type: (fffffa8048fc8790) Semaphore

ObjectHeader: fffffa804a79ad20 (new version)

HandleCount: 1  PointerCount: 438
0: kd> !handle 00000000`00000f3c
PROCESS fffffa804a16b260

SessionId: 0  Cid: 03c0    Peb: 7fffffdc000  ParentCid: 0350

DirBase: 195950000  ObjectTable: fffff8a0032424e0  HandleCount: 5252.

Image: lsm.exe
Handle table at fffff8a0032424e0 with 5252 entries in use
0f3c: Object: fffffa804fa81f60  GrantedAccess: 00100003 Entry: fffff8a02cd3ecf0

Object: fffffa804fa81f60  Type: (fffffa8048fc8790) Semaphore

ObjectHeader: fffffa804fa81f30 (new version)

HandleCount: 1  PointerCount: 1
0: kd> !thread -t 00000000`000021a0 3f

THREAD fffffa804d5d51b0  Cid 03c0.21a0  Teb: 000007fffff9c000 Win32Thread: 0000000000000000 WAIT: (WrLpcReply) UserMode Non-Alertable

fffffa804d5d5578  Semaphore Limit 0×1

Waiting for reply to ALPC Message fffff8a02c9a9500 : queued at port fffffa804ac4e7d0 : owned by process fffffa804adc8730

Not impersonating

DeviceMap                 fffff8a0000088c0

Owning Process            fffffa804a16b260       Image:         lsm.exe

Attached Process          N/A            Image:         N/A

Wait Start TickCount      73337319       Ticks: 1466453 (0:06:21:53.328)

Context Switch Count      69             IdealProcessor: 1

UserTime                  00:00:00.000

KernelTime                00:00:00.000

Win32 Start Address ntdll!TppWorkerThread (0×000000007735fbf0)

Stack Init fffff8800aa1fdb0 Current fffff8800aa1f600

Base fffff8800aa20000 Limit fffff8800aa1a000 Call 0

Priority 9 BasePriority 8 UnusualBoost 0 ForegroundBoost 0 IoPriority 2 PagePriority 5

Kernel stack not resident.
Child-SP          RetAddr           Call Site

fffff880`0aa1f640 fffff800`01c76972 nt!KiSwapContext+0x7a

fffff880`0aa1f780 fffff800`01c87d8f nt!KiCommitThreadWait+0x1d2

fffff880`0aa1f810 fffff800`01ca25af nt!KeWaitForSingleObject+0x19f

fffff880`0aa1f8b0 fffff800`01f968b6 nt!AlpcpSignalAndWait+0x8f

fffff880`0aa1f960 fffff800`01f95fb0 nt!AlpcpReceiveSynchronousReply+0x46

fffff880`0aa1f9c0 fffff800`01f93dab nt!AlpcpProcessSynchronousRequest+0x33d

fffff880`0aa1fb00 fffff800`01c801d3 nt!NtAlpcSendWaitReceivePort+0x1ab

fffff880`0aa1fbb0 00000000`77391b0a nt!KiSystemServiceCopyEnd+0x13 (TrapFrame @ fffff880`0aa1fc20)

00000000`01dddb48 000007fe`fd8c8306 ntdll!ZwAlpcSendWaitReceivePort+0xa

00000000`01dddb50 000007fe`fd8c2a02 RPCRT4!LRPC_CCALL::SendReceive+0x156

00000000`01dddc10 000007fe`ff5b28c0 RPCRT4!I_RpcSendReceive+0x42

00000000`01dddc40 000007fe`ff5b282f ole32!ThreadSendReceive+0x40 [d:\w7rtm\com\ole32\com\dcomrem\channelb.cxx @ 5003]

00000000`01dddc90 000007fe`ff5b265b ole32!CRpcChannelBuffer::SwitchAptAndDispatchCall+0xa3 [d:\w7rtm\com\ole32\com\dcomrem\channelb.cxx @ 4454]

00000000`01dddd30 000007fe`ff46daaa ole32!CRpcChannelBuffer::SendReceive2+0x11b [d:\w7rtm\com\ole32\com\dcomrem\channelb.cxx @ 4074]

00000000`01dddef0 000007fe`ff46da0c ole32!CAptRpcChnl::SendReceive+0x52 [d:\w7rtm\com\ole32\com\dcomrem\callctrl.cxx @ 603]

00000000`01dddfc0 000007fe`ff5b205d ole32!CCtxComChnl::SendReceive+0x68 [d:\w7rtm\com\ole32\com\dcomrem\ctxchnl.cxx @ 734]

00000000`01dde070 000007fe`fd96b949 ole32!NdrExtpProxySendReceive+0x45 [d:\w7rtm\com\rpc\ndrole\proxy.cxx @ 1932]

00000000`01dde0a0 000007fe`ff5b21d0 RPCRT4!NdrpClientCall3+0x2e2

00000000`01dde360 000007fe`ff46d8a2 ole32!ObjectStublessClient+0x11d [d:\w7rtm\com\rpc\ndrole\amd64\stblsclt.cxx @ 621]

00000000`01dde6f0 00000000`ff417d26 ole32!ObjectStubless+0x42 [d:\w7rtm\com\rpc\ndrole\amd64\stubless.asm @ 117]

00000000`01dde740 00000000`ff4186ba lsm!CTSSession::Disconnect+0x3a5

00000000`01dde810 000007fe`fd8bff85 lsm!RpcDisconnect+0x15e

00000000`01dde850 000007fe`fd96b68e RPCRT4!Invoke+0x65

00000000`01dde8a0 000007fe`fd8a92e0 RPCRT4!Ndr64StubWorker+0x61b

00000000`01ddee60 000007fe`fd8b3254 RPCRT4!NdrServerCallAll+0x40

00000000`01ddeeb0 000007fe`fd8b33b6 RPCRT4!DispatchToStubInCNoAvrf+0x14

00000000`01ddeee0 000007fe`fd8b3aa9 RPCRT4!RPC_INTERFACE::DispatchToStubWorker+0x146

00000000`01ddf000 000007fe`fd8b375d RPCRT4!LRPC_SCALL::DispatchRequest+0x149

00000000`01ddf0e0 000007fe`fd8d09ff RPCRT4!LRPC_SCALL::HandleRequest+0x20d

00000000`01ddf210 000007fe`fd8d05b5 RPCRT4!LRPC_ADDRESS::ProcessIO+0x3bf

00000000`01ddf350 00000000`7735b6bb RPCRT4!LrpcIoComplete+0xa5

00000000`01ddf3e0 00000000`7735ff2f ntdll!TppAlpcpExecuteCallback+0x26b

00000000`01ddf470 00000000`7713652d ntdll!TppWorkerThread+0x3f8

00000000`01ddf770 00000000`7736c541 kernel32!BaseThreadInitThunk+0xd

00000000`01ddf7a0 00000000`00000000 ntdll!RtlUserThreadStart+0x1d
We see the wait chain continues with waiting for an ALPC request.
- Dmitry Vostokov @ DumpAnalysis.org + TraceAnalysis.org -