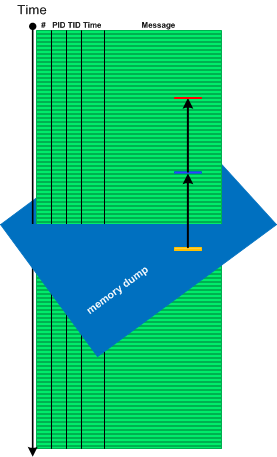
Recently we analyzed a memory dump posted in DA+TA group and posted our results there. The problem was resolved. Afterwards, we decided to look at the earlier dump that was posted for the same problem: a COM server program was unresponsive. That dump was not fully analyzed by group members so we decided to write a case study based on it since it had one more pattern.
When we open the dump in WinDbg it shows Virtualized Process (WOW64) pattern:
wow64cpu!TurboDispatchJumpAddressEnd+0x598:

00000000`77cf2772 c3              ret
We load symbols, WOW64 extension, and switch to x86 mode:
0:000> .symfix c:\mss
0:000> .reload
0:000> .load wow64exts
0:000> !sw

Switched to 32bit mode
Then we check threads in Stack Trace Collection:
0:000:x86> ~*kL
.  0  Id: 16d8.11e0 Suspend: 0 Teb: fffdc000 Unfrozen

ChildEBP RetAddr

002fb0a8 765c10fd ntdll_77d00000!NtWaitForSingleObject+0xc

002fb118 76606586 KERNELBASE!WaitForSingleObjectEx+0x99

002fb138 00499ddc KERNELBASE!GetOverlappedResult+0x9d

WARNING: Stack unwind information not available. Following frames may be wrong.

002fb1a0 005261a4 ServerA+0x99ddc

002fb1e4 005278c9 ServerA+0x1261a4

002fb454 0053bc4d ServerA+0x1278c9

002fba34 005fe5c8 ServerA+0x13bc4d

002fbe20 006094eb ServerA+0x1fe5c8

002fc40c 0060a0d7 ServerA+0x2094eb

0038ee8c 0061a0cb ServerA+0x20a0d7

0038eea4 75e65c3e ServerA+0x21a0cb

0038eed0 75edf497 rpcrt4!Invoke+0×2a

0038f55c 763b04d5 rpcrt4!NdrStubCall2+0×33c

0038f5a4 769aa572 combase!CStdStubBuffer_Invoke+0×96

0038f5c4 763b039d oleaut32!CUnivStubWrapper::Invoke+0×30

0038f650 762b3733 combase!SyncStubInvoke+0×144

(Inline) ——– combase!StubInvoke+0×9a

0038f77c 763b1198 combase!CCtxComChnl::ContextInvoke+0×222

(Inline) ——– combase!DefaultInvokeInApartment+0×4e

(Inline) ——– combase!ClassicSTAInvokeInApartment+0×103

0038f824 763b0bc2 combase!AppInvoke+0×258

0038f980 762b277e combase!ComInvokeWithLockAndIPID+0×5fb

(Inline) ——– combase!ComInvoke+0×15c

(Inline) ——– combase!ThreadDispatch+0×169

0038f9b0 75cf7834 combase!ThreadWndProc+0×2ad

0038f9dc 75cf7a9a user32!_InternalCallWinProc+0×23

0038fa6c 75cf988e user32!UserCallWinProcCheckWow+0×184

0038fad8 75d08857 user32!DispatchMessageWorker+0×208

0038fae0 0061cb88 user32!DispatchMessageA+0×10

0038ff74 0061d85a ServerA+0×21cb88

0038ff8c 7617919f ServerA+0×21d85a

0038ff98 77d4a8cb kernel32!BaseThreadInitThunk+0xe

0038ffdc 77d4a8a1 ntdll_77d00000!__RtlUserThreadStart+0×20

0038ffec 00000000 ntdll_77d00000!_RtlUserThreadStart+0×1b
1  Id: 16d8.f5c Suspend: 0 Teb: fffd9000 Unfrozen

ChildEBP RetAddr

WARNING: Frame IP not in any known module. Following frames may be wrong.

0159ff8c 7617919f 0×3b02c8

0159ff98 77d4a8cb kernel32!BaseThreadInitThunk+0xe

0159ffdc 77d4a8a1 ntdll_77d00000!__RtlUserThreadStart+0×20

0159ffec 00000000 ntdll_77d00000!_RtlUserThreadStart+0×1b
2  Id: 16d8.a88 Suspend: 0 Teb: ffe47000 Unfrozen

ChildEBP RetAddr

097cfde8 77d227d3 ntdll_77d00000!NtWaitForWorkViaWorkerFactory+0xc

097cff8c 7617919f ntdll_77d00000!TppWorkerThread+0x259

097cff98 77d4a8cb kernel32!BaseThreadInitThunk+0xe

097cffdc 77d4a8a1 ntdll_77d00000!__RtlUserThreadStart+0x20

097cffec 00000000 ntdll_77d00000!_RtlUserThreadStart+0x1b
3  Id: 16d8.ab0 Suspend: 0 Teb: fffd3000 Unfrozen

ChildEBP RetAddr

0414fde8 77d227d3 ntdll_77d00000!NtWaitForWorkViaWorkerFactory+0xc

0414ff8c 7617919f ntdll_77d00000!TppWorkerThread+0x259

0414ff98 77d4a8cb kernel32!BaseThreadInitThunk+0xe

0414ffdc 77d4a8a1 ntdll_77d00000!__RtlUserThreadStart+0x20

0414ffec 00000000 ntdll_77d00000!_RtlUserThreadStart+0x1b
4  Id: 16d8.868 Suspend: 0 Teb: ffe4d000 Unfrozen

ChildEBP RetAddr

0460fde8 77d227d3 ntdll_77d00000!NtWaitForWorkViaWorkerFactory+0xc

0460ff8c 7617919f ntdll_77d00000!TppWorkerThread+0x259

0460ff98 77d4a8cb kernel32!BaseThreadInitThunk+0xe

0460ffdc 77d4a8a1 ntdll_77d00000!__RtlUserThreadStart+0x20

0460ffec 00000000 ntdll_77d00000!_RtlUserThreadStart+0x1b
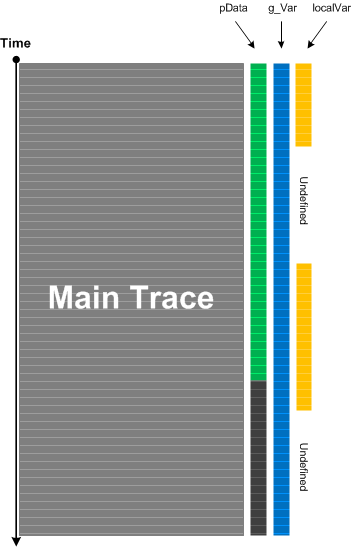
The first thread (#0) has Technology-Specific Subtrace (COM interface invocation) calling ServerA module code, and the second trace (#1) seems to be Active Thread (not waiting) having RIP Stack Trace.
However, only thread #0 seems to be Spiking Thread:
0:000:x86> !runaway f
 User Mode Time
  Thread       Time
   0:11e0      0 days 0:44:44.890
   4:868       0 days 0:00:00.000
   3:ab0       0 days 0:00:00.000
   2:a88       0 days 0:00:00.000
   1:f5c       0 days 0:00:00.000
 Kernel Mode Time
  Thread       Time
   0:11e0      0 days 0:10:38.312
   4:868       0 days 0:00:00.015
   3:ab0       0 days 0:00:00.000
   2:a88       0 days 0:00:00.000
   1:f5c       0 days 0:00:00.000
 Elapsed Time
  Thread       Time
   0:11e0      0 days 2:56:23.297
   1:f5c       0 days 2:56:22.625
   2:a88       0 days 2:54:36.883
   3:ab0       0 days 0:02:18.705
   4:868       0 days 0:01:07.372
Last Error Collection is clear but needs to be double checked by TEB32 (since we have a virtualized process):
0:000:x86> !gle

LastErrorValue: (Win32) 0 (0) - The operation completed successfully.

LastStatusValue: (NTSTATUS) 0 - STATUS_WAIT_0

Wow64 TEB status:

LastErrorValue: (Win32) 0 (0) - The operation completed successfully.

LastStatusValue: (NTSTATUS) 0 - STATUS_WAIT_0
0:000:x86> !teb
Wow64 TEB32 at 00000000fffde000
    ExceptionList:        00000000002fb108
    StackBase:            0000000000390000
    StackLimit:           0000000000255000
    SubSystemTib:         0000000000000000
    FiberData:            0000000000001e00
    ArbitraryUserPointer: 0000000000000000
    Self:                 00000000fffde000
    EnvironmentPointer:   0000000000000000
    ClientId:             00000000000016d8 . 00000000000011e0
    RpcHandle:            0000000000000000
    Tls Storage:          0000000000e12978
    PEB Address:          00000000fffdf000
    LastErrorValue:       38
    LastStatusValue:      c0000011
    Count Owned Locks:    0
    HardErrorMode:        0
Wow64 TEB at 00000000fffdc000
    ExceptionList:        00000000fffde000
    StackBase:            000000000008fd30
    StackLimit:           0000000000083000
    SubSystemTib:         0000000000000000
    FiberData:            0000000000001e00
    ArbitraryUserPointer: 0000000000000000
    Self:                 00000000fffdc000
    EnvironmentPointer:   0000000000000000
    ClientId:             00000000000016d8 . 00000000000011e0
    RpcHandle:            0000000000000000
    Tls Storage:          0000000000000000
    PEB Address:          00000000fffd6000
    LastErrorValue:       0
    LastStatusValue:      0
    Count Owned Locks:    0
    HardErrorMode:        0
From the errors we suggested to check the code dealing with EOF condition.
0:000:x86> !error 0n38

Error code: (Win32) 0x26 (38) - Reached the end of the file.
0:000:x86> !error c0000011

Error code: (NTSTATUS) 0xc0000011 (3221225489) - The end-of-file marker has been reached. There is no valid data in the file beyond this marker.
But let’s look at the thread #1 raw address and check whether we have traces of malware or JIT code or something else:
0:000:x86> ~1s
003b02c8 c20c00          ret     0Ch
0:001:x86> u 0×3b02c8
003b02c8 c20c00          ret     0Ch
003b02cb 90              nop
003b02cc cc              int     3
003b02cd cc              int     3
003b02ce cc              int     3
003b02cf cc              int     3
003b02d0 cc              int     3
003b02d1 cc              int     3
0:001:x86> ub 0x3b02c8
003b02b6 cc              int     3
003b02b7 cc              int     3
003b02b8 cc              int     3
003b02b9 cc              int     3
003b02ba cc              int     3
003b02bb cc              int     3
003b02bc b803000d00      mov     eax,0D0003h
003b02c1 64ff15c0000000  call    dword ptr fs:[0C0h]
0:001:x86> dps fs:[0C0h] L1
0053:000000c0  77cf11d8 wow64cpu!KiFastSystemCall
0:001:x86> !address 0x3b02c8
Usage:
Base Address:           003b0000
End Address:            003b1000
Region Size:            00001000
State:                  00001000	MEM_COMMIT
Protect:                00000020	PAGE_EXECUTE_READ
Type:                   00020000	MEM_PRIVATE
Allocation Base:        003b0000
Allocation Protect:     00000040	PAGE_EXECUTE_READWRITE
Dumping this executable region only shows WOW64 calls:
0:001:x86> dc 003b0000 003b1000
[...]
0:001:x86> .asm no_code_bytes
Assembly options: no_code_bytes
0:001:x86> u 003b0110 003b02e0
003b0110 add     byte ptr [eax],al
003b0112 add     byte ptr [eax],al
003b0114 add     byte ptr [eax],al
003b0116 add     byte ptr [eax],al
003b0118 mov     eax,3000Eh
003b011d call    dword ptr fs:[0C0h]
003b0124 ret     4
003b0127 nop
003b0128 int     3
003b0129 int     3
003b012a int     3
003b012b int     3
003b012c int     3
003b012d int     3
003b012e int     3
003b012f int     3
003b0130 int     3
003b0131 int     3
003b0132 int     3
003b0133 int     3
003b0134 mov     eax,32h
003b0139 call    dword ptr fs:[0C0h]
003b0140 ret     18h
003b0143 nop
003b0144 int     3
003b0145 int     3
003b0146 int     3
003b0147 int     3
003b0148 int     3
003b0149 int     3
003b014a int     3
003b014b int     3
003b014c int     3
003b014d int     3
003b014e int     3
003b014f int     3
003b0150 mov     eax,1B0006h
003b0155 call    dword ptr fs:[0C0h]
003b015c ret     28h
003b015f nop
003b0160 int     3
003b0161 int     3
003b0162 int     3
003b0163 int     3
003b0164 int     3
003b0165 int     3
003b0166 int     3
003b0167 int     3
003b0168 int     3
003b0169 int     3
003b016a int     3
003b016b int     3
003b016c mov     eax,7002Bh
003b0171 call    dword ptr fs:[0C0h]
003b0178 ret     8
003b017b nop
003b017c int     3
003b017d int     3
003b017e int     3
003b017f int     3
003b0180 int     3
003b0181 int     3
003b0182 int     3
003b0183 int     3
003b0184 int     3
003b0185 int     3
003b0186 int     3
003b0187 int     3
003b0188 mov     eax,17h
003b018d call    dword ptr fs:[0C0h]
003b0194 ret     18h
003b0197 nop
003b0198 int     3
003b0199 int     3
003b019a int     3
003b019b int     3
003b019c int     3
003b019d int     3
003b019e int     3
003b019f int     3
003b01a0 int     3
003b01a1 int     3
003b01a2 int     3
003b01a3 int     3
003b01a4 mov     eax,4Fh
003b01a9 call    dword ptr fs:[0C0h]
003b01b0 ret     14h
003b01b3 nop
003b01b4 int     3
003b01b5 int     3
003b01b6 int     3
003b01b7 int     3
003b01b8 int     3
003b01b9 int     3
003b01ba int     3
003b01bb int     3
003b01bc int     3
003b01bd int     3
003b01be int     3
003b01bf int     3
003b01c0 mov     eax,1Dh
003b01c5 call    dword ptr fs:[0C0h]
003b01cc ret     10h
003b01cf nop
003b01d0 int     3
003b01d1 int     3
003b01d2 int     3
003b01d3 int     3
003b01d4 int     3
003b01d5 int     3
003b01d6 int     3
003b01d7 int     3
003b01d8 int     3
003b01d9 int     3
003b01da int     3
003b01db int     3
003b01dc mov     eax,22h
003b01e1 call    dword ptr fs:[0C0h]
003b01e8 ret     18h
003b01eb nop
003b01ec int     3
003b01ed int     3
003b01ee int     3
003b01ef int     3
003b01f0 int     3
003b01f1 int     3
003b01f2 int     3
003b01f3 int     3
003b01f4 int     3
003b01f5 int     3
003b01f6 int     3
003b01f7 int     3
003b01f8 mov     eax,47h
003b01fd call    dword ptr fs:[0C0h]
003b0204 ret     14h
003b0207 nop
003b0208 int     3
003b0209 int     3
003b020a int     3
003b020b int     3
003b020c int     3
003b020d int     3
003b020e int     3
003b020f int     3
003b0210 int     3
003b0211 int     3
003b0212 int     3
003b0213 int     3
003b0214 mov     eax,1A0005h
003b0219 call    dword ptr fs:[0C0h]
003b0220 ret     24h
003b0223 nop
003b0224 int     3
003b0225 int     3
003b0226 int     3
003b0227 int     3
003b0228 int     3
003b0229 int     3
003b022a int     3
003b022b int     3
003b022c int     3
003b022d int     3
003b022e int     3
003b022f int     3
003b0230 mov     eax,10h
003b0235 call    dword ptr fs:[0C0h]
003b023c ret     14h
003b023f nop
003b0240 int     3
003b0241 int     3
003b0242 int     3
003b0243 int     3
003b0244 int     3
003b0245 int     3
003b0246 int     3
003b0247 int     3
003b0248 int     3
003b0249 int     3
003b024a int     3
003b024b int     3
003b024c mov     eax,112h
003b0251 call    dword ptr fs:[0C0h]
003b0258 ret     0Ch
003b025b nop
003b025c int     3
003b025d int     3
003b025e int     3
003b025f int     3
003b0260 int     3
003b0261 int     3
003b0262 int     3
003b0263 int     3
003b0264 int     3
003b0265 int     3
003b0266 int     3
003b0267 int     3
003b0268 mov     eax,13Eh
003b026d call    dword ptr fs:[0C0h]
003b0274 ret     0Ch
003b0277 nop
003b0278 int     3
003b0279 int     3
003b027a int     3
003b027b int     3
003b027c int     3
003b027d int     3
003b027e int     3
003b027f int     3
003b0280 int     3
003b0281 int     3
003b0282 int     3
003b0283 int     3
003b0284 mov     eax,24h
003b0289 call    dword ptr fs:[0C0h]
003b0290 ret     14h
003b0293 nop
003b0294 int     3
003b0295 int     3
003b0296 int     3
003b0297 int     3
003b0298 int     3
003b0299 int     3
003b029a int     3
003b029b int     3
003b029c int     3
003b029d int     3
003b029e int     3
003b029f int     3
003b02a0 mov     eax,18h
003b02a5 call    dword ptr fs:[0C0h]
003b02ac ret     14h
003b02af nop
003b02b0 int     3
003b02b1 int     3
003b02b2 int     3
003b02b3 int     3
003b02b4 int     3
003b02b5 int     3
003b02b6 int     3
003b02b7 int     3
003b02b8 int     3
003b02b9 int     3
003b02ba int     3
003b02bb int     3
003b02bc mov     eax,0D0003h
003b02c1 call    dword ptr fs:[0C0h]
003b02c8 ret     0Ch
003b02cb nop
003b02cc int     3
003b02cd int     3
003b02ce int     3
003b02cf int     3
003b02d0 int     3
003b02d1 int     3
003b02d2 int     3
003b02d3 int     3
003b02d4 int     3
003b02d5 int     3
003b02d6 int     3
003b02d7 int     3
003b02d8 add     byte ptr [eax],al
003b02da add     byte ptr [eax],al
003b02dc add     byte ptr [eax],al
003b02de add     byte ptr [eax],al
003b02e0 add     byte ptr [eax],al
Searching for the address of system call points to another executable region:
0:001:x86> s-d 0 L?(FFFFFFFF/4) 003b02bc

00030044  003b02bc 003b0284 71b74be0 0824448b  ..;…;..K.q.D$.
0:001:x86> !address 00030044
Usage:
Base Address:           00030000
End Address:            00031000
Region Size:            00001000
State:                  00001000	MEM_COMMIT
Protect:                00000020	PAGE_EXECUTE_READ
Type:                   00020000	MEM_PRIVATE
Allocation Base:        00030000
Allocation Protect:     00000040	PAGE_EXECUTE_READWRITE
0:001:x86> dps 00030000 00031000

00030000  cd697e0e

00030004  4b6b72cc

00030008  036f2786

0003000c  be5fe321

00030010  00000f5c

00030014  00000038

00030018  00000000

0003001c  00000030

00030020  00000000

00030024  00000001

00030028  003d0000

0003002c  003d0028

00030030  003b0000

00030034  00000000

00030038  77d4ce23 ntdll_77d00000!LdrLoadDll

0003003c  77d62fdd ntdll_77d00000!LdrUnloadDll

00030040  77d6094d ntdll_77d00000!LdrAddRefDll

00030044  003b02bc

00030048  003b0284

0003004c  71b74be0*** ERROR: Symbol file could not be found.  Defaulted to export symbols for UMEngx86.dll -

UMEngx86+0×4be0

00030050  0824448b

00030054  00300589

00030058  52b8003d

0003005c  e9000700

[…]
In addition to Ldr* Namespace we see a valid symbolic reference (Module Hint) to AV:
0:001:x86> u 71b74be0
UMEngx86+0x4be0:
71b74be0 push    ebp
71b74be1 mov     ebp,esp
71b74be3 push    0FFFFFFFEh
71b74be5 push    offset UMEngx86!RegQueryValueExW+0x29818 (71b9f9b8)
71b74bea push    offset UMEngx86!RegQueryValueExW+0x20b0 (71b78250)
71b74bef mov     eax,dword ptr fs:[00000000h]
71b74bf5 push    eax
71b74bf6 sub     esp,8
0:001:x86> lmv m UMEngx86
start             end                 module name
71b70000 71bae000   UMEngx86   (export symbols)       UMEngx86.dll
    Loaded symbol image file: UMEngx86.dll
    Image path: C:\ProgramData\Symantec\Symantec
        Endpoint Protection\12.1.4100.4126.105\Data\
        Definitions\BASHDefs\20150307.011\UMEngx86.dll
    Image name: UMEngx86.dll
    Timestamp:        Fri Jan 23 00:52:29 2015 (54C19B4D)
    CheckSum:         00045930
    ImageSize:        0003E000
    File version:     9.1.1.4
    Product version:  9.1.1.4
    File flags:       0 (Mask 3F)
    File OS:          4 Unknown Win32
    File type:        2.0 Dll
    File date:        00000000.00000000
    Translations:     0409.04b0
    CompanyName:      Symantec Corporation
    ProductName:      BASH
    InternalName:     UMEngx86
    OriginalFilename: UMEngx86.dll
    ProductVersion:   9.1.1.4
    FileVersion:      9.1.1.4
    FileDescription:  SONAR Engine
    LegalCopyright:   Copyright (C) 2009 - 2014 Symantec
         Corporation. All rights reserved.
- Dmitry Vostokov @ DumpAnalysis.org + TraceAnalysis.org -