Crash Dump Analysis Patterns (Part 214)
When we look at a stack trace in a memory dump we see only the current thread execution snapshot of function calls. Consider this stack trace, for example, from Spiking Thread:
0:000> k

Child-SP          RetAddr            Call Site

00000000`0012d010 00000000`76eb59ed App!WinMain+0x1eda

00000000`0012f7c0 00000000`770ec541 kernel32!BaseThreadInitThunk+0xd

00000000`0012f7f0 00000000`00000000 ntdll!RtlUserThreadStart+0x1d
By looking at Rough Stack Trace we may be able to reconstruct Past Stack Trace of what had happened just before the memory snapshot was taken:
0:000> k

Child-SP          RetAddr            Call Site

00000000`0012cfd8 00000000`76fd9e9e user32!ZwUserGetMessage+0xa

00000000`0012cfe0 00000000`ffd91a8c user32!GetMessageW+0x34

00000000`0012d010 00000000`76eb59ed App!WinMain+0x1dca

00000000`0012f7c0 00000000`770ec541 kernel32!BaseThreadInitThunk+0xd

00000000`0012f7f0 00000000`00000000 ntdll!RtlUserThreadStart+0x1d
The stack region “time” zones are illustrated on the following picture:
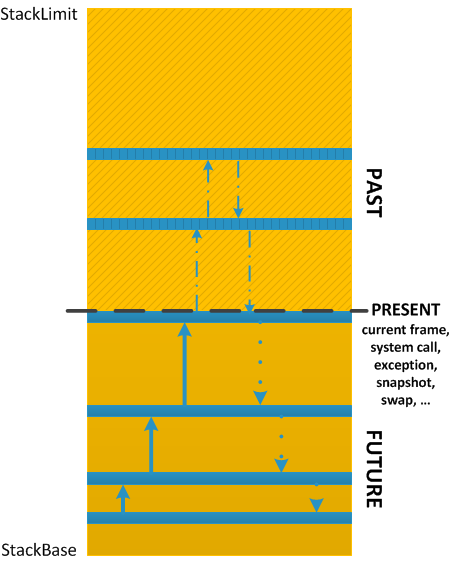
The “Future” zone takes its name from the not yet executed returns. Of course, each stack subtrace generates its own partition. A similar version of this pattern was first introduced in Debugging TV Frames episode 0×24. You watch the video here and can find source code, WinDbg logs, and presentation here.
- Dmitry Vostokov @ DumpAnalysis.org + TraceAnalysis.org -