Trace Analysis Patterns (Part 50)
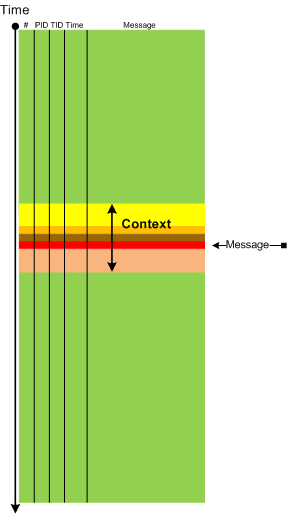
Sunday, June 3rd, 2012In some cases it is useful to consider Message Context: a set of surrounding messages having some relation to the chosen message:
- Dmitry Vostokov @ DumpAnalysis.org + TraceAnalysis.org -
In some cases it is useful to consider Message Context: a set of surrounding messages having some relation to the chosen message:
- Dmitry Vostokov @ DumpAnalysis.org + TraceAnalysis.org -
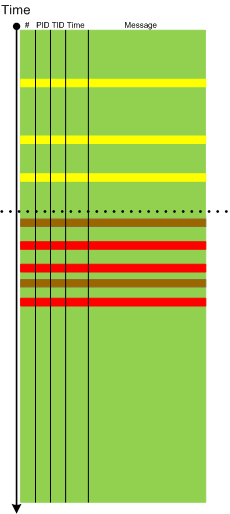
Sometimes we need to pay attention to Error Distribution, for example, the distribution of the same error across a software log space or different error messages in different parts of the same software log or trace (providing effective partition):
- Dmitry Vostokov @ DumpAnalysis.org + TraceAnalysis.org -
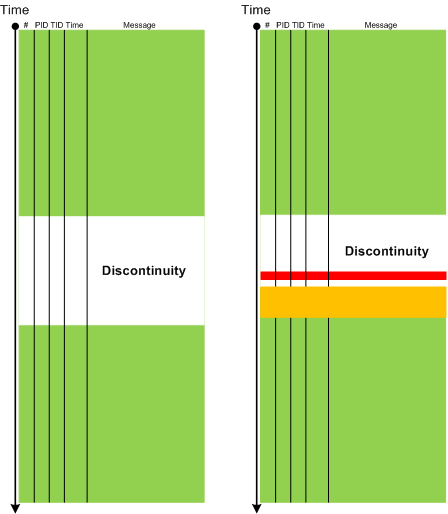
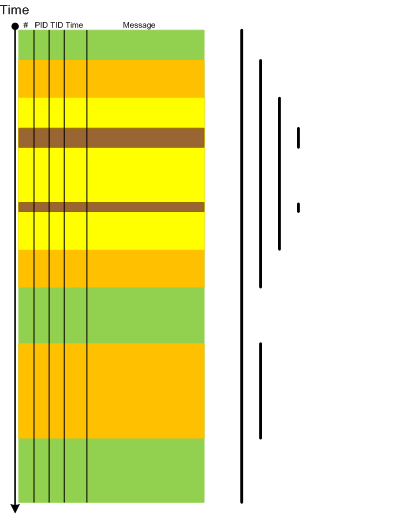
If Break-in Activity is usually unrelated to a thread or an adjoint thread which has a discontinuity then Resume Activity pattern highlights messages from that thread:
The difference can be seen on the following graphical representation of two traces we analyzed where in a working trace a break-in preceded resume activity whereas in a non-working trace both patterns were absent:
- Dmitry Vostokov @ DumpAnalysis.org + TraceAnalysis.org -
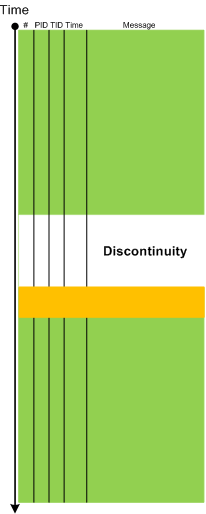
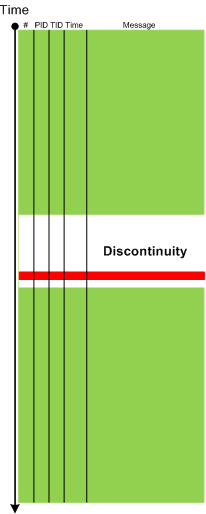
We resume our software trace analysis pattern catalog. The next pattern is called Break-in Activity. This is a message or a set of messages that surface just before the end of discontinuity of a adjoint thread and possibly triggered it:
- Dmitry Vostokov @ DumpAnalysis.org + TraceAnalysis.org -
In a week this short full color book should appear in online bookstores:

- Dmitry Vostokov @ DumpAnalysis.org + TraceAnalysis.org -
Memory Dump Analysis Services organizes a free Webinar on Unified Software Diagnostics (USD) and the new scalable cost-effective software support model called Pattern-Driven Software Support devised to address various shortcomings in existing tiered software support organizations. Examples cover Windows, Mac OS and Linux.

Date: 22nd of June, 2012
Time: 17:00 (BST) 12:00 (EST) 09:00 (PST)
Duration: 60 minutes
Space is limited.
Reserve your Webinar seat now at:
https://www3.gotomeeting.com/register/172771078
- Dmitry Vostokov @ DumpAnalysis.org + TraceAnalysis.org -
Narrative theory distinguishes between frame types such as (Fludernik, McHale, Nelles, Wolf):
- introductory framing (missing end frame) [—————————-
- terminal framing (missing opening frame) —————————-]
- [—————————-]
- interpolated framing [—-[ ]—-[ ]——–]
At the level of the software trace or an adjoint thread as a whole the first 3 types correspond to various types of this pattern Partition: Head, Prologue, Core, Epilogue, Tail where certain parts are missing. The first 2 types can also be instances of Truncated Trace pattern. Interpolated framing can be an instance of multiple discontinuities. All 4 types also correspond to foreground component messages and in general we have multiple Trace Frames as depicted:
- Dmitry Vostokov @ DumpAnalysis.org + TraceAnalysis.org -
The previous definition of software narratology was restricted to software traces and logs (the top left quadrant on a software narrative square, also the part of Memoretics which studies memory snapshots). Now, with the broadening of the domain of software narratology to the whole world of software narrative stories including actor interactions with software in construction requirements use cases and post-construction incidents we give another definition:
Software narrative is a representation of software events and changes of state. Software Narratology is a discipline that studies such software narratives (software narrative science).
- Dmitry Vostokov @ DumpAnalysis.org + TraceAnalysis.org -
Memory Dump Analysis Services (DumpAnalysis.com) organizes a free Webinar about software narratology: an application of ideas from narratology to software narrative stories.

Learn about this exciting new discipline and a field of research. When software executes it gives us its stories in the form of UI events, software traces and logs. Such stories can be analyzed for their structure and patterns for troubleshooting, debugging and problem resolution purposes.
Prerequisites: basic software troubleshooting and ability to read software generated logs.
Audience: anyone can benefit from this new perspective: from software users to software engineers and managers.
Space is limited.
Reserve your Webinar seat now at:
https://www3.gotomeeting.com/register/603136294
- Dmitry Vostokov @ DumpAnalysis.org + TraceAnalysis.org -
In narratology anti-narrative denotes a narrative having sequences of events impossible in reality. In software traces such sequences usually depict abnormal software behaviour. Here are some parallels with corresponding trace analysis patterns:
Fiction                             | Software Trace

================================================

Repeated unrepeatable       | Periodic Error (?)

Denarration (erasure)            | No Activity / Incomplete History

Chronological contradiction | Impossible Trace
Question mark means that possibly another pattern is needed there.
- Dmitry Vostokov @ DumpAnalysis.org + TraceAnalysis.org -
Forthcoming Accelerated Software Trace Analysis training requires extensive real life like software logs with multiple software behaviour patterns. The similar accelerated memory dump analysis trainings (unmanaged / native Windows and .NET) also required good memory dumps but this problem was solved by modeling patterns of abnormal software behaviour in an appropriate implementation language such as C++ and C#. Modeling software traces with hundreds of software components, processes and threads would require enormous programming efforts. Therefore, the natural approach is to describe a desired software trace in some declarative language (or minimally imperative) and get a million line software log that models a specific combination of trace analysis patterns. So, welcome to such a language called Narralog: Software Narrative Log or Narrative Logic. Please note that this language is different from Riemann programming language which is a language to describe software problems and generate software problem solving tools. Language details and whether a kind of a Metadefect Template Library will be used to implement Narralog or simple macroprogramming is suffice will be decided and announced when we further develop our training.
- Dmitry Vostokov @ DumpAnalysis.org + TraceAnalysis.org -
John Randall’s blog about narratology and narremes suggested me to elaborate on a basic software trace (log) unit. One candidate is a trace message invariant, a skeleton trace message similar to a format string. There is also a corresponding software trace analysis pattern called Message Invariant. Although, this might be too an elementary unit akin to a sentence level and another candidate is a macromessage, a combination of several messages serving some semantic function. There is a corresponding general pattern Macrofunction and an example concrete analysis pattern called Exception Stack Trace. The actual software narreme might be situated between these two extremes: invariants and macrofunctions.
If you are new to a software narratology field please look at these posts placed in chronological order (except a pattern catalog):
- Dmitry Vostokov @ DumpAnalysis.org + TraceAnalysis.org -
This is another tracing example of unified debugging patterns introduced previously.
- Analysis Patterns
- Architectural Patterns
Debug Event Subscription / Notification
- Design Patterns
Shared Debug Event State
- Implementation Patterns
Shared Variable
- Usage Patterns
Saving a memory address obtained at a breakpoint event in a debugger pseudo-register for use at later breakpoint events
Debugging.tv published a case study for tracing window messages in WinDbg. There a pseudo-register is used to save a buffer address before GetMessage call and then to reuse it after the call. Please look at Event State Management slide on Frames episode 0×06 presentation. The full WinDbg log and the recording are available there too.
- Dmitry Vostokov @ DumpAnalysis.org + TraceAnalysis.org -
Based on ideas of Roman Jakobson about “marked” and “unmarked” categories we propose another pattern called Marked Message that groups trace messages based on having some feature or property. For example, marked messages may point to some domain of software activity such related to functional requirements and therefore may help in troubleshooting and debugging. Unmarked messages include all other messages that don’t say anything about such activities (although may include messages pointing to such activities indirectly we unaware of) or messages that say explicitly that no such activity has occurred. We can even borrow a notation of distinctive features from phonology and annotate any trace or log after analysis to compare it with a master trace, for example, compose the following list of software trace distinctive features:
session database queries [+]
session initialization [-]
socket activity [+]
process A launched [+]
process B launched [-]
process A exited [-]
[…]
Here [+] means the activity is present in the trace and [-] means the activity is either undetected or definitely not present. Sometime a non-present activity can be a marked activity corresponding to all inclusive unmarked present activity (see, for example, No Activity pattern).
- Dmitry Vostokov @ DumpAnalysis.org + TraceAnalysis.org -
This is the first initiative for the year of software trace analysis: the first and unique software trace and log analysis training based entirely on patterns of software behavior. No longer you will be frustrated when opening a software trace with millions of messages from hundreds of software components, threads and processes.
Memory Dump Analysis Services (DumpAnalysis.com) organizes a training course:
Learn how to efficiently and effectively analyze software traces and logs from complex software environments. Covered popular software logs and trace formats from Microsoft and Citrix products and tools including Event Tracing for Windows (ETW) and Citrix Common Diagnostics Format (CDF). Learn how to use pioneering and innovative pattern-driven software problem behavior analysis to troubleshoot and debug software incidents.
If your are registered you are allowed to optionally submit your software traces and logs before the training. This will allow us in addition to the carefully constructed problems tailor additional examples to the needs of the attendees.
The training consists of 2 two-hour sessions and additional homework exercises. When you finish the training you additionally get:
Prerequisites: Basic Windows troubleshooting.
Audience: Software technical support and escalation engineers, software maintenance engineers, system administrators.
Session 1: October 12, 2012 4:00 PM - 6:00 PM BST
Session 2: October 15, 2012 4:00 PM - 6:00 PM BST
Price: 210 USD
Space is limited.
Reserve your remote training seat now at:
https://student.gototraining.com/r/5287623225237732608

- Dmitry Vostokov @ DumpAnalysis.org + TraceAnalysis.org -
The number of software trace analysis patterns approaches the critical mass of 50 and we have decided to focus on software tracing and logging in the forthcoming year. Some books on tracing including Volume 7 of Memory Dump Analysis Anthology will be published by OpenTask during that year and our efforts will be to further advance software narratology, software trace linguistics, and software trace analysis in the context of memory dump analysis, generative debugging and modeling software behavior.
- Dmitry Vostokov @ DumpAnalysis.org + TraceAnalysis.org -
More than 4 years passed since I provided a longer structuralist definition. Recently I came to recognize a pattern-driven iterative and incremental nature of memory and software trace analysis and post-construction software problem solving in general and therefore a one sentence definition became necessary:
“Recognition and interpretation of patterns of software behavior”
- Dmitry Vostokov @ DumpAnalysis.org + TraceAnalysis.org -
Frequently we observe that several trace messages form a single semantic unit we call Macrofunction where individual trace messages serve the role of microfunctions. We borrowed this idea and distinction from functionalist linguistics. An example would be a software trace fragment where messages log an attempt to update a database:
#     Module   PID  TID   Time         Message

[...]

42582 DBClient 5492 9476  11:04:33.398 Opening connection

[...]

42585 DBClient 5492 9476  11:04:33.398 Sending SQL command

[...]

42589 DBServer 6480 10288 11:04:33.399 Executing SQL command

[...]

42592 DBClient 5492 9476  11:04:33.400 Closing connection

[...]
Please note that these macrofunctions need not be from the same ATID in the traditional sense like in the example above unless we form adjoint threads from certain fragments like “DB”.
- Dmitry Vostokov @ DumpAnalysis.org + TraceAnalysis.org -
The new 6th volume contains revised, edited, cross-referenced, and thematically organized selected DumpAnalysis.org blog posts about memory dump and software trace analysis, software troubleshooting and debugging written in November 2010 - October 2011 for software engineers developing and maintaining products on Windows platforms, quality assurance engineers testing software on Windows platforms, technical support and escalation engineers dealing with complex software issues, and security researchers, malware analysts and reverse engineers. The sixth volume features:
Product information:

Back cover features 3d memory space visualization image created with ParaView.
- Dmitry Vostokov @ DumpAnalysis.org + TraceAnalysis.org -
Sometimes we have Linked Messages through some common parameter or attribute. One such example can be found in ETW traces related to kernel process creation notifications. Here we got adjoint thread for module PIDNotify:
#      Module    PID  TID  Time         Message

[...]

128762 PIDNotify 1260 6208 15:53:15.691 Create: ParentID 0x000004EC PID 0×000018D4

[…]

128785 PIDNotify 6356 6388 15:53:15.693 Load: ImageName \Device\HarddiskVolume1\Windows\System32\abscript.exe PID 0×000018D4

[…]

131137 PIDNotify 6356 4568 15:53:15.936 Create: ParentID 0×000018D4 PID 0×00001888

[…]

131239 PIDNotify 6280 6376 15:53:15.958 Load: ImageName \Device\HarddiskVolume1\Windows\System32\wscript.exe PID 0×00001888

[…]

132899 PIDNotify 6356 5704 15:53:16.462 Create: ParentID 0×000018D4 PID 0×00001FD0

[…]

132906 PIDNotify 8144 7900 15:53:16.464 Load: ImageName \Device\HarddiskVolume1\Windows\System32\cmd.exe PID 0×00001FD0

[…]
We see that messages 128762 and 128785 are linked through PID parameter and linked to messages 131137 and 132899 through PID - ParentID parameter relationship. Similar linkages exist for messages 131137 / 131239 and 132899 / 132906.
- Dmitry Vostokov @ DumpAnalysis.org + TraceAnalysis.org -