Archive for the ‘Tools’ Category

Old dumps, new extensions

Tuesday, October 23rd, 2007

Up to now I’ve been using old Windows 2000 WinDbg extensions to extract information from Windows 2003 and XP crash dumps when their native extensions failed. Today I have found I can do the way around, to extract information from old Windows 2000 crash dumps using WinDbg extensions written for Windows XP and later. Here is an example. WinDbg !stacks command shows the following not really helpful output from Windows 2000 complete memory dump:

2: kd> !stacks
Proc.Thread  Thread   Ticks   ThreadState Blocker
                                     [System]
   8.000004  89df8220 0000000 BLOCKED     nt!KiSwapThread+0x1b1
   8.00000c  89dc1860 0003734 BLOCKED     nt!KiSwapThread+0x1b1
   8.000010  89dc15e0 0003734 BLOCKED     nt!KiSwapThread+0x1b1
   8.000014  89dc1360 00003b4 BLOCKED     nt!KiSwapThread+0x1b1
   8.000018  89dc10e0 0003734 BLOCKED     nt!KiSwapThread+0x1b1
   8.00001c  89dc0020 0000381 BLOCKED     nt!KiSwapThread+0x1b1
   8.000020  89dc0da0 00066f6 BLOCKED     nt!KiSwapThread+0x1b1
   8.000024  89dc0b20 00025b4 BLOCKED     nt!KiSwapThread+0x1b1
   8.000028  89dc08a0 00025b4 BLOCKED     nt!KiSwapThread+0x1b1
   8.00002c  89dc0620 0003734 BLOCKED     nt!KiSwapThread+0x1b1
   8.000030  89dc03a0 0003734 BLOCKED     nt!KiSwapThread+0x1b1
   8.000034  89dbf020 00025b4 BLOCKED     nt!KiSwapThread+0x1b1
   8.000038  89dbfda0 00025b4 BLOCKED     nt!KiSwapThread+0x1b1
   8.00003c  89dbfb20 00007b4 BLOCKED     nt!KiSwapThread+0x1b1
   8.000040  89dbf8a0 00007b4 BLOCKED     nt!KiSwapThread+0x1b1
   8.000044  89dbf620 0000074 BLOCKED     nt!KiSwapThread+0x1b1
   8.000048  89dbf3a0 00007b4 BLOCKED     nt!KiSwapThread+0x1b1
...
...
...

This command belongs to different WinDbg extension DLLs (from WinDbg help):

Windows NT 4.0         Unavailable
Windows 2000           Kdextx86.dll
Windows XP and later   Kdexts.dll

and I tried newer kdexts.dll with better results:

2: kd> !winxp\kdexts.stacks
Proc.Thread  .Thread  Ticks   ThreadState Blocker
                            [89df84a0 System]
   8.0000c8  89db77c0 0000000 Blocked    nt!MiRemoveUnusedSegments+0xf4
   8.0000f0  89c8a020 0019607 Blocked    cpqasm2+0x1ef0
   8.000108  89881900 0000085 Blocked    CPQCISSE+0x3ae8
   8.000110  8982cda0 000000a Blocked    cpqasm2+0x2a523
   8.00013c  8974a9a0 00007d7 Blocked    rdbss!RxSetMinirdrCancelRoutine+0x3d
   8.000148  89747b20 000010a Blocked    rdbss!RxIsOkToPurgeFcb+0x3f
   8.00014c  89758a80 0019493 Blocked    nt!NtNotifyChangeMultipleKeys+0x434
   8.0002dc  89620680 000000e Blocked    cpqasm2+0x5523
   8.0002e0  89620400 00000d2 Blocked    cpqasm2+0x584d
   8.0004ac  895ae9c0 000955b Blocked    srv!SrvOemStringTo8dot3+0xb7
   8.0004c0  8937b4e0 0018fea Blocked    srv!SrvOemStringTo8dot3+0xb7
   8.0004a0  895b09e0 0018fe9 Blocked    srv!SrvOemStringTo8dot3+0xb7
   8.0004cc  893784e0 0018fe8 Blocked    srv!SrvOemStringTo8dot3+0xb7
   8.0004d0  893774e0 000955b Blocked    srv!SrvOemStringTo8dot3+0xb7
   8.0004d4  893764e0 0018fe8 Blocked    srv!SrvOemStringTo8dot3+0xb7
   8.003d68  87abb580 00000b7 Blocked    rdbss!RxSearchForCollapsibleOpen+0x17c
   8.002b94  88e4f180 00000b9 Blocked    rdbss!RxSearchForCollapsibleOpen+0x17c

                            [89736940 smss.exe]

                            [896d3b20 csrss.exe]
 178.000180  896c8020 0000012 Blocked    ntdll!NtReplyWaitReceivePort+0xb
 178.00018c  896c5320 0000012 Blocked    ntdll!NtReplyWaitReceivePort+0xb
 178.001260  88fbcb20 0000060 Blocked    ntdll!NtReplyWaitReceivePort+0xb
 178.001268  88fbbda0 0000060 Blocked    ntdll!NtReplyWaitReceivePort+0xb

                            [896c8740 WINLOGON.EXE]
 174.00019c  896b7740 0000299 Blocked    ntdll!ZwDelayExecution+0xb
 174.0001a0  896b6020 00015dd Blocked    ntdll!NtRemoveIoCompletion+0xb
 174.000f08  8913eda0 00000b0 Blocked    ntdll!ZwWaitForMultipleObjects+0xb
 174.000f0c  8901b020 00000b0 Blocked    ntdll!ZwWaitForSingleObject+0xb

- Dmitry Vostokov @ DumpAnalysis.org -

Local crash dumps on Vista

Thursday, October 18th, 2007

It appears that Microsoft decided to help customers to save full user dumps locally for later postmortem analysis. According to MSDN this is done via LocalDumps registry key starting from Vista SP1 and Windows Server 2008:

http://msdn2.microsoft.com/en-us/library/bb787181.aspx

This is a quote from the article above:

[…] Prior to application termination, the system will check the registry settings to determine whether a local dump is to be collected. The registry settings control whether a full dump is collected versus a minidump. The custom flags specified also determine which information is collected in the dump. […] You can make use of the local dump collection even if WER is disabled. The local dumps are collected even if the user cancels WER reporting at any point. […]

From my understanding it is independent from the default postmortem debugger mechanism via AeDebug registry key and might help to solve the problem with native services. I haven’t tried it yet but will do as soon as I install Vista SP1 or install Windows Server 2008 RC0. If it works then dump collection might be easier in production environments because of no need to install Debugging Tools for Windows to set up a postmortem debugger.

- Dmitry Vostokov @ DumpAnalysis.org -

Crash Dumps for Dummies (Part 6)

Tuesday, October 16th, 2007

Bugtation No. 73:
Crash “must be distinguished from” hang “with which it is often confounded.”
Sydney Smith

In part 4 I highlighted the difference between crashes and hangs. In this part I will elaborate on this terminology a bit further. First of all, we have to unify them as manifestations of a functional failure. Considering computer as a system of components having certain functions we shall subdivide failures into system and component failures. Of course, systems may be components in some larger hierarchy, like in the case of virtualization. Application and service process failures fall under component failures category. Blue screen and server freezes fall under system failures category. Now it is obvious why most computer users confuse crashes and hangs. They are just failures and often the distinction between them is blurred from user perspective.

Software developers tend to make sharp distinction between crash and hang terms because they consider a situation when a computer accesses wrong memory or gets and executes an invalid instruction as a crash. However, after such situation a computer system may or may not terminate that application or service. 

Therefore, I propose to consider crashes as situations when a system or a component is not observed anymore. For example, a running application or service disappears from Task Manager, computer system shows blue screen or reboots. In hang situations we can observe that existence of a failed component in Task Manager or a computer system doesn’t reboot automatically and shows some screen image different from BSOD or panic message. The so called sluggish behavior or long response time can also be considered as hang situations.

Here is a simple rough diagram I devised to illuminate the proposed terminological difference:

Based on the clarification above the task of collecting memory or crash dumps is much simpler and clearer.

In the case of a system crash or hang we need to setup correct crash dump options in Advanced System Settings in Control Panel and check page file size in case of the complete memory dump option. A system crash will save the dump automatically. For system hangs we need to actively trigger crash dump saving procedure using either standard keyboard method, SystemDump tool or live system debugging.   

In the case of an application crash we need to set up a postmortem debugger, get WER report or attach a debugger to a component and wait for a failure to happen. In the case of a hang we save a memory dump manually either by using process dumpers like userdump.exe or attaching a debugger.

Links to some dump collection techniques can be found in the previously published part 3 (crashes explained) and part 4 (hangs explained). Forthcoming Windows® Crash Dump Analysis book will discuss all memory dump collection methods thoroughly and in detail.

- Dmitry Vostokov @ DumpAnalysis.org -

Heaps and heap corruption explained

Tuesday, October 2nd, 2007

Excellent free chapter explaining process heap implementation and debugging heap corruption issues from the authors of Advanced Windows Debugging book:

Sample Chapter

- Dmitry Vostokov @ DumpAnalysis.org -

Windows service crash dumps in Vista

Monday, October 1st, 2007

I was playing with Vista Platform SDK samples to create the minimal native Windows service that crashes to test various postmortem debugger configurations, Windows Error Reporting (WER) options and conditions under which crash dumps are available. Initially I put a NULL pointer dereference into the service control handler processing service stop command and although the service crashed under WinDbg I couldn’t get CDB or NTSD configured as a default postmortem debugger to save the crash dump automatically. I tested under x64 Vista and Windows Server 2003 x64 both 32-bit and 64-bit versions of my service.

Here is the source code and stack trace from WinDbg when we attach it to the running service and then try to stop it:

//
// FUNCTION: service_ctrl
//
// PURPOSE: This function is called by the SCM whenever
// ControlService() is called on this service.
//
// PARAMETERS:
// dwCtrlCode - type of control requested
//
// RETURN VALUE:
// none
//
// COMMENTS:
//
VOID WINAPI service_ctrl(DWORD dwCtrlCode)
{
  // Handle the requested control code.
  //
  switch (dwCtrlCode)
  {
  case SERVICE_CONTROL_STOP:
    *(int *)NULL = 0;
    ReportStatusToSCMgr(SERVICE_STOP_PENDING, NO_ERROR, 0);
    ServiceStop();
    return;

  // Update the service status.
  //
  case SERVICE_CONTROL_INTERROGATE:
    break;

  // invalid control code
  //
  default:
    break;

}

ReportStatusToSCMgr(ssStatus.dwCurrentState, NO_ERROR, 0);
}

0:000> r
rax=0000000000000001 rbx=00000000001e36d0 rcx=0000000000000001
rdx=000000000a9ff32c rsi=0000000000000000 rdi=0000000000401aa0
rip=0000000000401ab9 rsp=000000000012fab0 rbp=00000000001e36d0
 r8=0000000000400000  r9=0000000077b3f990 r10=00000000004000d8
r11=00000000004000d8 r12=0000000000000000 r13=000000000a9ff32c
r14=00000000001e36e8 r15=000000000012fc20
iopl=0 nv up ei pl zr na po nc
cs=0033  ss=002b  ds=002b  es=002b  fs=0053  gs=002b  efl=00010246
simple!service_ctrl+0x19:
00000000`00401ab9 c704250000000000000000 mov dword ptr [0],0 ds:00000000`00000000=????????

0:000> k
Child-SP          RetAddr           Call Site
00000000`0012fab0 000007fe`fe276cee simple!service_ctrl+0x19
00000000`0012faf0 000007fe`fe2cea5d ADVAPI32!ScDispatcherLoop+0x54c
00000000`0012fbf0 00000000`004019f5 ADVAPI32!StartServiceCtrlDispatcherA+0x8d
00000000`0012fe70 00000000`00408b8c simple!main+0x155
00000000`0012fec0 00000000`0040895e simple!__tmainCRTStartup+0x21c
00000000`0012ff30 00000000`7792cdcd simple!mainCRTStartup+0xe
00000000`0012ff60 00000000`77a7c6e1 kernel32!BaseThreadInitThunk+0xd
00000000`0012ff90 00000000`00000000 ntdll!RtlUserThreadStart+0x1d

If we put while(1); code instead of NULL pointer dereference the process will be interrupted via breakpoint and then terminated. There is no postmortem dump saved too. Therefore it looks like any fault inside the service main thread is not allowed to execute the potentially blocking operation of unhandled exception filter perhaps to avoid blocking the service control manager (SCM) communicating with service dispatcher code.

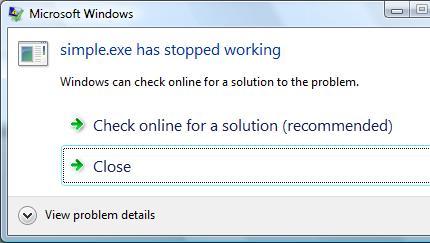
On Vista if Windows Error Reporting service is running and WER is configured in Control Panel to allow a user to choose reporting settings we get the following familiar dialog but without Debug option to attach a postmortem debugger and save a crash dump:

If we choose the recommended option we get the following dialog showing the path where a minidump file was temporarily stored:


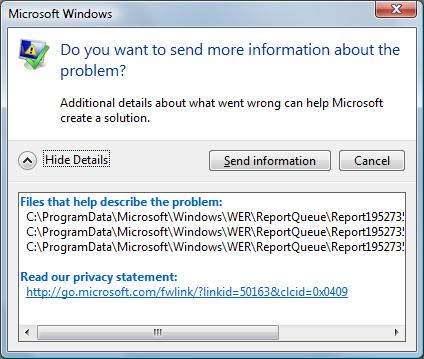
We need to leave this dialog open if we want to open the crash dump or copy it to another location otherwise report files will be removed as soon as we dismiss the dialog box (they may be stored temporarily in another location - check Problem Reports and Solutions\View Problem History in Control Panel). If we open the crash dump using WinDbg we get the same stack trace that we got previously during live debugging:

Loading Dump File [C:\ProgramData\Microsoft\Windows\WER\ReportQueue\Report19527353 \WER7346.tmp.mdmp]
User Mini Dump File: Only registers, stack and portions of memory are available

Symbol search path is: srv*c:\mss*http://msdl.microsoft.com/download/symbols
Executable search path is:
Windows Vista Version 6000 MP (2 procs) Free x64
Product: WinNt, suite: SingleUserTS
Debug session time: Fri Sep 28 16:36:38.000 2007 (GMT+1)
System Uptime: 2 days 1:42:22.810
Process Uptime: 0 days 0:00:10.000
.....
This dump file has an exception of interest stored in it.
The stored exception information can be accessed via .ecxr.
(13b0.d54): Access violation - code c0000005 (first/second chance not available)
*** WARNING: Unable to verify checksum for simple.exe
simple!service_ctrl+0x19:
00000000`00401ab9 c704250000000000000000 mov dword ptr [0],0 ds:00000000`00000000=????????
0:000> k
Child-SP          RetAddr           Call Site
00000000`0012fab0 000007fe`fe276cee simple!service_ctrl+0x19
00000000`0012faf0 000007fe`fe2cea5d advapi32!ScDispatcherLoop+0x54c
00000000`0012fbf0 00000000`004019f5 advapi32!StartServiceCtrlDispatcherA+0x8d
00000000`0012fe70 00000000`00408b8c simple!main+0x155
00000000`0012fec0 00000000`0040895e simple!__tmainCRTStartup+0x21c
00000000`0012ff30 00000000`7792cdcd simple!mainCRTStartup+0xe
00000000`0012ff60 00000000`77a7c6e1 kernel32!BaseThreadInitThunk+0xd
00000000`0012ff90 00000000`00000000 ntdll!RtlUserThreadStart+0x1d

Fault in any other service thread, for example, the one that SCM starts per every SERVICE_TABLE_ENTRY in dispatch table results in a default postmortem debugger saving a crash dump on Windows Server 2003 x64 but not on Vista x64 or Vista x86 (32-bit):

void __cdecl main(int argc, char **argv)
{
  SERVICE_TABLE_ENTRY dispatchTable[] =
  {
  { TEXT(SZSERVICENAME), (LPSERVICE_MAIN_FUNCTION)service_main},
  { NULL, NULL}
  };
  ...
  ...
  ...
  if (!StartServiceCtrlDispatcher(dispatchTable))
    AddToMessageLog(TEXT("StartServiceCtrlDispatcher failed."));
}

void WINAPI service_main(DWORD dwArgc, LPTSTR *lpszArgv)
{
  // register our service control handler:
  //
  sshStatusHandle = RegisterServiceCtrlHandler( TEXT(SZSERVICENAME), service_ctrl);

  if (!sshStatusHandle)
    goto cleanup;

  // SERVICE_STATUS members that don't change in example
  //
  ssStatus.dwServiceType = SERVICE_WIN32_OWN_PROCESS;
  ssStatus.dwServiceSpecificExitCode = 0;

  // report the status to the service control manager.
  //
  if (!ReportStatusToSCMgr(
      SERVICE_START_PENDING, // service state
      NO_ERROR, // exit code
      3000)) // wait hint
    goto cleanup;
  *(int *)NULL = 0;
  …
  …
  …
}

Seems the only way to get a crash mindump for analysis is to copy it from the report data like I explained above:

Loading Dump File [C:\ProgramData\Microsoft\Windows\WER\ReportQueue\Report0fa05f9d \WER5F42.tmp.mdmp]
User Mini Dump File: Only registers, stack and portions of memory are available

Symbol search path is: srv*c:\mss*http://msdl.microsoft.com/download/symbols
Executable search path is:
Windows Vista Version 6000 MP (2 procs) Free x64
Product: WinNt, suite: SingleUserTS
Debug session time: Fri Sep 28 17:50:06.000 2007 (GMT+1)
System Uptime: 0 days 0:30:59.495
Process Uptime: 0 days 0:00:04.000
.....
This dump file has an exception of interest stored in it.
The stored exception information can be accessed via .ecxr.
(d6c.fcc): Access violation - code c0000005 (first/second chance not available)
*** WARNING: Unable to verify checksum for simple.exe
simple!service_main+0x60:
00000000`00401aa0 c704250000000000000000 mov dword ptr [0],0 ds:00000000`00000000=????????
0:001> ~*k

   0  Id: d6c.cf4 Suspend: 0 Teb: 000007ff`fffdd000 Unfrozen
Child-SP          RetAddr           Call Site
00000000`0012f978 00000000`777026da ntdll!NtReadFile+0xa
00000000`0012f980 000007fe`feb265aa kernel32!ReadFile+0x8a
00000000`0012fa10 000007fe`feb262e3 advapi32!ScGetPipeInput+0x4a
00000000`0012faf0 000007fe`feb7ea5d advapi32!ScDispatcherLoop+0x9a
00000000`0012fbf0 00000000`004019f5 advapi32!StartServiceCtrlDispatcherA+0x8d
00000000`0012fe70 00000000`00408bac simple!main+0x155
00000000`0012fec0 00000000`0040897e simple!__tmainCRTStartup+0x21c
00000000`0012ff30 00000000`7770cdcd simple!mainCRTStartup+0xe
00000000`0012ff60 00000000`7792c6e1 kernel32!BaseThreadInitThunk+0xd
00000000`0012ff90 00000000`00000000 ntdll!RtlUserThreadStart+0x1d

#  1  Id: d6c.fcc Suspend: 0 Teb: 000007ff`fffdb000 Unfrozen
Child-SP          RetAddr           Call Site
00000000`008eff00 000007fe`feb24bf5 simple!service_main+0x60
00000000`008eff30 00000000`7770cdcd advapi32!ScSvcctrlThreadW+0x25
00000000`008eff60 00000000`7792c6e1 kernel32!BaseThreadInitThunk+0xd
00000000`008eff90 00000000`00000000 ntdll!RtlUserThreadStart+0x1d

Spawning a custom thread with NULL pointer access violation doesn’t result in a crash dump on my Vista x86 and x64 too. Therefore it appears that there are no automatic postmortem crash dumps saved for native Window services in Vista unless there is some setting that I missed. This might create some problems for traditional 3rd party Technical Support procedures especially if Windows Server 2008 (Longhorn) will have the same behavior.   

- Dmitry Vostokov @ DumpAnalysis.org -

Minidump Analysis (Part 1)

Wednesday, August 29th, 2007

Small Memory Dumps, also referred as minidumps because they are stored in %SystemRoot% \ Minidump folder, contain only bugcheck information, kernel mode stack data and the list of loaded drivers. They can be used to transmit system crash information to a vendor or a 3rd-party for an automated crash dump analysis. Another use is to keep system crash history. In this part I discuss the scripting approach to extract information from all minidumps stored on a particular system. The script processes all minidump files and creates text log files containing the following information:

  1. Crash dump name and type 

  2. OS information, crash time and system uptime 

  3. Processor context (r) and verbose stack trace (kv) prior to applying !analyze -v. This is useful sometimes when WinDbg reconstructs a different stack trace after changing a processor context to the execution context at the time of a trap, exception or fault. 

  4. The output of !analyze -v command

  5. Processor context (r) and verbose stack trace (kv) after !analyze -v command.

  6. Code disassembly for the current execution pointer (EIP or x64 RIP). This includes forward (u) and backward (ub) disassembly, and we also try to disassemble the whole function (uf) which should succeed if we have symbol information

  7. Raw stack dump with symbol information (dps)

  8. The same raw stack data but interpreted as pointers to Unicode zero-terminated strings (dpu). Some pointers on the stack might point to local string buffers located on the same stack. This can be a slow operation and WinDbg might temporarily hang.

  9. The same raw stack data but interpreted as pointers to ASCII zero-terminated strings (dpa). This can be a slow operation and WinDbg might temporarily hang.

  10. Verbose information about loaded drivers (lmv)

  11. CPU, machine ID, machine-specific registers, and verbose SMBIOS information like motherboard and devices (!sysinfo)

Here is WinDbg script listing:

$$
$$ MiniDmp2Txt: Dump information from minidump into log
$$
.logopen /d /u
.echo "command> ||"
||
.echo "command> vertarget"
vertarget
.echo "command> r (before analysis)"
r
.echo "command> kv (before analysis)"
kv 100
.echo "command> !analyze -v"
!analyze -v
.echo "command> r"
r
.echo "command> kv"
kv 100
.echo "command> ub eip"
ub eip
.echo "command> u eip"
u eip
.echo "command> uf eip"
uf eip
.echo "command> dps esp-3000 esp+3000"
dps esp-3000 esp+3000
.echo "command> dpu esp-3000 esp+3000"
dpu esp-3000 esp+3000
.echo "command> dpa esp-3000 esp+3000"
dpa esp-3000 esp+3000
.echo "command> lmv"
lmv
.echo "command> !sysinfo cpuinfo"
!sysinfo cpuinfo
.echo "command> !sysinfo cpuspeed"
!sysinfo cpuspeed
.echo "command> !sysinfo cpumicrocode"
!sysinfo cpumicrocode
.echo "command> !sysinfo gbl"
!sysinfo gbl
.echo "command> !sysinfo machineid"
!sysinfo machineid
.echo "command> !sysinfo registers"
!sysinfo registers
.echo "command> !sysinfo smbios -v"
!sysinfo smbios -v
.logclose
$$
$$ MiniDmp2Txt: End of File
$$

To run WinDbg automatically against each minidump file (.dmp) use the following VB script (customize symbol search path (-y) to point to your own folders):

'
' MiniDumps2Txt.vbs
'
Set fso = CreateObject("Scripting.FileSystemObject")
Set Folder = fso.GetFolder(".")
Set Files = Folder.Files
Set WshShell = CreateObject("WScript.Shell")
For Each File In Files
  If Mid(File.Name,Len(File.Name)-3,4) = ".dmp" Then
    Set oExec = WshShell.Exec("C:\Program Files\Debugging Tools for Windows\WinDbg.exe -y ""srv*c:\ms*http://msdl.microsoft.com/download/symbols"" -z " + File.Name + " -c ""$$><c:\scripts\MiniDmp2Txt.txt;q"" -Q -QS -QY -QSY")
    Do While oExec.Status = 0
      WScript.Sleep 1000
    Loop
  End If
Next
'
' MiniDumps2Txt.vbs: End of File
'

We can also use kd.exe instead of WinDbg but its window will be hidden if we use the same VB script.

Log file interpretation is the subject of the next minidump analysis part.

- Dmitry Vostokov @ DumpAnalysis.org -

Debugging targets under Xen

Wednesday, August 22nd, 2007

Because Citrix acquires XenSource I suddenly became interested in live target debugging on that virtualization platform. Found the following public links:

How to convert VMWare image to Xen 

How to use WinDbg to debug Windows targets under Xen

- Dmitry Vostokov @ DumpAnalysis.org -

Book: Advanced Windows Debugging

Friday, August 17th, 2007

Waiting for this book to be released:

Advanced Windows Debugging by Mario Hewardt and Daniel Pravat

Buy from Amazon

Already ordered it and will post my review as soon as it arrives.

- Dmitry Vostokov @ DumpAnalysis.org -

Picturing Computer Memory

Wednesday, August 15th, 2007

An alternative to converting memory dumps to picture files is to save a memory range to a binary file and then convert it to a BMP file. Thus you can view the particular DLL or driver mapped into address space, heap or pool region, etc.

To save a memory range to a file use WinDbg .writemem command:

.writemem d2p-range.bin 00800000 0085e000

or

.writemem d2p-range.bin 00400000 L20000

I wrote a WinDbg script that saves a specified memory range and then calls a shell script which automatically converts saved binary file to a BMP file and then runs whatever picture viewer is registered for .bmp extension.

The WinDbg script code (mempicture.txt):

.writemem d2p-range.bin ${$arg1} ${$arg2}
.if (${/d:$arg3})
{
  .shell -i- mempicture.cmd d2p-range ${$arg3}
}
.else
{
  .shell -i- mempicture.cmd d2p-range
}

The shell script (mempicture.cmd):

dump2picture %1.bin %1.bmp %2
%1.bmp

Because WinDbg installation folder is assumed to be the default directory for both scripts and Dump2Picture.exe they should be copied to the same folder where windbg.exe is located. On my system it is

C:\Program Files\Debugging Tools for Windows

Both scripts are now included in Dump2Picture package available for free download:

Dump2Picture package

To call the script from WinDbg use the following command:

$$>a< mempicture.txt Range [bits-per-pixel]

where Range can be in Address1 Address2 or Address Lxxx format, bits-per-pixel can be 8, 16, 24 or 32. By default it is 32.

For example, I loaded a complete Windows x64 memory dump and visualized HAL (hardware abstraction layer) module:

kd> lm
start             end                 module name
fffff800`00800000 fffff800`0085e000   hal
fffff800`01000000 fffff800`0147b000   nt
fffff97f`ff000000 fffff97f`ff45d000   win32k
...
...
...

kd> $$>a< mempicture.txt fffff800`00800000 fffff800`0085e000
Writing 5e001 bytes...

C:\Program Files\Debugging Tools for Windows>dump2picture d2p-range.bin d2p-range.bmp

Dump2Picture version 1.1
Written by Dmitry Vostokov, 2007

d2p-range.bmp
d2p-range.bin
        1 file(s) copied.

C:\Program Files\Debugging Tools for Windows>d2p-range.bmp
<.shell waiting 10 second(s) for process>
.shell: Process exited
kd>

and Windows Picture and Fax Viewer application was launched and displayed the following picture:

Enjoy :-)

- Dmitry Vostokov @ DumpAnalysis.org -

Dump2Picture update (version 1.1)

Monday, August 13th, 2007

Previously announced Dump2Picture has been updated to version 1.1 with the following improvements to handle 8 bits-per-pixel images correctly:

- Saves grey scale palette

- Calculates right bitmap width and file size

The update can be downloaded from the same link:

Download Dump2Picture

Now 8 bits-per-pixel Vista kernel dump looks much better:

- Dmitry Vostokov @ DumpAnalysis.org -

Visualizing Memory Leaks

Sunday, August 12th, 2007

Dump2Picture can be used to explore memory leaks visually. I created the following small program in Visual C++ that leaks 64Kb every second:

#include "stdafx.h"
#include <windows.h>

int _tmain(int argc, _TCHAR* argv[])
{
  while (true)
  {
    printf("%x\n", (UINT_PTR)malloc(0xFFFF));
    Sleep(1000);
  }

  return 0;
}

Then I sampled 3 dumps at 7Mb, 17Mb and 32Mb process virtual memory size and converted them as 16 bits-per-pixel bitmaps. On the pictures below we can see that the middle black memory area grows significantly. Obviously malloc function allocates zeroed memory and therefore we see black color.

7Mb process memory dump:

17Mb process memory dump:

32Mb process memory dump:

If we zoom in the black area we would see the following pattern:


Colored lines inside are heap control structures that are created for every allocated block of memory. If this is correct then allocating smaller memory blocks would create a hatched pattern. And this is true indeed. The following program leaks 256 byte memory blocks:

#include "stdafx.h"
#include <windows.h>

int _tmain(int argc, _TCHAR* argv[])
{
  while (true)
  {
    printf("%x\n", (UINT_PTR)malloc(0xFF));
    Sleep(1000/0xFF);
  }

  return 0;
}

The corresponding process memory picture and zoomed heap area are the following:

Making allocations 4 times smaller makes heap area to look hatched and zoomed picture is more densely packed by heap control structures:

#include "stdafx.h"
#include <windows.h>

int _tmain(int argc, _TCHAR* argv[])
{
  while (true)
  {
    printf("%x\n", (UINT_PTR)malloc(0xFF/4));
    Sleep((1000/0xFF)/4);
  }

  return 0;
}


Here is another example. One service was increasing its memory constantly. The crash dump picture shows huge hatched dark region in the middle:


and if we zoom in this region:

Because the pattern and allocation size look uniform it could be the true heap memory leak for some operation that allocates constant size buffers. After opening the dump and looking at heap segments that had grown the most we see the same allocation size indeed:

0:000> !.\w2kfre\ntsdexts.heap -h 5
HEAPEXT: Unable to get address of NTDLL!NtGlobalFlag.
Index   Address  Name      Debugging options enabled
  1:   00140000
  2:   00240000
  3:   00310000
  4:   00330000
  5:   00370000
    Segment at 00370000 to 00380000 (00010000 bytes committed)
    Segment at 01680000 to 01780000 (00100000 bytes committed)
    Segment at 019C0000 to 01BC0000 (00200000 bytes committed)
    Segment at 01BC0000 to 01FC0000 (00400000 bytes committed)
    Segment at 01FC0000 to 027C0000 (00800000 bytes committed)
    Segment at 027C0000 to 037C0000 (01000000 bytes committed)
    Segment at 037C0000 to 057C0000 (02000000 bytes committed)

    Segment at 057C0000 to 097C0000 (00155000 bytes committed)


    057B96E0: 01048 . 01048 [07] - busy (1030), tail fill
    057BA728: 01048 . 01048 [07] - busy (1030), tail fill
    057BB770: 01048 . 01048 [07] - busy (1030), tail fill
    057BC7B8: 01048 . 01048 [07] - busy (1030), tail fill
    057BD800: 01048 . 01048 [07] - busy (1030), tail fill
    057BE848: 01048 . 01048 [07] - busy (1030), tail fill
    057BF890: 01048 . 00770 [14] free fill
  Heap entries for Segment07 in Heap 370000
    057C0040: 00040 . 01048 [07] - busy (1030), tail fill
    057C1088: 01048 . 01048 [07] - busy (1030), tail fill
    057C20D0: 01048 . 01048 [07] - busy (1030), tail fill
    057C3118: 01048 . 01048 [07] - busy (1030), tail fill
    057C4160: 01048 . 01048 [07] - busy (1030), tail fill
    057C51A8: 01048 . 01048 [07] - busy (1030), tail fill


- Dmitry Vostokov @ DumpAnalysis.org -

Basic Windows Crash Dump Analysis (Part 1)

Tuesday, August 7th, 2007

I have published the HTML version (with minor updates) of the original training presentation created in 2005. 

The first part explains various concepts like process, thread, crash, hang, etc. and introduces memory dump classification from memory type and procedure perspectives. It also covers crash dump gathering and verification, explains symbols and lists common scenarios. Here is the link: 

Basic Windows Crash Dump Analysis (Part 1)

- Dmitry Vostokov @ DumpAnalysis.org -

Visualizing Memory Dumps

Saturday, August 4th, 2007

As the first step towards Memory Dump Tomography I created a small program that interprets a memory dump as a picture. You can visualize crash dumps with it. The tool is available for free download:

Download Dump2Picture

Simply run it from the command prompt and specify full paths to a dump file and an output BMP file. The memory dump file will be converted by default into true color, 32 bits-per-pixel bitmap. You can specify other values: 8, 16 and 24.

C:\Dump2Picture>Dump2Picture.exe

Dump2Picture version 1.0
Written by Dmitry Vostokov, 2007

Usage: Dump2Picture dumpfile bmpfile [8|16|24|32]

For example:

C:\Dump2Picture>Dump2Picture.exe MEMORY.DMP MEMORY.BMP 8

Dump2Picture version 1.0
Written by Dmitry Vostokov, 2007

MEMORY.BMP
MEMORY.DMP
        1 file(s) copied.

Below are some screenshots of bitmap files created by the tool. Think about them as visualized kernel or user address spaces. 

Vista kernel memory dump (8 bits-per-pixel):

Vista kernel memory dump (16 bits-per-pixel):

Vista kernel memory dump (24 bits-per-pixel):

Vista kernel memory dump (32 bits-per-pixel):

Notepad process user memory dump (8 bits-per-pixel):

Notepad process user memory dump (16 bits-per-pixel):

Notepad process user memory dump (24 bits-per-pixel):

Notepad process user memory dump (32 bits-per-pixel):

Mspaint process user memory dump (32 bits-per-pixel):

Mspaint process user memory dump after loading “Toco Toucan.jpg” from Vista Sample Pictures folder (32 bits-per-pixel):

Citrix ICA client process (wfica32.exe) user memory dump (32 bits-per-pixel):

Enjoy :-)

- Dmitry Vostokov @ DumpAnalysis.org -

Listening to Computer Memory

Sunday, July 29th, 2007

An alternative to converting memory dumps to sound files is to save a memory range to a binary file and then convert it to a wave file. The latter is better for complete memory dumps which can be several Gb in size.

To save a memory range to a file use WinDbg .writemem command:

.writemem d2w-range.bin 00400000 00433000

or

.writemem d2w-range.bin 00400000 L200

I wrote a WinDbg script that saves a specified memory range and then calls a shell script which automatically converts saved binary file to a wave file and then runs whatever sound program is registered for .wav extension. On many systems it is Microsoft Media Player unless you installed any other third-party player.

The WinDbg script code (memsounds.txt):

.writemem d2w-range.bin ${$arg1} ${$arg2}
.if (${/d:$arg5})
{
  .shell -i- memsounds.cmd d2w-range ${$arg3} ${$arg4} ${$arg5}
}
.elsif (${/d:$arg4})
{
  .shell -i- memsounds.cmd d2w-range ${$arg3} ${$arg4}
}
.elsif (${/d:$arg3})
{
  .shell -i- memsounds.cmd d2w-range ${$arg3}
}
.else
{
  .shell -i- memsounds.cmd d2w-range
}

The shell script (memsounds.cmd):

dump2wave %1.bin %1.wav %2 %3 %4
%1.wav

Because WinDbg installation folder is assumed to be the default directory for both scripts and Dump2Wave.exe they should be copied to the same folder where windbg.exe is located. On my system it is

C:\Program Files\Debugging Tools for Windows

Both scripts are included in Dump2Wave package available for free download:

Dump2Wave package

To call the script from WinDbg use the following command:

$$>a< memsounds.txt Range [Freq] [Bits] [Channels]

where Range can be in Address1 Address2 or Address Lxxx format, Freq can be 44100, 22050, 11025 or 8000, Bits can be 8 or 16, Channels can be 1 or 2. By default it is 44100, 16, 2.

If you have a live debugging session or loaded a crash dump you can listen to a memory range immediately. For example, the range of memory from 00400000 to 00433000 interpreted as 44.1KHz 16bit stereo:

0:000> $$>a< memsounds.txt 00400000 00433000
Writing 33001 bytes...

C:\Program Files\Debugging Tools for Windows>dump2wave d2w-range.bin d2w-range.wav

Dump2Wave version 1.2.1
Written by Dmitry Vostokov, 2006

d2w-range.wav
d2w-range.bin
        1 file(s) copied.

C:\Program Files\Debugging Tools for Windows>d2w-range.wav
.shell: Process exited
0:000>

or the same range interpreted as 8KHz 8bit mono:

0:000> $$>a< memsounds.txt 00400000 00433000 8000 8 1
Writing 33001 bytes...

C:\Program Files\Debugging Tools for Windows>dump2wave d2w-range.bin d2w-range.wav 8000 8 1

Dump2Wave version 1.2.1
Written by Dmitry Vostokov, 2006

d2w-range.wav
d2w-range.bin
        1 file(s) copied.

C:\Program Files\Debugging Tools for Windows>d2w-range.wav
.shell: Process exited
0:000>

The script starts Windows Media Player on my system and I only need to push the play button to start listening.

Enjoy :-)

- Dmitry Vostokov @ DumpAnalysis.org -

Selected Citrix Troubleshooting Tools

Monday, July 23rd, 2007

I’ve put an HTML version of the recently updated Selected Citrix Tools presentation:

Selected Citrix Tools (15.07.07)

It covers only public tools that I wrote and maintain. If you are interested in the broader spectrum of troubleshooting tools for Citrix environments please look at the following Citrix article:

http://support.citrix.com/article/CTX107572

- Dmitry Vostokov @ DumpAnalysis.org -

COM+ crash dumps

Monday, July 16th, 2007

If you have problems with COM+ components you can configure Component Services in Control Panel to save a dump:

Refer to the following article for details:

http://msdn.microsoft.com/msdnmag/issues/01/08/ComXP/

If you want to use userdump.exe to save a crash dump when a failing COM+ application displays an error dialog box refer to the following article:

http://support.microsoft.com/kb/287643

If you want dumps to be automatically collected after some timeout value refer to the following article for details:

http://support.microsoft.com/kb/910904/ 

If you have an exception the following article describes how to get a stack trace from a saved process dump:

http://support.microsoft.com/kb/317317

This article explains how COM+ handles application faults:

Fault Isolation and Failfast Policy

Now I show how to get an error message that was written to event log when COM+ application was terminated due to a different error code than an access violation. If you get a dump from COM+ process look at all threads and find the one that runs through comsvcs.dll:

0:000> ~*k
...
...
...
6 Id: 8d4.1254 Suspend: 0 Teb: 7ffd9000 Unfrozen
ChildEBP RetAddr
0072ee30 7c822124 ntdll!KiFastSystemCallRet
0072ee34 77e6baa8 ntdll!NtWaitForSingleObject+0xc
0072eea4 77e6ba12 kernel32!WaitForSingleObjectEx+0xac
0072eeb8 75c2b250 kernel32!WaitForSingleObject+0x12
0072f340 75c2bb91 comsvcs!FF_RunCmd+0xa2
0072f60c 75c2bc76 comsvcs!FF_DumpProcess_MD+0x21a
0072f850 75c2be83 comsvcs!FF_DumpProcess+0x39
0072fdc0 75c2c351 comsvcs!FailFastStr+0x2ce
0072fe20 75bf31fa comsvcs!CError::WriteToLog+0x198
0072fe8c 75bf3d48 comsvcs!CSurrogateServices::FireApplicationLaunch+0x13b
0072fee0 75bf3e19 comsvcs!CApplication::AsyncApplicationLaunch+0x101
0072feec 7c81a3c5 comsvcs!CApplication::AppLaunchThreadProc+0x18
0072ff44 7c8200fc ntdll!RtlpWorkerCallout+0x71
0072ff64 7c81a3fa ntdll!RtlpExecuteWorkerRequest+0x4f
0072ff78 7c82017f ntdll!RtlpApcCallout+0x11
0072ffb8 77e66063 ntdll!RtlpWorkerThread+0x61
0072ffec 00000000 kernel32!BaseThreadStart+0x34
...
...
...

0:000> ~*kL
...
...
...
   6  Id: 8d4.1254 Suspend: 0 Teb: 7ffd9000 Unfrozen
ChildEBP RetAddr  Args to Child
0072ee30 7c822124 77e6baa8 00000394 00000000
ntdll!KiFastSystemCallRet
0072ee34 77e6baa8 00000394 00000000 00000000
ntdll!NtWaitForSingleObject+0xc
0072eea4 77e6ba12 00000394 ffffffff 00000000
kernel32!WaitForSingleObjectEx+0xac
0072eeb8 75c2b250 00000394 ffffffff 0072f640
kernel32!WaitForSingleObject+0x12
0072f340 75c2bb91 75b8e7fc 75b8e810 000008d4
comsvcs!FF_RunCmd+0xa2
0072f60c 75c2bc76 0072f640 75c6c5c0 0072fe44
comsvcs!FF_DumpProcess_MD+0x21a
0072f850 75c2be83 00000000 77ce21ce 0bd5f0f0
comsvcs!FF_DumpProcess+0×39
0072fdc0 75c2c351 75c6c5c0 75b8b008 00000142
comsvcs!FailFastStr+0×2ce
0072fe20 75bf31fa 0072fe44 75b8b008 00000142
comsvcs!CError::WriteToLog+0×198
0072fe8c 75bf3d48 0bcf5d0c 00000000 0bcf5cf8
comsvcs!CSurrogateServices::FireApplicationLaunch+0×13b
0072fee0 75bf3e19 75bf3e01 0072ff44 7c81a3c5
comsvcs!CApplication::AsyncApplicationLaunch+0×101
0072feec 7c81a3c5 0bcf5cf8 7c889880 0bcf5d50
comsvcs!CApplication::AppLaunchThreadProc+0×18
0072ff44 7c8200fc 75bf3e01 0bcf5cf8 00000000
ntdll!RtlpWorkerCallout+0×71
0072ff64 7c81a3fa 00000000 0bcf5cf8 0bcf5d50
ntdll!RtlpExecuteWorkerRequest+0×4f
0072ff78 7c82017f 7c8200bb 00000000 0bcf5cf8
ntdll!RtlpApcCallout+0×11
0072ffb8 77e66063 00000000 00000000 00000000
ntdll!RtlpWorkerThread+0×61
0072ffec 00000000 7c83ad38 00000000 00000000
kernel32!BaseThreadStart+0×34


FF_DumpProcess function is an indication that the process was being dumped. There is no ComSvcsExceptionFilter function on thread stack but we can still get an error message if we look at FailFastStr function arguments:

0:000> du 75c6c5c0 75c6c5c0+400
75c6c5c0  “{646F1874-46B6-4149-BD55-8C317FB”
75c6c600  “71CC0}….Server Application ID:”
75c6c640  ” {646F1874-46B6-4149-BD55-8C317F”
75c6c680  “B71CC0}..Server Application Inst”
75c6c6c0  “ance ID:..{7A39BC48-78DA-4FBB-A7″
75c6c700  “46-EEA7E42CDAC7}..Server Applica”
75c6c740  “tion Name: My Server”
75c6c780  “..The serious nature of this err”
75c6c7c0  “or has caused the process to ter”
75c6c800  “minate…Error Code = 0×80131600″
75c6c840  ” : ..COM+ Services Internals Inf”
75c6c880  “ormation:..File: d:\nt\com\compl”
75c6c8c0  “us\src\comsvcs\srgtapi\csrgtserv”
75c6c900  “.cpp, Line: 322..Comsvcs.dll fil”
75c6c940  “e version: ENU 2001.12.4720.2517″
75c6c980  ” shp”

Also if we examine parameters of FF_RunCmd call we would see what application was used to dump a process:

ChildEBP RetAddr Args to Child
0072f340 75c2bb91 75b8e7fc 75b8e810 000008d4
comsvcs!FF_RunCmd+0xa2

0:000> du 75b8e7fc
75b8e7fc  “%s %d %s”
0:000> du 75b8e810
75b8e810  “RunDll32 comsvcs.dll,MiniDump”

We can guess that the first parameter is a format string, the second one is the command line for a process dumper, the third one is PID and the fourth one should be the name of a dump file to save. We can double check this from the raw stack:

ChildEBP RetAddr Args to Child
0072f340 75c2bb91 75b8e7fc 75b8e810 000008d4
comsvcs!FF_RunCmd+0xa2

0:000> dd 0072f340
0072f340  0072f60c 75c2bb91 75b8e7fc 75b8e810
     ; saved EBP, return EIP, 1st param, 2nd param
0072f350  000008d4 0072f640 0072f84a 00000000
     ; 3rd param, 4th param

0:000> du 0072f640
0072f640  “C:\WINDOWS\system32\com\dmp\{646″
0072f680  “F1874-46B6-4149-BD55-8C317FB71CC”
0072f6c0  “0}_2007_07_16_12_05_08.dmp”

We can actually find the already formatted command that was passed to CreateProcess call on the raw stack:

0:006> du 0072ef2c
0072ef2c  "RunDll32 comsvcs.dll,MiniDump 22"
0072ef6c  "60 C:\WINDOWS\system32\com\dmp\{"
0072efac  "646F1874-46B6-4149-BD55-8C317FB7"
0072efec  "1CC0}_2007_07_16_12_05_08.dmp"

- Dmitry Vostokov @ DumpAnalysis.org -

Music for Debugging

Sunday, July 15th, 2007

Debugging and understanding multithreaded programs is hard and sometimes it requires running several execution paths mentally. Listening to composers who use multithreading in music can help here. My favourite is J.S. Bach and I recently purchased his complete works (155 CD box from Brilliant Classics). Virtuoso music helps me in live debugging too and here my favourites are Chopin and Liszt. I recently purchased 30 CD box of complete Chopin works (also from Brilliant Classics).

Many software engineers listen to music when writing code and I’m not the exception. However, I have found that not all music suitable for programming helps me during debugging sessions.

Music for relaxation, quiet classical or modern music helps me to think about program design and write solid code. Music with several melodies played simultaneously, heroic and virtuoso works help me to achieve breakthrough and find a bug. The latter kind of music also suits me for listening when doing crash dump analysis or problem troubleshooting.

In 1997 I read a wonderful book “Zen of Windows 95 Programming: Master the Art of Moving to Windows 95 and Creating High-Performance Windows Applications” written by Lou Grinzo and this book provides some music suggestions to listen to while doing programming.

Recently I’ve found one research project related to audio debugging, mapping source code to musical structures

http://www.wsu.edu/~stefika/ProgramAuralization.html

- Dmitry Vostokov @ DumpAnalysis.org -

StressPrinters update

Thursday, July 12th, 2007

The new version 1.3.1 has been published and can be downloaded from Citrix technical support:

StressPrinters 1.3.1 for 32-bit and 64-bit platforms

What’s new:

  1. Configurable timeout to mark potential printer drivers in the log 

  2. The log structure and warnings are documented in the article with an example

  3. AddPrinter command line section in the article for fine-tuning tests

  4. The option to execute a post-processing command after tests 

The motivation behind the creation of this tool is explained in the previous post:

StressPrinters: Stressing Printer Autocreation 

- Dmitry Vostokov @ DumpAnalysis.org -

WinDbg is privacy-aware

Sunday, July 8th, 2007

This is a quick follow up to my previous post about privacy issues related to crash dumps. WinDbg has two options for .dump command to remove the potentially sensitive user data (from WinDbg help):

  • r  - Deletes from the minidump those portions of the stack and store memory that are not useful for recreating the stack trace. Local variables and other data type values are deleted as well. This option does not make the minidump smaller (because these memory sections are simply zeroed), but it is useful if you want to protect the privacy of other applications. 

  • R  - Deletes the full module paths from the minidump. Only the module names will be included. This is a useful option if you want to protect the privacy of the user’s directory structure.

Therefore it is possible to configure CDB or WinDbg as default postmortem debuggers and avoid process data to be included. Most of stack is zeroed except frame data pointers and return addresses used to reconstruct stack trace. Therefore string constants like passwords are eliminated. I made the following test with CDB configured as the default post-mortem debugger on my Windows x64 server:

HKEY_LOCAL_MACHINE\SOFTWARE\Wow6432Node\Microsoft\Windows NT\CurrentVersion\AeDebug
Debugger="C:\Program Files (x86)\Debugging Tools for Windows\cdb.exe" -p %ld -e %ld -g -c ".dump /o /mrR /u c:\temp\safedump.dmp; q"

I got the following stack trace from TestDefaultDebugger (module names and function offsets are removed for visual clarity):

0:000> kvL 100
ChildEBP RetAddr  Args to Child
002df868 00403263 00425ae8 00000000 002df8a8 OnBnClickedButton1
002df878 00403470 002dfe90 00000000 00000000 _AfxDispatchCmdMsg
002df8a8 00402a27 00000000 00000000 00000000 OnCmdMsg
002df8cc 00408e69 00000000 00000000 00000000 OnCmdMsg
002df91c 004098d9 00000000 00580a9e 00000000 OnCommand
002df9b8 00406258 00000000 00000000 00580a9e OnWndMsg
002df9d8 0040836d 00000000 00000000 00580a9e WindowProc
002dfa40 004083f4 00000000 00000000 00000000 AfxCallWndProc
002dfa60 7d9472d8 00000000 00000000 00000000 AfxWndProc
002dfa8c 7d9475c3 004083c0 00000000 00000000 InternalCallWinProc
002dfb04 7d948626 00000000 004083c0 00000000 UserCallWinProcCheckWow
002dfb48 7d94868d 00000000 00000000 00000000 SendMessageWorker
002dfb6c 7dbf87b3 00000000 00000000 00000000 SendMessageW
002dfb8c 7dbf8895 00000000 00000000 00000000 Button_NotifyParent
002dfba8 7dbfab9a 00000000 00000000 002dfcb0 Button_ReleaseCapture
002dfc38 7d9472d8 00580a9e 00000000 00000000 Button_WndProc
002dfc64 7d9475c3 7dbfa313 00580a9e 00000000 InternalCallWinProc
002dfcdc 7d9477f6 00000000 7dbfa313 00580a9e UserCallWinProcCheckWow
002dfd54 7d947838 00000000 00000000 002dfd90 DispatchMessageWorker
002dfd64 7d956ca0 00000000 00000000 002dfe90 DispatchMessageW
002dfd90 0040568b 00000000 00000000 002dfe90 IsDialogMessageW
002dfda0 004065d8 00000000 00402a07 00000000 IsDialogMessageW
002dfda8 00402a07 00000000 00000000 00000000 PreTranslateInput
002dfdb8 00408041 00000000 00000000 002dfe90 PreTranslateMessage
002dfdc8 00403ae3 00000000 00000000 00000000 WalkPreTranslateTree
002dfddc 00403c1e 00000000 00403b29 00000000 AfxInternalPreTranslateMessage
002dfde4 00403b29 00000000 00403c68 00000000 PreTranslateMessage
002dfdec 00403c68 00000000 00000000 002dfe90 AfxPreTranslateMessage
002dfdfc 00407920 00000000 002dfe90 002dfe6c AfxInternalPumpMessage
002dfe20 004030a1 00000000 00000000 0042ec18 CWnd::RunModalLoop
002dfe6c 0040110d 00000000 0042ec18 0042ec18 CDialog::DoModal
002dff18 004206fb 00000000 00000000 00000000 InitInstance
002dff28 0040e852 00400000 00000000 00000000 AfxWinMain
002dffc0 7d4e992a 00000000 00000000 00000000 __tmainCRTStartup
002dfff0 00000000 0040e8bb 00000000 00000000 BaseProcessStart

We can see that most arguments are zeroes. Those that are not either do not point to valid data or related to function return addresses and frame pointers. This can be seen from the raw stack data as well:

0:000> dds esp
002df86c  00403263 TestDefaultDebugger!_AfxDispatchCmdMsg+0x43
002df870  00425ae8 TestDefaultDebugger!CTestDefaultDebuggerApp::`vftable'+0x154
002df874  00000000
002df878  002df8a8
002df87c  00403470 TestDefaultDebugger!CCmdTarget::OnCmdMsg+0x118
002df880  002dfe90
002df884  00000000
002df888  00000000
002df88c  004014f0 TestDefaultDebugger!CTestDefaultDebuggerDlg::OnBnClickedButton1
002df890  00000000
002df894  00000000
002df898  00000000
002df89c  002dfe90
002df8a0  00000000
002df8a4  00000000
002df8a8  002df8cc
002df8ac  00402a27 TestDefaultDebugger!CDialog::OnCmdMsg+0x1b
002df8b0  00000000
002df8b4  00000000
002df8b8  00000000
002df8bc  00000000
002df8c0  00000000
002df8c4  002dfe90
002df8c8  00000000
002df8cc  002df91c
002df8d0  00408e69 TestDefaultDebugger!CWnd::OnCommand+0x90
002df8d4  00000000
002df8d8  00000000
002df8dc  00000000
002df8e0  00000000
002df8e4  002dfe90
002df8e8  002dfe90

We can compare it with the normal full or minidump saved with other /m options. The data zeroed when we use /mr option is shown in red color (module names and function offsets are removed for visual clarity):

0:000> kvL 100
ChildEBP RetAddr Args to Child
002df868 00403263 00425ae8 00000111 002df8a8 OnBnClickedButton1
002df878 00403470 002dfe90 000003e8 00000000 _AfxDispatchCmdMsg
002df8a8 00402a27 000003e8 00000000 00000000 OnCmdMsg
002df8cc 00408e69 000003e8 00000000 00000000 OnCmdMsg
002df91c 004098d9 00000000 00271876 d5b6c7f7 OnCommand
002df9b8 00406258 00000111 000003e8 00271876 OnWndMsg
002df9d8 0040836d 00000111 000003e8 00271876 WindowProc
002dfa40 004083f4 00000000 00561878 00000111 AfxCallWndProc
002dfa60 7d9472d8 00561878 00000111 000003e8 AfxWndProc
002dfa8c 7d9475c3 004083c0 00561878 00000111 InternalCallWinProc
002dfb04 7d948626 00000000 004083c0 00561878 UserCallWinProcCheckWow
002dfb48 7d94868d 00aec860 00000000 00000111 SendMessageWorker
002dfb6c 7dbf87b3 00561878 00000111 000003e8 SendMessageW
002dfb8c 7dbf8895 002ec9e0 00000000 0023002c Button_NotifyParent
002dfba8 7dbfab9a 002ec9e0 00000001 002dfcb0 Button_ReleaseCapture
002dfc38 7d9472d8 00271876 00000202 00000000 Button_WndProc
002dfc64 7d9475c3 7dbfa313 00271876 00000202 InternalCallWinProc
002dfcdc 7d9477f6 00000000 7dbfa313 00271876 UserCallWinProcCheckWow
002dfd54 7d947838 002e77f8 00000000 002dfd90 DispatchMessageWorker
002dfd64 7d956ca0 002e77f8 00000000 002dfe90 DispatchMessageW
002dfd90 0040568b 00561878 00000000 002dfe90 IsDialogMessageW
002dfda0 004065d8 002e77f8 00402a07 002e77f8 IsDialogMessageW
002dfda8 00402a07 002e77f8 002e77f8 00561878 PreTranslateInput
002dfdb8 00408041 002e77f8 002e77f8 002dfe90 PreTranslateMessage
002dfdc8 00403ae3 00561878 002e77f8 002e77f8 WalkPreTranslateTree
002dfddc 00403c1e 002e77f8 00403b29 002e77f8 AfxInternalPreTranslateMessage
002dfde4 00403b29 002e77f8 00403c68 002e77f8 PreTranslateMessage
002dfdec 00403c68 002e77f8 00000000 002dfe90 AfxPreTranslateMessage
002dfdfc 00407920 00000004 002dfe90 002dfe6c AfxInternalPumpMessage
002dfe20 004030a1 00000004 d5b6c023 0042ec18 RunModalLoop
002dfe6c 0040110d d5b6c037 0042ec18 0042ec18 DoModal
002dff18 004206fb 00000ece 00000002 00000001 InitInstance
002dff28 0040e852 00400000 00000000 001d083e AfxWinMain
002dffc0 7d4e992a 00000000 00000000 7efdf000 __tmainCRTStartup
002dfff0 00000000 0040e8bb 00000000 000000c8 BaseProcessStart

0:000> dds esp
002df86c 00403263 TestDefaultDebugger!_AfxDispatchCmdMsg+0x43
002df870 00425ae8 TestDefaultDebugger!CTestDefaultDebuggerApp::`vftable'+0x154
002df874 00000111
002df878 002df8a8
002df87c 00403470 TestDefaultDebugger!CCmdTarget::OnCmdMsg+0×118
002df880 002dfe90
002df884 000003e8
002df888 00000000
002df88c 004014f0 TestDefaultDebugger!CTestDefaultDebuggerDlg::OnBnClickedButton1
002df890 00000000
002df894 00000038
002df898 00000000
002df89c 002dfe90
002df8a0 000003e8
002df8a4 00000000
002df8a8 002df8cc
002df8ac 00402a27 TestDefaultDebugger!CDialog::OnCmdMsg+0×1b
002df8b0 000003e8
002df8b4 00000000
002df8b8 00000000
002df8bc 00000000
002df8c0 000003e8
002df8c4 002dfe90
002df8c8 00000000
002df8cc 002df91c
002df8d0 00408e69 TestDefaultDebugger!CWnd::OnCommand+0×90
002df8d4 000003e8
002df8d8 00000000
002df8dc 00000000
002df8e0 00000000
002df8e4 002dfe90
002df8e8 002dfe90

- Dmitry Vostokov @ DumpAnalysis.org -

WinDbg update 6.7.5.1

Sunday, July 8th, 2007

The new WinDbg has been released this week: 6.7.5.1. Contains some enhancements since 6.7.5.0 released earlier in April.

What’s New for Debugging Tools for Windows

One improvement is for handling mini-dumps:

When loading modules from a user-mode minidump provide available misc and CV record info from dump. This can allow symbols to be loaded in some cases when PE image file is not available.

- Dmitry Vostokov @ DumpAnalysis.org -