Archive for the ‘Tools’ Category

Resolving security issues with crash dumps

Sunday, July 8th, 2007

It is a well known fact that crash dumps may contain sensitive and private information. Crash reports that contain binary process extracts may contain it too. There is a conflict here between the desire to get full memory contents for debugging purposes and possible security implications. The solution would be to have postmortem debuggers and user mode process dumpers to implement an option to save only the activity data like stack traces in a text form. Some problems on a system level can be corrected just by looking at thread stack traces, critical section list, full module information, thread times and so on. This can help to identify components that cause process crashes, hangs or CPU spikes.

Users or system administrators can review text data before sending it outside their environment. This was already implemented as Dr. Watson logs. However these logs don’t usually have sufficient information required for crash dump analysis compared to information we can extract from a dump using WinDbg, for example. If you need to analyze kernel and all process activities you can use scripts to convert your kernel and complete memory dumps to text files:

Dmp2Txt: Solving Security Problem

The similar scripts can be applied to user dumps:

Using scripts to process hundreds of user dumps

Generating good scripts in a production environment has one problem: the conversion tool or debugger needs to know about symbols. This can be easily done with Microsoft modules because of Microsoft public symbol server.  Other companies like Citrix have the option to download public symbols:

Debug Symbols for Citrix Presentation Server

Alternatively one can write a WinDbg extension that loads a text file with stack traces, appropriate module images, finds the right PDB files and presents stack traces with full symbolic information. This can also be a separate program that uses Visual Studio DIA (Debug Interface Access) SDK to access PDB files later after receiving a text file from a customer.

I’m currently experimenting with some approaches and will write about them later. Text files will also be used in Internet Based Crash Dump Analysis Service because it is much easier to process text files than crash dumps. Although it is feasible to submit small mini dumps for this purpose they don’t contain much information and require writing specialized OS specific code to parse them. Also text files having the same file size can contain much more useful information without exposing private and sensitive information.

I would appreciate any comments and suggestions regarding this problem. 

- Dmitry Vostokov @ DumpAnalysis.org -

PDBFinder (public version 3.5)

Sunday, July 1st, 2007

Version 3.5 uses the new binary database format and achieves the following results compare to the previous version 3.0.1:

  • 2 times smaller database size
  • 5 times faster database load time on startup!

It is fully backwards compatible with 3.0.1 and 2.x database formats and silently converts your old database to the new format on the first load.

Additionally the new version fixes the bug in version 3.0.1 sometimes manifested when removing and then adding folders before building the new database which resulted in incorrectly built database. 

The next version 4.0 is currently under development and it will have the following features:

  • The ability to open multiple databases
  • The ability to exclude certain folders during build to avoid excessive search results output
  • Fully configurable OS and language search options (which are currently disabled for public version)

PDBFinder upgrade is available for download from Citrix support.

If you still use version 2.x there is some additional information about features in version 3.5:

http://www.dumpanalysis.org/blog/index.php/2007/05/04/pdbfinder-public-version-301/

- Dmitry Vostokov @ DumpAnalysis.org -

Correcting Microsoft article about userdump.exe

Thursday, June 28th, 2007

There is much confusion among Microsoft and Citrix customers on how to use userdump.exe to save a process dump. Microsoft published an article about userdump.exe and it has the following title:

How to use the Userdump.exe tool to create a dump file

Unfortunately all scenarios listed there start with:

1. Run the Setup.exe program for your processor.

It also says:

<…> move to the version of Userdump.exe for your processor at the command prompt 

I would like to correct the article here. You don’t need to run setup.exe, you just need to copy userdump.exe and dbghelp.dll. The latter is important because the version of that DLL in your system32 folder can be older and userdump.exe will not start:

C:\kktools\userdump8.1\x64>userdump.exe

!!!!!!!!!! Error !!!!!!!!!!
Unsupported DbgHelp.dll version.
Path   : C:\W2K3\system32\DbgHelp.dll
Version: 5.2.3790.1830

C:\kktools\userdump8.1\x64>

For most customers running setup.exe and configuring the default rules in Exception Monitor creates the significant amount of false positive dumps. If we want to manually dump a process we don’t need automatically generated dumps or fine tune Exception Monitor rules to reduce the number of dumps.

Just an additional note: if you have an error dialog box showing that a program got an exception you can find that process in Task Manager and use userdump.exe to save that process dump manually. Then inside the dump it is possible to see that error. Therefore in the case when a default postmortem debugger wasn’t configured in the registry you can still get a dump for postmortem crash dump analysis. Here is an example. I removed a postmortem debugger from

HKEY_LOCAL_MACHINE\SOFTWARE\Microsoft\Windows NT\CurrentVersion\AeDebug
Debugger=

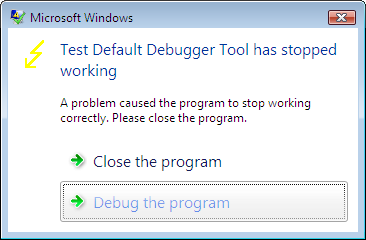
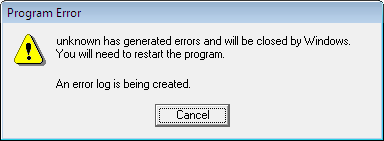
Now if we run TestDefaultDebugger tool and hit the big crash button we get the following message box:


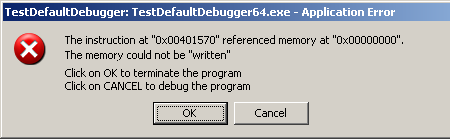
If we save TestDefaultDebugger process dump manually using userdump.exe when this message box is shown

C:\kktools\userdump8.1\x64>userdump.exe 5264 c:\tdd.dmp
User Mode Process Dumper (Version 8.1.2929.4)
Copyright (c) Microsoft Corp. All rights reserved.
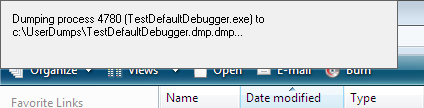
Dumping process 5264 (TestDefaultDebugger64.exe) to
c:\tdd.dmp...
The process was dumped successfully.

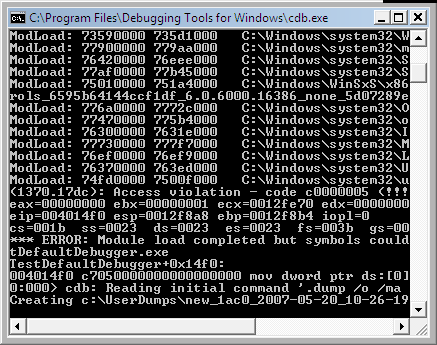
and open it in WinDbg we can see the problem thread there:

0:000> kn
#  Child-SP          RetAddr           Call Site
00 00000000`0012dab8 00000000`77dbfb3b ntdll!ZwRaiseHardError+0xa
01 00000000`0012dac0 00000000`004148c6 kernel32!UnhandledExceptionFilter+0x6c8
02 00000000`0012e2f0 00000000`004165f6 TestDefaultDebugger64!__tmainCRTStartup$filt$0+0x16
03 00000000`0012e320 00000000`78ee4bdd TestDefaultDebugger64!__C_specific_handler+0xa6
04 00000000`0012e3b0 00000000`78ee685a ntdll!RtlpExecuteHandlerForException+0xd
05 00000000`0012e3e0 00000000`78ef3a5d ntdll!RtlDispatchException+0x1b4
06 00000000`0012ea90 00000000`00401570 ntdll!KiUserExceptionDispatch+0x2d
07 00000000`0012f028 00000000`00403d4d TestDefaultDebugger64!CTestDefaultDebuggerDlg::OnBnClickedButton1
08 00000000`0012f030 00000000`00403f75 TestDefaultDebugger64!_AfxDispatchCmdMsg+0xc1
09 00000000`0012f070 00000000`004030cc TestDefaultDebugger64!CCmdTarget::OnCmdMsg+0x169
0a 00000000`0012f0f0 00000000`0040c18d TestDefaultDebugger64!CDialog::OnCmdMsg+0x28
0b 00000000`0012f150 00000000`0040cfbd TestDefaultDebugger64!CWnd::OnCommand+0xc9
0c 00000000`0012f200 00000000`0040818f TestDefaultDebugger64!CWnd::OnWndMsg+0x55
0d 00000000`0012f360 00000000`0040b2e5 TestDefaultDebugger64!CWnd::WindowProc+0x33
0e 00000000`0012f3c0 00000000`0040b3d2 TestDefaultDebugger64!AfxCallWndProc+0xf1
0f 00000000`0012f480 00000000`77c439fc TestDefaultDebugger64!AfxWndProc+0x4e
10 00000000`0012f4e0 00000000`77c432ba user32!UserCallWinProcCheckWow+0x1f9
11 00000000`0012f5b0 00000000`77c4335b user32!SendMessageWorker+0x68c
12 00000000`0012f650 000007ff`7f07c5af user32!SendMessageW+0x9d
13 00000000`0012f6a0 000007ff`7f07eb8e comctl32!Button_ReleaseCapture+0x14f

The second parameter to RtlDispatchException is the pointer to the exception context so if we dump the stack trace verbosely we can get that pointer and pass it to .cxr command:

0:000> kv
Child-SP          RetAddr           : Args to Child
...
...
...
00000000`0012e3e0 00000000`78ef3a5d : 00000000`0040c9ec 00000000`0012ea90 00000000`00000001 00000000`00000111 : ntdll!RtlDispatchException+0×1b4


0:000> .cxr 00000000`0012ea90
rax=0000000000000000 rbx=0000000000000001 rcx=000000000012fd70
rdx=00000000000003e8 rsi=000000000012fd70 rdi=0000000000432e90
rip=0000000000401570 rsp=000000000012f028 rbp=0000000000000111
 r8=0000000000000000  r9=0000000000401570 r10=0000000000401570
r11=000000000015abb0 r12=0000000000000000 r13=00000000000003e8
r14=0000000000000110 r15=0000000000000001
iopl=0 nv up ei pl zr na po nc
cs=0033 ss=002b ds=002b es=002b fs=0053 gs=002b efl=00010246
TestDefaultDebugger64!CTestDefaultDebuggerDlg::OnBnClickedButton1:
00000000`00401570 c704250000000000000000 mov dword ptr [0],0 ds:00000000`00000000=????????

We see that it was NULL pointer dereference that caused the process termination. Now we can dump the full stack trace that led to our crash:

0:000> kn 100
#  Child-SP          RetAddr           Call Site
00 00000000`0012f028 00000000`00403d4d TestDefaultDebugger64!CTestDefaultDebuggerDlg::OnBnClickedButton1
01 00000000`0012f030 00000000`00403f75 TestDefaultDebugger64!_AfxDispatchCmdMsg+0xc1
02 00000000`0012f070 00000000`004030cc TestDefaultDebugger64!CCmdTarget::OnCmdMsg+0x169
03 00000000`0012f0f0 00000000`0040c18d TestDefaultDebugger64!CDialog::OnCmdMsg+0x28
04 00000000`0012f150 00000000`0040cfbd TestDefaultDebugger64!CWnd::OnCommand+0xc9
05 00000000`0012f200 00000000`0040818f TestDefaultDebugger64!CWnd::OnWndMsg+0x55
06 00000000`0012f360 00000000`0040b2e5 TestDefaultDebugger64!CWnd::WindowProc+0x33
07 00000000`0012f3c0 00000000`0040b3d2 TestDefaultDebugger64!AfxCallWndProc+0xf1
08 00000000`0012f480 00000000`77c439fc TestDefaultDebugger64!AfxWndProc+0x4e
09 00000000`0012f4e0 00000000`77c432ba user32!UserCallWinProcCheckWow+0x1f9
0a 00000000`0012f5b0 00000000`77c4335b user32!SendMessageWorker+0x68c
0b 00000000`0012f650 000007ff`7f07c5af user32!SendMessageW+0x9d
0c 00000000`0012f6a0 000007ff`7f07eb8e comctl32!Button_ReleaseCapture+0x14f
0d 00000000`0012f6d0 00000000`77c439fc comctl32!Button_WndProc+0x8ee
0e 00000000`0012f830 00000000`77c43e9c user32!UserCallWinProcCheckWow+0x1f9
0f 00000000`0012f900 00000000`77c3965a user32!DispatchMessageWorker+0x3af
10 00000000`0012f970 00000000`0040706d user32!IsDialogMessageW+0x256
11 00000000`0012fa40 00000000`0040868c TestDefaultDebugger64!CWnd::IsDialogMessageW+0x35
12 00000000`0012fa80 00000000`0040309c TestDefaultDebugger64!CWnd::PreTranslateInput+0x28
13 00000000`0012fab0 00000000`0040ae73 TestDefaultDebugger64!CDialog::PreTranslateMessage+0xc0
14 00000000`0012faf0 00000000`004047fc TestDefaultDebugger64!CWnd::WalkPreTranslateTree+0x33
15 00000000`0012fb30 00000000`00404857 TestDefaultDebugger64!AfxInternalPreTranslateMessage+0x64233]
16 00000000`0012fb70 00000000`00404a17 TestDefaultDebugger64!AfxPreTranslateMessage+0x23
17 00000000`0012fba0 00000000`00404a57 TestDefaultDebugger64!AfxInternalPumpMessage+0x37
18 00000000`0012fbe0 00000000`0040a419 TestDefaultDebugger64!AfxPumpMessage+0x1b
19 00000000`0012fc10 00000000`00403a3a TestDefaultDebugger64!CWnd::RunModalLoop+0xe5
1a 00000000`0012fc90 00000000`00401139 TestDefaultDebugger64!CDialog::DoModal+0x1ce
1b 00000000`0012fd40 00000000`0042bbbd TestDefaultDebugger64!CTestDefaultDebuggerApp::InitInstance+0xe9
1c 00000000`0012fe70 00000000`00414848 TestDefaultDebugger64!AfxWinMain+0x69
1d 00000000`0012fed0 00000000`77d5966c TestDefaultDebugger64!__tmainCRTStartup+0x258
1e 00000000`0012ff80 00000000`00000000 kernel32!BaseProcessStart+0x29

The same technique can be used to dump a process when any kind of error message box appears, for example, when a .NET application displays a .NET exception message box or a native application shows a run-time error dialog box. 

- Dmitry Vostokov @ DumpAnalysis.org -

Repair Clipboard Chain 2.0.1

Thursday, June 21st, 2007

The new version has been published and available for download from Citrix support:

http://support.citrix.com/article/CTX106226

It allows to repair clipboard chain for individual ICA sessions:

C:\>RepairCBDChain.exe "Sent Items - Microsoft Outlook - \\Remote"
C:\>RepairCBDChain.exe "Weekly report - Message - \\Remote"

You might also repair individual RDP sessions if you specify the window class as the second parameter although I didn’t test this.

MessageHistory tool shows the following RDP client window on my x64 Windows 2003 Server responsible for receiving clipboard change notifications:

HWND: 0x00000000000318A8
Class: "RdpClipRdrWindowClass"
Title: ""
20:31:59:562 S WM_DRAWCLIPBOARD (0x308) wParam: 0x31986 lParam: 0x0

The command line should be:

C:\>RepairCBDChain.exe "" "RdpClipRdrWindowClass"

Inside RDP session on Windows XP the following rdpclip.exe window receives clipboard change notifications:

HWND: 0x0004003A
Class: "CBMonitorClass"
Title: "CB Monitor Window"
19:36:57:484 S WM_DRAWCLIPBOARD (0x308) wParam: 0x50142 lParam: 0x0

and the command line should be:

C:\>RepairCBDChain.exe "CB Monitor Window" "CBMonitorClass"

Please see Clipboard Issues Explained for a background explanation.

- Dmitry Vostokov @ DumpAnalysis.org -

Crash Dump Analysis Checklist

Wednesday, June 20th, 2007

Sometimes the root cause of a problem is not obvious from a memory dump. Here is the first version of crash dump analysis checklist to help experienced engineers not to miss any important information. The check list doesn’t prescribe any specific steps, just lists all possible points to double check when looking at a memory dump. Of course, it is not complete at the moment and any suggestions are welcome.

General:

  • Symbol servers (.symfix)
  • Internal database(s) search
  • Google or Microsoft search for suspected components as this could be a known issue. Sometimes a simple search immediately points to the fix on a vendor’s site
  • The tool used to save a dump (to flag false positive, incomplete or inconsistent dumps)
  • OS/SP version (version)
  • Language
  • Debug time
  • System uptime
  • Computer name (dS srv!srvcomputername or !envvar COMPUTERNAME)
  • List of loaded and unloaded modules (lmv or !dlls)
  • Hardware configuration (!sysinfo)
  • .kframes 1000

Application or service:

  • Default analysis (!analyze -v or !analyze -v -hang for hangs)
  • Critical sections (!cs -s -l -o, !locks) for both crashes and hangs
  • Component timestamps, duplication and paths. DLL Hell? (lmv and !dlls)
  • Do any newer components exist?
  • Process threads (~*kv or !uniqstack) for multiple exceptions and blocking functions
  • Process uptime
  • Your components on the full raw stack of the problem thread
  • Your components on the full raw stack of the main application thread
  • Process size
  • Number of threads
  • Gflags value (!gflag)
  • Time consumed by threads (!runaway)
  • Environment (!peb)
  • Import table (!dh)
  • Hooked functions (!chkimg)
  • Exception handlers (!exchain)
  • Computer name (!envvar COMPUTERNAME)
  • Process heap stats and validation (!heap -s, !heap -s -v)
  • CLR threads? (mscorwks or clr modules on stack traces) Yes: use .NET checklist below
  • Hidden (unhandled and handled) exceptions on thread raw stacks

System hang:

  • Default analysis (!analyze -v -hang)
  • ERESOURCE contention (!locks)
  • Processes and virtual memory including session space (!vm 4)
  • Important services are present and not hanging
  • Pools (!poolused)
  • Waiting threads (!stacks)
  • Critical system queues (!exqueue f)
  • I/O (!irpfind)
  • The list of all thread stack traces (!process 0 3f)
  • LPC/ALPC chain for suspected threads (!lpc message or !alpc /m after search for “Waiting for reply to LPC” or “Waiting for reply to ALPC” in !process 0 3f output)
  • RPC threads (search for “RPCRT4!OSF” in !process 0 3f output)
  • Mutants (search for “Mutants - owning thread” in !process 0 3f output)
  • Critical sections for suspected processes (!cs -l -o -s)
  • Sessions, session processes (!session, !sprocess)
  • Processes (size, handle table size) (!process 0 0)
  • Running threads (!running)
  • Ready threads (!ready)
  • DPC queues (!dpcs)
  • The list of APCs (!apc)
  • Internal queued spinlocks (!qlocks)
  • Computer name (dS srv!srvcomputername)
  • File cache, VACB (!filecache)
  • File objects for blocked thread IRPs (!irp -> !fileobj)
  • Network (!ndiskd.miniports and !ndiskd.pktpools)
  • Disk (!scsikd.classext -> !scsikd.classext class_device 2)
  • Modules rdbss, mrxdav, mup, mrxsmb in stack traces
  • Functions Ntfs!Ntfs*, nt!Fs* and fltmgr!Flt* in stack traces

BSOD:

  • Default analysis (!analyze -v)
  • Pool address (!pool)
  • Component timestamps (lmv)
  • Processes and virtual memory (!vm 4)
  • Current threads on other processors
  • Raw stack
  • Bugcheck description (including ln exception address for corrupt or truncated dumps)
  • Bugcheck callback data (!bugdump for systems prior to Windows XP SP1)
  • Bugcheck secondary callback data (.enumtag)
  • Computer name (dS srv!srvcomputername)
  • Hardware configuration (!sysinfo)

.NET application or service:

  • CLR module and SOS extension versions (lmv and .chain)
  • Managed exceptions (~*e !pe)
  • Nested managed exceptions (!pe -nested)
  • Managed threads (!Threads -special)
  • Managed stack traces (~*e !CLRStack)
  • Managed execution residue (~*e !DumpStackObjects and !DumpRuntimeTypes)
  • Managed heap (!VerifyHeap, !DumpHeap -stat and !eeheap -gc)
  • GC handles (!GCHandles, !GCHandleLeaks)
  • Finalizer queue (!FinalizeQueue)
  • Sync blocks (!syncblk)

- Dmitry Vostokov @ DumpAnalysis.org + TraceAnalysis.org -

Custom postmortem debuggers on Vista

Sunday, May 20th, 2007

Motivated by the previous post I decided to try better alternatives because on new Vista installation you don’t have either drwtsn32.exe or NTSD.

Any application that can attach to a process based on its PID and save its memory state in a dump will do. The first obvious candidate is userdump.exe which actually can setup itself in the registry properly. Here is the detailed instruction. If you already have the latest version of userdump.exe you can skip the first two steps:

1. Download the latest User Mode Process Dumper from Microsoft. At the time of this writing it has version 8.1

2. Run the downloaded executable file and it will prompt to unzip. By default the current version unzips to c:\kktools\userdump8.1. Do not run setup afterwards because it is not needed for our purposes.

3. Create kktools folder in system32 folder

4. Create the folder where userdump will save your dumps; I use c:\UserDumps in my example

5. Copy dbghelp.dll and userdump.exe from x86 or x64 folder depending on the version of Windows you use to system32\kktools folder you created in step 3.

6. Run the elevated command prompt and enter the following command:

C:\Windows\System32\kktools>userdump -I -d c:\UserDumps
User Mode Process Dumper (Version 8.1.2929.5)
Copyright (c) Microsoft Corp. All rights reserved.
Userdump set up Aedebug registry key.

7. Check the following registry key:

HKEY_LOCAL_MACHINE\SOFTWARE\Microsoft\Windows NT\CurrentVersion\AeDebug
Debugger=C:\Windows\system32\kktools\userdump -E %ld %ld -D c:\UserDumps\
Auto=0

You can set Auto to 1 if you want to see the following dialog every time you have a crash:

8. Test the new settings by using TestDefaultDebugger

9. When you have a crash userdump.exe will show a window on top of your screen while saving the dump file:

Of course, you can setup userdump.exe as the postmortem debugger on other Windows platforms. The problem with userdump.exe is that it overwrites the previous process dump because it uses the module name for the dump file name, for example, TestDefaultDebugger.dmp, so you need to rename or save the dump if you have multiple crashes for the same application.

Other programs can be setup instead of userdump.exe. One of them is WinDbg. Here is the article I wrote about WinDbg so I won’t repeat its content here, except the registry key I tested on Vista:

HKEY_LOCAL_MACHINE\SOFTWARE\Microsoft\Windows NT\CurrentVersion\AeDebug
Debugger="C:\Program Files\Debugging Tools for Windows\windbg.exe" -p %ld -e %ld -g -c '.dump /o /ma /u c:\UserDumps\new.dmp; q' -Q -QS -QY -QSY

Finally you can use command line CDB user mode debugger from Debugging Tools for Windows. Here is the registry key:

HKEY_LOCAL_MACHINE\SOFTWARE\Microsoft\Windows NT\CurrentVersion\AeDebug
Debugger="C:\Program Files\Debugging Tools for Windows\cdb.exe" -p %ld -e %ld -g -c ".dump /o /ma /u c:\UserDumps\new.dmp; q"

When you have a crash cdb.exe will be launched and the following console window will appear:

The advantage of using CDB or WinDbg is that you can omit q from the -c command line option and leave your debugger window open for further process inspection.

- Dmitry Vostokov -

Resurrecting Dr. Watson on Vista

Saturday, May 19th, 2007

Feeling nostalgic about pre-Vista times I recalled that one month before upgrading my Windows XP to Vista I saved the copy of Dr. Watson (drwtsn32.exe). Of course, during upgrade, drwtsn32.exe was removed from system32 folder. Now I copied it back and set it as the default postmortem debugger from the elevated command prompt:

When I looked at the registry I found the correctly set key values:

HKEY_LOCAL_MACHINE\SOFTWARE\Microsoft\Windows NT\CurrentVersion\AeDebug
Debugger=drwtsn32 -p %ld -e %ld -g
Auto=1

Auto=1 means do not show the error message box, just go ahead and dump the process. Actually with Auto=0 Dr. Watson doesn’t work on my Vista.

Also I configured Dr. Watson to store the log and full user dump in c:\DrWatson folder by running drwtsn32.exe from the same elevated command prompt:

Next I launched TestDefaultDebugger and hit the big crash button. Access violation happened and I saw familiar “Program Error” message box:

The log was created and the user dump was saved in the specified folder. All subsequent crashes were appended to the log and user.dmp was updated. When I opened the dump in WinDbg I got the following output:

Loading Dump File [C:DrWatsonuser.dmp]
User Mini Dump File with Full Memory: Only application data is available
Comment: ‘Dr. Watson generated MiniDump’
Symbol search path is: SRV*c:\websymbols*http://msdl.microsoft.com/download/symbols
Executable search path is:
Windows Vista Version 6000 UP Free x86 compatible
Product: WinNt, suite: SingleUserTS
Debug session time: Sat May 19 20:52:23.000 2007 (GMT+1)
System Uptime: 5 days 20:00:04.062
Process Uptime: 0 days 0:00:03.000
This dump file has an exception of interest stored in it.
The stored exception information can be accessed via .ecxr.
(1f70.1e0c): Access violation - code c0000005 (first/second chance not available)
eax=00000000 ebx=00000001 ecx=0012fe70 edx=00000000 esi=00425ae8 edi=0012fe70
eip=004014f0 esp=0012f8a8 ebp=0012f8b4 iopl=0 nv up ei ng nz ac pe cy
cs=001b ss=0023 ds=0023 es=0023 fs=003b gs=0000 efl=00010297
TestDefaultDebugger!CTestDefaultDebuggerDlg::OnBnClickedButton1:
004014f0 c7050000000000000000 mov dword ptr ds:[0],0 ds:0023:00000000=???????

Therefore I believe that if I saved ntsd.exe before upgrading to Vista I would have been able to set it as a default postmortem debugger too.

- Dmitry Vostokov -

Process crash - getting the dump manually

Wednesday, May 16th, 2007

Sometimes customers have process crashes with exception dialogs but no dumps are saved due to some reason, for example, Dr. Watson limitation, NTSD doesn’t save dumps on Windows 2000, etc. One solution is to dump the process manually while it displays an error message. Customers and support engineers can use Microsoft userdump.exe for this purpose. Then looking at the dump we would see the exception because it is processed by an exception handler that either shows the error dialog or creates Windows Error Reporting process. Non-interactive services usually call NtRaiseHardError to let csrss.exe display a message. The following stack trace is from IE dump saved when WER error dialog box was shown:

0:000> k
ChildEBP RetAddr
0012973c 7c59a072 NTDLL!ZwWaitForSingleObject+0xb
00129764 7c57b3e9 KERNEL32!WaitForSingleObjectEx+0x71
00129774 00401b2f KERNEL32!WaitForSingleObject+0xf
0012a238 7918cd0e IEXPLORE!DwExceptionFilter+0×284
0012a244 03a3f0c3 mscoree!__CxxUnhandledExceptionFilter+0×46
0012a250 7c59bf8d msvcr71!__CxxUnhandledExceptionFilter+0×46
0012a984 715206e0 KERNEL32!UnhandledExceptionFilter+0×140
0012ee74 71520957 BROWSEUI!BrowserProtectedThreadProc+0×64
0012fef0 71762a0a BROWSEUI!SHOpenFolderWindow+0×1ec
0012ff10 00401ecd SHDOCVW!IEWinMain+0×108
0012ff60 00401f7d IEXPLORE!WinMainT+0×2dc
0012ffc0 7c5989a5 IEXPLORE!ModuleEntry+0×97
0012fff0 00000000 KERNEL32!BaseProcessStart+0×3d

If we disassemble DwExceptionFilter we would see CreateProcess call:

0:000> ub IEXPLORE!DwExceptionFilter+0x284
IEXPLORE!DwExceptionFilter+0x263:
00401b0e call dword ptr [IEXPLORE!_imp__CreateProcessA (00401050)]
00401b14 test eax,eax
00401b16 je   IEXPLORE!DwExceptionFilter+0x2f6 (00401ba1)
00401b1c mov  dword ptr [ebp+7Ch],edi
00401b1f mov  edi,dword ptr [IEXPLORE!_imp__WaitForSingleObject (0040104c)]
00401b25 push 4E20h
00401b2a push dword ptr [ebp+68h]
00401b2d call edi

I already described WER processes in the previous post about post-mortem debugging so I won’t cover it here.

If we run !analyze -v command we are lucky because WinDbg will find the exception for us:

...
...
...
CONTEXT: 0012aa94 -- (.cxr 12aa94)
eax=00000000 ebx=00000000 ecx=00000000 edx=7283e058 esi=0271a60c edi=00000000
eip=35c5f973 esp=0012ad60 ebp=0012ad7c iopl=0 nv up ei pl zr na pe nc
cs=001b ss=0023 ds=0023 es=0023 fs=0038 gs=0000 efl=00010246
componentA!InternalFoo+0x21:
35c5f973 8b01 mov eax,dword ptr [ecx] ds:0023:00000000=????????
...
...
...
STACK_TEXT:
0012ad7c 35c6042f 0012ae10 00000000 35c53390 componentA!InternalFoo+0x21
0012c350 779d7d5d 00000000 001ad114 00000000 componentA!InternalBar+0x157
0012c36c 77a2310e 02b23d5c 00000020 00000004 oleaut32!DispCallFunc+0x15d
0012c3fc 35cc8b60 024d2d94 02b23d5c 00000001 oleaut32!CTypeInfo2::Invoke+0x244
...
...
...

If you see several threads with UnhandledExceptionFilter - Multiple Exceptions pattern - you can set the exception context individually based on the first parameter of UnhandledExceptionFilter which is a pointer to _EXCEPTION_POINTERS structure and then use .cxr command:

0:000> ~*kv
...
...
...
. 0 Id: 1568.68c Suspend: 1 Teb: 7ffde000 Unfrozen
ChildEBP RetAddr Args to Child
...
...
...
0012a984 715206e0 0012a9ac 7800bdb5 0012a9b4 KERNEL32!UnhandledExceptionFilter+0×140 (FPO: [Non-Fpo])


0:000> dt _EXCEPTION_POINTERS 0012a9ac
+0×000 ep_xrecord : 0×12aa78
+0×004 ep_context : 0×12aa94
0:000> .cxr 0012aa94
eax=00000000 ebx=00000000 ecx=00000000 edx=7283e058 esi=0271a60c edi=00000000
eip=35c5f973 esp=0012ad60 ebp=0012ad7c iopl=0 nv up ei pl zr na pe nc
cs=001b ss=0023 ds=0023 es=0023 fs=0038 gs=0000 efl=00010246
componentA!InternalFoo+0×21:
35c5f973 8b01 mov eax,dword ptr [ecx] ds:0023:00000000=????????

Another stack fragment comes from some Windows service and it shows the thread calling NtRaiseHardError:

0:000> ~*k
...
...
...
13 Id: 3624.16cc Suspend: 1 Teb: 7ffad000 Unfrozen
ChildEBP RetAddr
0148ed40 7c821b74 ntdll!KiFastSystemCallRet
0148ed44 77e99af9 ntdll!NtRaiseHardError+0xc
0148f3dc 77e84259 kernel32!UnhandledExceptionFilter+0×54b

0148f40c 7c82eeb2 kernel32!_except_handler3+0×61
0148f430 7c82ee84 ntdll!ExecuteHandler2+0×26
0148f4d8 7c82ecc6 ntdll!ExecuteHandler+0×24
0148f4d8 7c81e215 ntdll!KiUserExceptionDispatcher+0xe
0148f7e0 76133437 ntdll!RtlLengthSecurityDescriptor+0×2a
0148f80c 7613f33d serviceA!GetObjectSize+0×1c3
0148f8d0 77c70f3b serviceA!RpcGetObjectSize+0×1b
0148f8f8 77ce23f7 rpcrt4!Invoke+0×30
0148fcf8 77ce26ed rpcrt4!NdrStubCall2+0×299
0148fd14 77c709be rpcrt4!NdrServerCall2+0×19
0148fd48 77c7093f rpcrt4!DispatchToStubInCNoAvrf+0×38
0148fd9c 77c70865 rpcrt4!RPC_INTERFACE::DispatchToStubWorker+0×117
0148fdc0 77c734b1 rpcrt4!RPC_INTERFACE::DispatchToStub+0xa3


- Dmitry Vostokov -

Using SSSL principle to design support tools

Sunday, May 6th, 2007

Start, Stop and Send Log (SSSL) principle was applied to design of many tools created in Citrix for troubleshooting customer issues. My favorite examples are WindowHistory, MessageHistory, and ScreenHistory

In a typical scenario, a customer has a GUI issue, downloads a tool, runs it, clicks on a “Start” button, tries to reproduce the issue, clicks on a “Stop” button and then sends a log either saved in a file or copied from the tool’s dialog. Simple action, no need for customers to become familiar with colored and complex GUI tools especially when an issue is hot and there is no time to play. Upon the arrival of the log file a skilled engineer can analyze it and provide further recommendations. Of course, SSSL tools must record all information that would be necessary to look at during analysis.

SSSL principle promotes agile iterative and incremental development of tools. Because it is difficult to know in advance about all information necessary to record, the first version usually implements logging of essential data only and what is missing in other available tools. The GUI is very simple and this shortens the development time. Later, after support incidents and analysis of their logs, it becomes apparent that more information needs to be recorded and then the second version is born, etc.

SSSL principle also promotes design and implementation reuse. Because GUI and certain operations are the same you can reuse common source code.

Finally after some time when more and more SSSL tools appear you can refactor them into a unified SSSL framework where individual tools become pluggable  components. This is what is coming this summer: GUI History Monitor that will combine all separate SSSL “History” tools together.

- Dmitry Vostokov -

PDBFinder (public version 3.0.1)

Friday, May 4th, 2007

Finally I’ve managed to create a slimmer version 3.0.1 with many resource consumption improvements:

  • Built database occupies 3.7 times less disk space
  • 2 times faster load
  • 5 times less memory consumption

Additional improvements:

  • “FIXFinder” feature: shows folders where you can find newer modules
  • Search can be restricted to folder names containing sub-string (for example, “release” or “full” symbols only)
  • Ready to copy and paste folder names (for WinDbg Symbol File Path dialog) – exe/dll/sys subfolders are stripped off
  • Additional minor interface improvements (larger screen, ellipsis in paths during build, better keyboard focus handling)

Screenshot:

The tool has been tested with more than 1,000,000 PDB files.

PDBFinder Deluxe Pro 3.0.1 and its documentation can be downloaded from Citrix support web site (requires free registration).

The motivation behind the tool is explained in my previous post: Cons of Symbol Server.

- Dmitry Vostokov -

Cons of Symbol Server

Thursday, May 3rd, 2007

Symbol servers are great. However I found that in crash dump analysis the absence of automatically loaded symbols sometimes helps to identify a problem or at least gives some directions for further research. It also helps to see which hot fixes or service packs for your product were installed on a problem computer. The scenario I use sometimes when I analyze crash dumps from product A is the following:

  1. Set up WinDbg to point to Microsoft Symbol Server
  2. Load a crash dump and enter various commands based on the issue. Some OS or product A components become visible and their symbols are unresolved.
  3. From unresolved OS symbols I’m aware of the latest fixes or privates from MS
  4. From unresolved symbols of the product A and PDBFinder I determine the base product level and this already gives me some directions.
  5. I add the base product A symbols to symbol file path and continue my analysis.
  6. If unresolved symbols of the product A continue to come up I use PDBFinder again to find corresponding symbols and add them to symbol file path. By doing that I’m aware of the product A hot fix and/or service pack level.
  7. Also from the latest version of PDBFinder (3.0.1) I know whether there are any updates to the component in question.

Of course, all this works only if you store all PDB files from all your fixes and service packs in some location(s) with easily identified names, for example, PRODUCTA\VER20\SP31\FIX01. Adding symbols manually helps to be focused on components, gives attention to some threads where they appear. You might think it is a waste of time but it only takes very small percentage of time especially if you look at the dump for a couple of hours.

What is PDBFinder? This is a program I developed to be able to find right symbol files (especially for minidumps). It scans all locations for PDB or DBG files and adds them to a text database. Next time you run PDBFinder it loads that database and you can find PDB or DBG file location by specifying module name and its date. You can also do a fuzzy search by specifying some date interval. If you run it with -update command line option it will build the database automatically, useful for scheduling weekly updates.  

The public version of PDBFinder Deluxe 2.2.1 can be downloaded from Citrix support web site. The new version 3.0.1 on the way with major improvements and will be announced tomorrow.

- Dmitry Vostokov -

The new version of WinDbg has been released

Tuesday, May 1st, 2007

Version 6.7.5 of Debugging Tools for Windows was released last week:

I haven’t found so far significant additions for crash dump analysis. What I noticed today is that when I open a user dump and enter
!analyze -v command the new field appears in the output:

NTGLOBALFLAG:  400

I ran gflags.exe and enabled page heap for notepad.exe. Then I launched notepad.exe, attached WinDbg, entered the command and NTGLOBALFLAG field reflected the change:

NTGLOBALFLAG:  2000000

So I don’t need to type !gflag command anymore. 

- Dmitry Vostokov -

Crash Dump Analysis Poster v1.1 (HTML version)

Sunday, April 22nd, 2007

Here is an HTML version of Crash Dump Analysis Poster with hyperlinks. Command links launch WinDbg Help for corresponding topic. If you click on !heap, for example, WinDbg Help window for that command will open. In order to have this functionality you need to save source code of the following HTML file below to your disk and launch it locally.

http://www.dumpanalysis.org/CDAPoster.html

Your WinDbg Help file must be in the default installation path, i.e.

C:\Program Files\Debugging Tools for Windows\debugger.chm

If you installed WinDbg to a different folder then you can simply create the default folder and copy debugger.chm there.

I keep this HTML file open locally on a second monitor and found it very easy to jump to an appropriate command help when I need its parameter description.

This HTML poster was created and edited in Notepad.

I’m working on the second version and will announce it as soon as it is ready.

- Dmitry Vostokov -

Crash Dump Analysis Poster v1.0

Sunday, April 15th, 2007

In December when I announced Crash Dump Analysis Card I talked about my plans to make a poster. Here is what I came to in the first version: A4 format poster with the following goals in mind:

  • Have it easy to stick nearby or have it handy
  • Foldable into two halves (user / kernel dumps)
  • Possibility to make it a background image on a PC desktop
  • Have it displayed on a second monitor
  • To facilitate mastering commands and their options
  • Encourage to look in WinDbg Help

You can download large JPEG file (1701×1208) for free (PDF file will be available later):

Download Crash Dump Analysis Poster

In a couple of months I’m going to release the new version after using and playing with the current one and collecting feedback. I have some extension commands missing in the first version of this poster like !list command, various scripting and meta-commands and I will add them in the next version. The current choice of commands is based on my previous Crash Dump Analysis Card and my personal day-to-day crash dump analysis work.

Originally I wanted to call it like something like WinDbg Cheat Sheet or WinDbg Poster but then I realized that I had to omit various live debugging commands and options and there are already several similar cheat sheets for live debugging. 

- Dmitry Vostokov -

ScreenHistory 1.0

Sunday, April 8th, 2007

After working with many customer issues where I needed good screenshots I decided to write a screen or window capture tool to make troubleshooting and reading other logs/traces easier. Here is ScreenHistory tool with familiar History-like GUI interface if you have seen WindowHistory, MessageHistory and ProcessHistory tools.

The tool captures the whole screen (currently the primary monitor) after specified interval (default is 1 second) or the contents of a current foreground window (multi-monitor independent) and saves its screenshot in JPEG, GIF (default) or PNG file. Additionally an HTML file is generated with links to screenshots. New forthcoming versions of WindowHistory and MessageHistory will reference these screenshots. Windows Mobile version will be released soon too.

Instead of forming a mental picture about screen when you look at messages or relating them to arbitrary screenshots sent by your customers you can easily check real-time screenshots when you look at message traces, for example, MessageHistory trace:

13:12:24:944 S WM_ACTIVATEAPP (0x1c) wParam: 0x0 lParam: 0x12ec Deactivated / TID of activated window: 0x12ec

[Screen]
13:12:47:268 S WM_ACTIVATEAPP (0×1c) wParam: 0×1 lParam: 0×0 Activated / TID of deactivated window: 0×0

[Screen]

or WindowHistory trace

Handle: 000300E4 Class: "MyClass" Title: "My Application"
Captured at: 13:11:47:983
Process ID: 6c4
Thread ID: 1054
Parent: 0
Screen position (l,t,r,b): (264,161,1032,691)
Visible: true
Window placement command: SW_SHOWNORMAL
Foreground: false
Foreground changed at 13:12:20:626 to true
[Screen]
Foreground changed at 13:12:24:959 to false
[Screen]
Foreground changed at 13:12:47:284 to true
[Screen]
Foreground changed at 13:12:51:852 to false
[Screen]

The following ScreenHistory screenshot was saved by the tool itself:

If you save an HTML file and load it in IE you would see formatted screen log (screenshot was saved by ScreenHistory):

- Dmitry Vostokov @ DumpAnalysis.org -

Upgrading Dr. Watson

Saturday, April 7th, 2007

I’ve been using NTSD as a default debugger on my laptop for a while and decided to revert it to Dr. Watson to get a couple of logs. Unfortunately Dr. Watson itself crashed in dbghelp.dll. Loading drwtsn32.exe dump reveals that it depends on both dbghelp.dll and dbgeng.dll. I tried to replace these DLLs with newer versions from the latest Debugging Tools for Windows and found that this change in system32 folder is immediately reverted back to original file versions. Instead of battling against Windows I decided to create a completely separate Dr. Watson folder and copy drwtsn32.exe, the latest dbghelp.dll and dbgeng.dll from Debugging Tools for Windows there. Then I altered “Debugger” value under the following key to include the full path to drwtsn32.exe:

HKEY_LOCAL_MACHINE\SOFTWARE\Microsoft\Windows NT\CurrentVersion\AeDebug
Debugger=c:\drwatson\drwtsn32 -p %ld -e %ld -g
 

This solved the problem. Dr. Watson now uses the latest debugging engine to save dumps and logs.

- Dmitry Vostokov -

StressPrinters: Stressing Printer Autocreation

Tuesday, April 3rd, 2007

Printer drivers are great source of crash dumps especially in Citrix and Microsoft terminal services environments. Bad printer drivers crash or hang spooler service (spoolsv.exe) when multiple users connect to a server.

Most of bad drivers were designed and implemented for use in a single user environment without considering multithreading in mind. Some bad drivers display a dialog box every time the printer is created and because this is done on a server side users cannot dismiss it unless spooler service is configured to interact with the desktop and an administrator sees the dialog box. Some drivers are linked to a debug run-time library and every exception brings up a dialog effectively hanging the thread and sometimes the whole spooler service if there was heap corruption, for example.

Therefore before allowing terminal services users to use certain printers it is good to simulate multiple users trying to create particular printers to determine bad drivers and other printer components. Originally Citrix had very popular command line AddPrinter tool for this purpose and it has been replaced by StressPrinters tool where I designed and implemented GUI to set parameters, orchestration of multiple AddPrinter command line tools launched simultaneously with different parameters and overall log file management. You can even export your settings to a file and import it on another server. The tool also has 64-bit executables to test printer autocreation on x64 Windows.

Here are some screenshots:

The tool detects spooler crashes (if spoolsv.exe suddenly disappears from a process list) so you can check for crash dumps saved if you set up a default postmortem debugger (Dr. Watson or NTSD). If you see the progress bar hanging for a long time then you can dump the spooler service using MS userdump.exe to check for any stuck threads and resource contention.

You can register for free to read documentation and download this tool from Citrix support web site:

StressPrinters 1.2 for 32-bit and 64-bit platforms

- Dmitry Vostokov -

Internet Based Crash Dump Analysis Service

Friday, March 9th, 2007

I’m planning to launch a pilot version of free research online service IBCDAS (Internet Based Crash Dump Analysis Service) which is under development and will be integrated with Crash Dump Analysis Portal (www.dumpanalysis.org). The idea is to use Google API to search for crash signatures and stack traces on Internet and mine that information for a potential solution (a fix, a service pack, actual component vendor responsible for a bug, an article, etc.). Information from internet will be fed to a database in a structured form for further analysis and to help with similar or related problems.

- Dmitry Vostokov -

InstantDump (JIT Process Dumper)

Monday, February 19th, 2007

Techniques utilizing user mode process dumpers and debuggers like Microsoft userdump.exe, NTSD or WinDbg and CDB from Debugging Tools for Windows are too slow to pick up a process and dump it. You need either to attach a debugger manually, run the command line prompt or switch to Task Manager. This deficiency was the primary motivation for me to use JIT (just-in-time) technology for process dumpers. The new tool, InstantDump, will dump a process instantly and non-invasively in a moment when you need it. How does it work? You point to any window and press hot key.

InstantDump could be useful to study hang GUI processes or to get several dumps of the same process during some period of time (CPU spiking case or memory leak, for example) or just dump the process for the sake of dumping it (for curiosity). The tool uses the same tooltip technology introduced in WindowHistory 4.0 to dynamically display window information.

Short user guide:

1. The program will run only on XP/W2K3/Vista (in fact it will not load on W2K).

2. Run InstantDump.exe on 32-bit system or InstantDump64.exe on x64 Windows. If you attempt to run InstantDump.exe on x64 Windows it will show this message box and quit:


3. InstantDump puts itself into task bar icon notification area:

4. By default when you move the mouse pointer over windows the tooltip follows the cursor describing the process and thread id and process image path (you can disable tips in Options dialog box):

5. If you hold Ctrl-RightShift-Break for less than a second then the process (which window is under the cursor) will be dumped according to the settings for external process dumper in options dialog (accessible via task bar icon right mouse click):


The saved dump name will be (in our Calculator window case): calc.exe_9f8(2552)_22-17-56_18-Feb-2007.dmp

Looks like there is no NTSD in Vista so you have to use another user mode dumper, for example, install MS userdump.exe and specify the following command line in Options dialog:

userdump.exe %d %s

or resort to WinDbg or CDB command line.

The tool can be downloaded from here.

The new version of this tool is under development that will automatically pick up a process name from Task Manager, Process Explorer or Process Monitor (in fact, from any tool that displays the list of processes) and then instantly dump it.

- Dmitry Vostokov -

WindowHistory 4.0

Thursday, February 15th, 2007

I’ve added tool tips showing window information when pointing at any window. Here are some screenshots:

This works inside Citrix seamless ICA sessions too. Additionally the new version tracks client window rectangle and its changes (this was missing in the previous versions).

It works on Vista (doesn’t require elevation):

32-bit version can be downloaded from Citrix support web site.

64-bit version, which tracks changes for both 32-bit and 64-bit windows on x64 Windows platform, can also be downloaded from Citrix support web site.

- Dmitry Vostokov @ DumpAnalysis.org -