Archive for the ‘Tools’ Category
Wednesday, February 20th, 2008
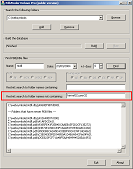
Finally the new update is available for download from Citrix support website.
What’s new in 3.6:
-
Fixed a bug related to secure string handling updates in MFC. PDBFinder now handles UNC pathnames exceeding 256 characters when building database.
-
Added additional filter to eliminate noise as shown on the following screenshot:
The motivation behind PDBFinder is covered in my old post:
Cons of Symbol Server
- Dmitry Vostokov @ DumpAnalysis.org -
Posted in Announcements, Crash Dump Analysis, Tools | 1 Comment »
Monday, February 18th, 2008
Comparing reference stack traces with the output of !process 0 ff command or just visually inspecting the long log and trying to spot anomalies is very difficult and largely based on personal experience with prior problem cases. A tool is needed and I’m currently writing the one. It will compare logs from problem memory dumps with reference stack traces and other information and automatically pinpoint any anomalies and highlight areas for more detailed manual inspection. This is similar to Kernel Memory Space Analyzer original intent but far more useful. Originally I thought about calling it WinDbg Log Analyzer but later decided to make it more general and extendable to other types of logs from different debuggers like GDB. Some people asked me the question: won’t a WinDbg debugger extension suffice? My answer was no - some companies cannot send complete, kernel and process memory dumps due to security considerations but they can send logs free from sensitive data as explained in my previous article:
Resolving security issues with crash dumps
Additionally I want it to be debugger independent at least in the second version and I want it to be web-based too and free from the choice of the hosting platform.
Stay tuned because the working prototype will be soon as a command line tool first. I personally need it for my day-to-day job. The latter always was my primary motivation to create various tools to automate or semi-automate data gathering and improve customer problem analysis.
The next version will have front-end GUI and I still haven’t decided yet whether to employ embedded HTML control like IE, RichEdit or revive my old text processor project. I’m inclined to choose the former due to endless possibilities with HTML and its platform independence. The choice of command line tool written in C++/STL will help to port it to FreeBSD/Linux/Solaris and adapt to other debuggers like GDB/ADB. The latter is my “wild fantasy” at the moment but its good to think towards other platforms that slowly increase their presence in my professional life 
Any suggestions are very welcome especially if you have dealt with large debugger logs including not only backtraces but also various synchronization objects, module information, timing and I/O packet distribution.
- Dmitry Vostokov @ DumpAnalysis.org -
Posted in Announcements, Crash Dump Analysis, Crash Dump Patterns, Debugging, Security, Software Technical Support, Stack Trace Collection, Tools | 2 Comments »
Monday, February 11th, 2008
Sometimes I need a quick link to install Debugging Tools for Windows and for other related information such as standard symbol server path, common commands, etc. For this purpose I’ve setup windbg.org domain and hope it will be handy. Currently its main page has the following links:
- Download links to 32-bit and 64-bit versions
- My favourite standard symbol path
- Link to HTML version of Crash Dump Analysis Poster
- Link to Crash Dump Analysis Checklist
Help menu on dumpanalysis.org used to point to CDA Poster now points to this page too.
I’ll add more useful information there soon. Any suggestions are welcome!
- Dmitry Vostokov @ DumpAnalysis.org -
Posted in Announcements, Crash Dump Analysis, Debugging, Tools | 2 Comments »
Thursday, February 7th, 2008
It is very easy to become a publisher nowadays. Much easier than I thought. I registered myself as a publisher under the name of OpenTask which is my registered business name in Ireland. I also got the list of ISBN numbers and therefore can announce product details for the first volume of Memory Dump Analysis Anthology series:
Memory Dump Analysis Anthology, Volume 1
- Paperback: 720 pages (*)
- ISBN-13: 978-0-9558328-0-2
- Hardcover: 720 pages (*)
- ISBN-13: 978-0-9558328-1-9
- Author: Dmitry Vostokov
- Publisher: Opentask (15 Apr 2008)
- Language: English
- Product Dimensions: 22.86 x 15.24
(*) subject to change
PDF file will be available for download too.
- Dmitry Vostokov @ DumpAnalysis.org -
Posted in Announcements, Assembly Language, Books, Bugchecks Depicted, Crash Dump Analysis, Crash Dump Patterns, Crash Dumps for Dummies, Debugging, Fun with Crash Dumps, GDB for WinDbg Users, Hardware, Kernel Development, Memory Dump Analysis Jobs, Memory Visualization, Minidump Analysis, Science of Memory Dump Analysis, Security, Software Architecture, Software Technical Support, Stack Trace Collection, Tools, Troubleshooting Methodology, Vista, WinDbg Scripts, WinDbg Tips and Tricks, WinDbg for GDB Users, Windows Server 2008 | 4 Comments »
Thursday, January 31st, 2008
SDT (Structured Debugging and Troubleshooting) is procedural (action-based). Once we get the description of the problem we jump to actions:
- Ask this
- Ask that
- Do this
- Do that
- …
Whereas OODT is centered around objects (systems and customers are also objects):
-
Get objects from the problem description and problem environment
-
Interrogate them sending messages (could be an email at high levels :-)) like changing a registry key is a message to configuration management subsystem
- …
OODT depends on troubleshooting domain and therefore finally we finally come to DDDT.
- Dmitry Vostokov @ DumpAnalysis.org -
Posted in Debugging, Software Technical Support, Tools, Troubleshooting Methodology | No Comments »
Thursday, January 31st, 2008
Component identification is one of the main goals of post-mortem memory dump analysis and troubleshooting process in general. Using the definition of components as units of deployment and 3rd-party composition taken from Clemens Szyperski’s seminal book discussing component software in general and COM, CORBA, Java and .NET in particular (highly recommended book)
Component Software: Beyond Object-Oriented Programming (2nd Edition)
I would say that CBDT is centered around component isolation and replacement.
- Dmitry Vostokov @ DumpAnalysis.org -
Posted in Books, Crash Dump Analysis, Debugging, Software Technical Support, Tools, Troubleshooting Methodology | No Comments »
Thursday, January 31st, 2008
OODT pronounced ”Oddity” is not a paradigm shift for support and software maintenance environments but a recognized way to solve problems using object-oriented techniques. In contrast to Structured Debugging and Troubleshooting methods (SDT) where engineers have sequence of questions and structure troubleshooting plans around them OODT is based on targeting specific objects, subsystems and systems (sending “messages” to them) and evaluating response and changes in their behaviour. I have to say more about it later after introducing CBDT (no easy pronunciation for it but any suggestions are welcome :-)).
Note: OODT doesn’t mean troubleshooting OO systems - it means applying OO techniques to troubleshooting
- Dmitry Vostokov @ DumpAnalysis.org -
Posted in Debugging, Software Technical Support, Tools, Troubleshooting Methodology | No Comments »
Sunday, January 20th, 2008
Finally I can pre-order this 1232 page 5th edition! Looking forward to seeing it in the post.
Windows® Internals: Including Windows Server 2008 and Windows Vista, Fifth Edition (PRO-Developer)

I read all previous editions as the part of my knowledge read ahead cache. Here is my short review of the previous 4th edition.
- Dmitry Vostokov @ DumpAnalysis.org -
Posted in Announcements, Books, Debugging, Software Architecture, Software Technical Support, Tools, Vista, Windows Server 2008 | 6 Comments »
Sunday, January 13th, 2008
This useful catalogue has links to many free tools that can be used to troubleshoot now ubiquitous Citrix environments. The last time I mentioned the catalogue was Oct 2006 and since then it was updated several times.
Troubleshooting Tools for Citrix Environments
The following document is also useful:
Citrix Brief Troubleshooting Guide
- Dmitry Vostokov @ DumpAnalysis.org -
Posted in Announcements, Citrix, Software Technical Support, Tools | No Comments »
Wednesday, December 12th, 2007
Some memory dumps are generated on purpose to troubleshoot process and system hangs. They are usually called Manual Dumps, manual crash dumps or manual memory dumps. Kernel, complete and kernel mini dumps can be generated using the famous keyboard method described in the following Microsoft article which has been recently updated and contains the fix for USB keyboards:
http://support.microsoft.com/kb/244139
The crash dump will show E2 bugcheck:
MANUALLY_INITIATED_CRASH (e2)

The user manually initiated this crash dump.

Arguments:

Arg1: 00000000

Arg2: 00000000

Arg3: 00000000

Arg4: 00000000
Various tools including Citrix SystemDump reuse E2 bug check code and its arguments. There are many other 3rd-party tools used to bugcheck Windows OS such as BANG! from OSR or NotMyFault from Sysinternals. The old one is crash.exe that loads crashdrv.sys and uses the following bugcheck:
Unknown bugcheck code (69696969)

Unknown bugcheck description

Arguments:

Arg1: 00000000

Arg2: 00000000

Arg3: 00000000

Arg4: 00000000
In a memory dump you would see its characteristic stack trace pointing to crashdrv module:
STACK_TEXT:

b5b3ebe0 f615888d nt!KeBugCheck+0xf

WARNING: Stack unwind information not available. Following frames may be wrong.

b5b3ebec f61584e3 crashdrv+0x88d

b5b3ec00 8041eec9 crashdrv+0x4e3

b5b3ec14 804b328a nt!IopfCallDriver+0x35

b5b3ec28 804b40de nt!IopSynchronousServiceTail+0x60

b5b3ed00 804abd0a nt!IopXxxControlFile+0x5d6

b5b3ed34 80468379 nt!NtDeviceIoControlFile+0x28

b5b3ed34 77f82ca0 nt!KiSystemService+0xc9

0006fed4 7c5794f4 ntdll!NtDeviceIoControlFile+0xb

0006ff38 01001a74 KERNEL32!DeviceIoControl+0xf8

0006ff70 01001981 crash+0x1a74

0006ff80 01001f93 crash+0x1981

0006ffc0 7c5989a5 crash+0x1f93

0006fff0 00000000 KERNEL32!BaseProcessStart+0x3d
Sometimes various hardware buttons are used to trigger NMI and generate a crash dump when keyboard is not available. The bugcheck will be:
NMI_HARDWARE_FAILURE (80)

This is typically due to a hardware malfunction. The hardware supplier should be called.

Arguments:

Arg1: 004f4454

Arg2: 00000000

Arg3: 00000000

Arg4: 00000000
Critical process termination such as session 0 csrss.exe is used to force a memory dump:
CRITICAL_OBJECT_TERMINATION (f4)

A process or thread crucial to system operation has unexpectedly exited or been terminated.

Several processes and threads are necessary for the operation of the system; when they are terminated (for any reason), the system can no longer function.

Arguments:

Arg1: 00000003, Process

Arg2: 8a090d88, Terminating object

Arg3: 8a090eec, Process image file name

Arg4: 80967b74, Explanatory message (ascii)
- Dmitry Vostokov @ DumpAnalysis.org -
Posted in Bugchecks Depicted, Citrix, Crash Dump Analysis, Crash Dump Patterns, Debugging, Minidump Analysis, Tools | 12 Comments »
Thursday, December 6th, 2007
Faced with the problem to find time to write troubleshooting tools that spring to my mind I devised this process that seems to be a novel way to write software for busy professionals. Its essence is in writing software when presenting it or when presenting software writing topics, for example, software architecture, design and implementation. It has some agile process flavour but magnified by a bigger audience than pair programming has and nicely complements my Reading Windows-based Code series. SIMSIM is an abbreviation for:
Show IMplementation and Subsequent IMprovement
More details will be announced soon.
- Dmitry Vostokov @ DumpAnalysis.org -
Posted in Announcements, Code Reading, Software Architecture, Tools | No Comments »
Tuesday, November 27th, 2007
I’ve been slowly accumulating blog posts about various troubleshooting tools for my next book in a row with a working title:
DebugWare: The Art and Craft of Writing Troubleshooting and Debugging Tools
Details will be announced later together with supporting website which is under construction. This book will be about architecture, design and implementation of troubleshooting tools for software technical support.
- Dmitry Vostokov @ DumpAnalysis.org -
Posted in Announcements, Books, Software Architecture, Software Technical Support, Tools | No Comments »
Friday, November 23rd, 2007
Thomas Koetzing wrote a useful article on how to use StressPrinters and put some examples:
Understanding and using Citrix StressPrinters
- Dmitry Vostokov @ DumpAnalysis.org -
Posted in Announcements, Citrix, Tools | 1 Comment »
Wednesday, November 21st, 2007
Some bugs are fixed using brute-force approach via putting an exception handler to catch access violations and other exceptions. Long time ago I saw one such “incredible fix” when the image processing application was crashing after approximately Nth heap free runtime call. To ignore crashes a SEH handler was put in place but the application started to crash in different places. Therefore the additional fix was to skip free calls when approaching N and resume afterwards. The application started to crash less frequently.
Here getting Early Crash Dump when a first-chance exception happens can help in component identification before corruption starts spreading across data. Recall that when an access violation happens in a process thread in user mode the system generates the first-chance exception which can be caught by an attached debugger and if there is no such debugger the system tries to find an exception handler and if that exception handler catches and dismisses the exception the thread resumes its normal execution path. If there are no such handlers found the system generates the so called second-chance exception with the same exception context to notify the attached debugger and if it is not attached a default thread exception handler usually saves a postmortem user dump.
You can get first-chance exception memory dumps with:
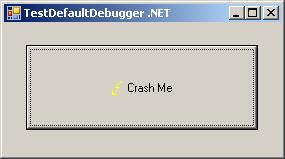
Here is an example configuration rule for crashes in Debug Diagnostic tool for TestDefaultDebugger process (Unconfigured First Chance Exceptions option is set to Full Userdump):
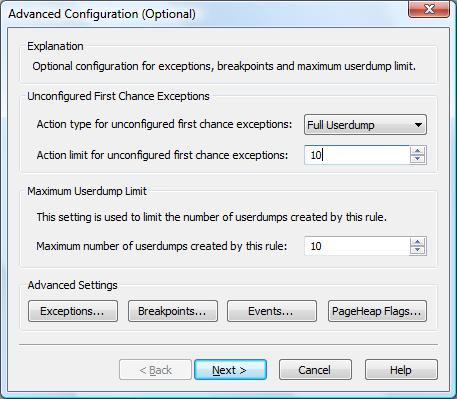
When we push the big crash button in TestDefaultDebugger dialog box two crash dumps are saved, with first and second-chance exceptions pointing to the same code:
Loading Dump File [C:\Program Files (x86)\DebugDiag\Logs\Crash rule for all instances of TestDefaultDebugger.exe\TestDefaultDebugger__PID__4316__ Date__11_21_2007__Time_04_28_27PM__2__First chance exception 0XC0000005.dmp]

User Mini Dump File with Full Memory: Only application data is available
Comment: 'Dump created by DbgHost. First chance exception 0XC0000005′

Symbol search path is: srv*c:\mss*http://msdl.microsoft.com/download/symbols

Executable search path is:

Windows Vista Version 6000 MP (2 procs) Free x86 compatible

Product: WinNt, suite: SingleUserTS

Debug session time: Wed Nov 21 16:28:27.000 2007 (GMT+0)

System Uptime: 0 days 23:45:34.711

Process Uptime: 0 days 0:01:09.000
This dump file has an exception of interest stored in it.

The stored exception information can be accessed via .ecxr.

(10dc.590): Access violation - code c0000005 (first/second chance not available)

eax=00000000 ebx=00000001 ecx=0017fe70 edx=00000000 esi=00425ae8 edi=0017fe70

eip=004014f0 esp=0017f898 ebp=0017f8a4 iopl=0 nv up ei ng nz ac pe cy

cs=0023 ss=002b ds=002b es=002b fs=0053 gs=002b efl=00010297

TestDefaultDebugger!CTestDefaultDebuggerDlg::OnBnClickedButton1:

004014f0 c7050000000000000000 mov dword ptr ds:[0],0  ds:002b:00000000=????????
Loading Dump File [C:\Program Files (x86)\DebugDiag\Logs\Crash rule for all instances of TestDefaultDebugger.exe\TestDefaultDebugger__PID__4316__ Date__11_21_2007__Time_04_28_34PM__693__ Second_Chance_Exception_C0000005.dmp]

User Mini Dump File with Full Memory: Only application data is available
Comment: 'Dump created by DbgHost. Second_Chance_Exception_C0000005‘

Symbol search path is: srv*c:\mss*http://msdl.microsoft.com/download/symbols

Executable search path is:

Windows Vista Version 6000 MP (2 procs) Free x86 compatible

Product: WinNt, suite: SingleUserTS

Debug session time: Wed Nov 21 16:28:34.000 2007 (GMT+0)

System Uptime: 0 days 23:45:39.313

Process Uptime: 0 days 0:01:16.000
This dump file has an exception of interest stored in it.

The stored exception information can be accessed via .ecxr.

(10dc.590): Access violation - code c0000005 (first/second chance not available)

eax=00000000 ebx=00000001 ecx=0017fe70 edx=00000000 esi=00425ae8 edi=0017fe70

eip=004014f0 esp=0017f898 ebp=0017f8a4 iopl=0 nv up ei ng nz ac pe cy

cs=0023 ss=002b ds=002b es=002b fs=0053 gs=002b efl=00010297

TestDefaultDebugger!CTestDefaultDebuggerDlg::OnBnClickedButton1:

004014f0 c7050000000000000000 mov dword ptr ds:[0],0  ds:002b:00000000=????????
- Dmitry Vostokov @ DumpAnalysis.org -
Posted in Crash Dump Analysis, Crash Dump Patterns, Debugging, Tools | 5 Comments »
Monday, November 19th, 2007
To troubleshoot and study memory leaks the following tool called NotMyLeak will be released soon. It injects different kinds of leaks into specified processes and system:
- Process heap
- Runtime library
- Performance counters
- Kernel paged pool
- Kernel nonpaged pool
- IRP
- Handles
- PTE
- etc…
The idea is to model various real-time leaks, analyze memory dumps and then apply discovered patterns to crash dump analysis of memory dumps coming from real-world systems.
The draft GUI (subject to change):
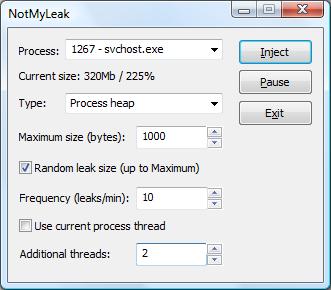
Note: the tool name prefix NotMy… was inspired by the name of Mark Russinovich’s tool called NotMyFault.
- Dmitry Vostokov @ DumpAnalysis.org -
Posted in Announcements, Crash Dump Analysis, Crash Dump Patterns, Debugging, Tools | No Comments »
Thursday, November 15th, 2007
I write most of my tools using C++, MFC and STL and I was really delighted to hear about new MFC framework improvements in forthcoming Visual Studio 2008. You can read the following press release from Russian ISV:
http://www.bcgsoft.com/pressreleases/PR071110.pdf
This is also discussed on MS Visual C++ team blog:
http://blogs.msdn.com/vcblog/archive/2007/11/09/quick-tour-of-new-mfc-functionality.aspx
I was also thinking about extending my MFC projects with .NET class library and found this interesting practical book:
Extending MFC Applications with the .NET Framework
- Dmitry Vostokov @ DumpAnalysis.org -
Posted in Announcements, Books, Tools | No Comments »
Thursday, November 8th, 2007
Sometimes there are situations when we need to test exception handling to see whether it works and how to get dumps or logs from it. For example, a customer reports infrequent process crashes but no dumps are saved. Then we can try some application that crashes immediately to see whether it results in error messages and/or saved crash dumps. This was the motivation behind TestDefaultDebugger package. Unfortunately it contains only native applications and today I needed to test .NET CLR exception handling and see what messages it shows in my environment. So I wrote a simple program in C# that creates an empty Stack object and then calls its Pop method which triggers “Stack empty” exception sufficient for my purposes.
The updated package now includes TestDefaultDebugger.NET.exe and can be downloaded from Citrix support web site (requires free registration):
Download TestDefaultDebugger package
- Dmitry Vostokov @ DumpAnalysis.org -
Posted in .NET Debugging, Announcements, Crash Dump Analysis, Debugging, Tools | No Comments »
Wednesday, November 7th, 2007
A bit late notice. I have just found that the new version of WinDbg was released last month:
http://www.microsoft.com/whdc/devtools/debugging/installx86.mspx
http://www.microsoft.com/whdc/devtools/debugging/install64bit.mspx
Seems not so many enhancements in this release according to the link below and relnotes.txt and at least it is not called Beta:
http://www.microsoft.com/whdc/devtools/debugging/whatsnew.mspx
- Dmitry Vostokov @ DumpAnalysis.org -
Posted in Announcements, Crash Dump Analysis, Debugging, Tools | 3 Comments »
Tuesday, November 6th, 2007
Although crash dumps are static in nature they contain Historical Information about past system dynamics that might give clues to a problem and help with troubleshooting and debugging.
For example, IRP flow between user processes and drivers is readily available in any kernel or complete memory dump. WinDbg !irpfind command will show the list of currently present I/O request packets. !irp command will give individual packet details.
Recent Driver Verifier improvements in Vista and Windows Server 2008 allow to embed stack traces associated with IRP allocation, completion and cancellation. For information please look at the following document:
http://www.microsoft.com/whdc/devtools/tools/vistaverifier.mspx
Other information that can be included in process, kernel and complete memory dumps may reveal some history of function calls beyond the current snapshot of thread stacks:
- Dmitry Vostokov @ DumpAnalysis.org -
Posted in Crash Dump Analysis, Crash Dump Patterns, Debugging, Tools, Vista | 11 Comments »
Wednesday, October 24th, 2007
If you have services running under network service account (prior to Vista) and they crash you can use NTSD from recent Debugging Tools for Windows and -noio switch as described in the following article:
http://www.debuginfo.com/articles/ntsdwatson.html
You need to copy the latest ntsd.exe, dbghelp.dll and dbgeng.dll to some folder on your system if you don’t want to install Debugging Tools for Windows in your production environment.
The AeDebug key I use for 64-bit JIT debugging is
C:\ntsd\ntsd -p %ld -e %ld -g -noio -c ".dump /ma /u c:\TEMP\new.dmp; q"
It is always good to double check settings with TestDefaultDebugger tool.
- Dmitry Vostokov @ DumpAnalysis.org -
Posted in Crash Dump Analysis, Debugging, Tools | No Comments »
