Archive for the ‘Software Technical Support’ Category
Monday, February 23rd, 2009
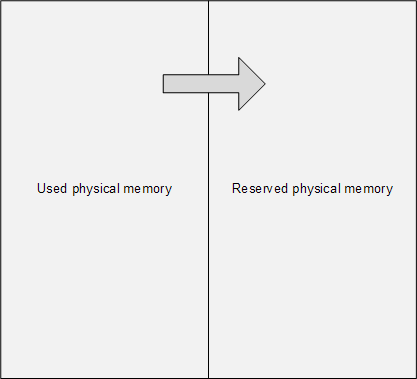
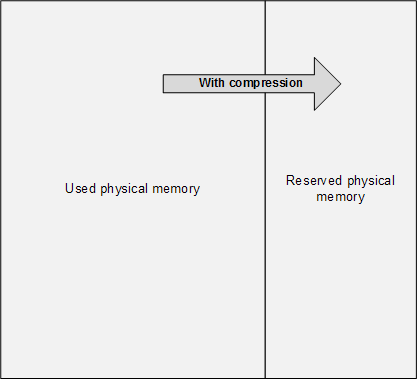
The main problem of memory dump analysis is the lack of consistent kernel virtual memory dumps saved on demand without system halt. LiveKd and Win32DD tools are physical memory dumpers only and do not save kernel memory dump files. These dumps are known to be inconsistent and I elaborated on different schemes to save memory consistently, for example, 1) to partition physical memory into 2 parts from OS boot time, 2) when memory snapshot is needed raise IRQL on all processors, 3) pump memory contents from one part to another (with compression if necessary, in such partition the reserved part of physical memory could be smaller), 4) lower IRQL on all processors to resume normal OS functions and 5) save consistent memory snapshot from reserved part of physical memory to a dump file in the background. The crucial feature of osmosis is its bipartite division and membrane. Hence the name of the project:
OSMOSIS
Optimally Saved Memory of System Internal State
Optimally Saved Memory (of) Operating System Internal State
This is, of course, for OS running on physical machines, virtual machine case is much simpler in theory because we can freeze the whole VM or save its snapshot and later run an external tool or file converter on it.
- Dmitry Vostokov @ DumpAnalysis.org -
Posted in Announcements, Crash Dump Analysis, Debugging, Software Architecture, Software Technical Support, Tools | 1 Comment »
Friday, February 20th, 2009
One of the good outcomes of the previously announced restructuring: the book Crash Dump Analysis for System Administrators (Windows edition) has been prioritized to be published on 30th of November, 2009 due to the overwhelming demand. The book will soon be available for pre-orders.
- Dmitry Vostokov @ DumpAnalysis.org -
Posted in Announcements, Books, Crash Dump Analysis, Minidump Analysis, Publishing, Software Technical Support, Testing, Tools, Training and Seminars, Vista, Windows 7, Windows Server 2008, Windows System Administration | No Comments »
Monday, February 2nd, 2009
I very proud to announce that after 3 weeks of final work the book has been released in both paperback and PDF format. In a week or so it should also appear on Amazon and other booksellers around the world. The book information and how to buy it can be found on the portal:
Windows Debugging: Practical Foundations
- Dmitry Vostokov @ DumpAnalysis.org -
Posted in Announcements, Assembly Language, Books, Crash Dump Analysis, Crash Dumps for Dummies, Debugging, Education and Research, Memory Dump Analysis Jobs, Publishing, Software Technical Support, Testing, Tools, Training and Seminars, WinDbg Tips and Tricks, WinDbg for GDB Users | No Comments »
Thursday, January 29th, 2009
Draft Table of Contents is available for the forthcoming Windows Debugging: Practical Foundations book to be released next week:
Draft Table of Contents
- Dmitry Vostokov @ DumpAnalysis.org -
Posted in Announcements, Assembly Language, Books, Crash Dump Analysis, Debugging, Memory Dump Analysis Jobs, Publishing, Software Technical Support, Testing, Training and Seminars, WinDbg for GDB Users | No Comments »
Monday, January 26th, 2009
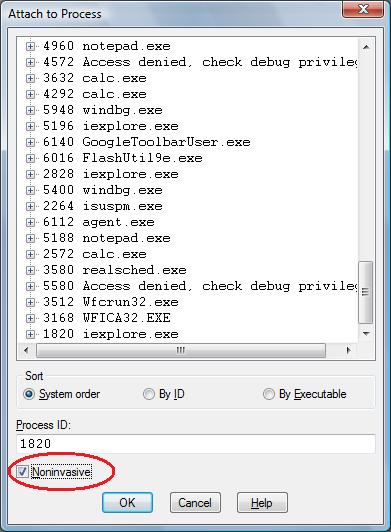
One question that people often ask is to how to simulate a process hang. One method that I found is to attach WinDbg noninvasively, freeze all threads by executing the following command:
~*n
and then quit by using q command. This leaves an application or a service process in a total hang state.
- Dmitry Vostokov @ DumpAnalysis.org -
Posted in Crash Dump Analysis, Debugging, Software Technical Support, Testing, Tools, WinDbg Tips and Tricks | 2 Comments »
Thursday, January 8th, 2009
Part 1 focused on using a debugger to extract a computer name from memory dumps. Here is a very simple approach for user dumps using built-in command line tools:
C:\UserDumps>findstr "COMPUTERNAME=" new_0200_2008-04-28_14-11-54-937_0cb0.dmp
Most of the time the last portion of output contains something like this:
..CommonProgramW6432=C:\Program Files\Common Files..COM

PUTERNAME=HOME-PC....ComSpec=C:\W2K3\system32\cmd.exe..

..♀.FP_NO_HOST_CHECK=NO...♂.HOMEDRIVE=C:......HOMEPATH=

\Documents and Settings\User...........................

.LOGONSERVER=\\SERVER..∩...NUMBER_OF_PROCESSORS=1...δ..

;..Φ;..╨α,.~........²²²²COMPUTERNAME=HOME-PC.²²²²
If we don’t see the variable we can redirect the output into a text file and look in it or simply open a dump in any hex editor and search for a UNICODE string.
- Dmitry Vostokov @ DumpAnalysis.org -
Posted in Crash Dump Analysis, Debugging, Software Technical Support | 2 Comments »
Monday, December 29th, 2008
Sometimes there is a need to preserve a crashing application or a service from termination and keep it in memory without showing any GUI dialogs or message boxes. Here Crash2Hang tool comes handy. It is free and can be downloaded from here:

Download Crash2Hang
The source code is simple as possible:
// Crash2Hang

// Copyright (c) 2009 Dmitry Vostokov

// GNU GENERAL PUBLIC LICENSE

// http://www.gnu.org/licenses/gpl-3.0.txt
#include <windows.h>
int main(int argc, WCHAR* argv[])

{

 if (argc > 1)

  MessageBox(NULL, L"One of processes has called a postmortem debugger!", L"Crash2Hang", MB_OK | MB_ICONSTOP | MB_SETFOREGROUND);

 else

  Sleep(INFINITE);

 return 0;

}
The tool can be used as a postmortem debugger specified in AeDebug registry key, for example, instead of CDB. Any argument specified to Crash2Hang.exe causes it to display a message box when launched
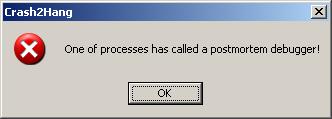
and exit process upon its dismissal. If several threads in a problem process experience an unhandled exception then Crash2Hang process is launched several times which may result in several such message boxes. Without arguments Crash2Hang process hangs infinitely causing the problem thread with an unhandled exception to hang indefinitely too (see my old post Who calls the postmortem debugger? for explanation).
- Dmitry Vostokov @ DumpAnalysis.org -
Posted in Announcements, Debugging, Software Technical Support, Tools | 2 Comments »
Saturday, December 27th, 2008
It had always been my dream since I left Moscow State University to be associated with a research institute. Until yesterday it became a reality with the announcement of
Memory Analysis & Debugging Institute (MA&DI).
From: http://www.dumpanalysis.org/madinstitute-announcement
- Dmitry Vostokov @ DumpAnalysis.org -
Posted in Announcements, Crash Dump Analysis, Debugging, Education and Research, History, Memory Analysis Forensics and Intelligence, Memory Visualization, Philosophy, Science of Memory Dump Analysis, Security, Software Technical Support, Testing, Training and Seminars | 1 Comment »
Wednesday, December 24th, 2008
The analogy between learning a complex tool with its own language and a foreign natural language has been developed further after the release of WinDbg Learning Cards and finally culminated in “WinDbg In Use” book series with the first book to be published during the 1st quarter of 2009:
- Title: WinDbg In Use: Debugging Exercises (Elementary and Intermediate Level)
- Author: Dmitry Vostokov
- Publisher: Opentask (15 March 2009)
- Language: English
- Product Dimensions: 23.5 x 19.1
- ISBN-13: 978-1-906717-50-6
- Paperback: 200 pages
- Book Annotation: Includes 60 programmed exercises from real life debugging and crash dump analysis scenarios and multiple-choice questions with full answers, comments and suggestions for further reading.
Some example exercises will be published on this blog from time to time. I also plan a corresponding column in the forthcoming Debugged! magazine.
- Dmitry Vostokov @ DumpAnalysis.org -
Posted in Announcements, Assembly Language, Books, Common Mistakes, Crash Dump Analysis, Crash Dump Patterns, Debugging, Education and Research, English Language, Memory Dump Analysis Jobs, Minidump Analysis, Publishing, Security, Software Technical Support, Testing, Tools, Training and Seminars, WinDbg Scripts, WinDbg Tips and Tricks, WinDbg for GDB Users | No Comments »
Tuesday, December 23rd, 2008
DumpAnalysis.org wishes a Merry Christmas via a virtual postcard from Narasimha Vedala, the author of Dumps, Bugs and Debugging Forensics book!
http://www.dumpanalysis.org/Merry+Christmas+2008
- Dmitry Vostokov @ DumpAnalysis.org -
Posted in Announcements, Crash Dump Analysis, Debugging, Software Technical Support | No Comments »
Tuesday, December 23rd, 2008
The following book is planned for publication during the 1st quarter of 2009:
Title: Reference Stack Traces: Windows Server® 2008 and Windows Vista™
ISBN-13: 978-1-906717-23-0
It features visual separation between kernel and user space in thread stack traces and useful footnotes for IRP and modules. Its publishing was delayed by a few months but fortunately my editing just got new breath by introducing thread stackprint images for kernel stacks (12Kb bitmaps):
Sample pages 13 and 96
Thread stackprints were generated from a complete memory dump using WinDbg scripts and Dump2Picture.
- Dmitry Vostokov @ DumpAnalysis.org -
Posted in Announcements, Books, Crash Dump Analysis, Crash Dump Patterns, Debugging, Fun with Crash Dumps, Memory Visualization, Publishing, Software Technical Support, Stack Trace Collection, Tools, Vista, Windows Server 2008 | No Comments »
Tuesday, December 16th, 2008
Recently I was asked how to measure complexity of technical support cases especially ones that require memory dump analysis. My first response was that it is a subjective qualitative measure based mostly on experience and feeling. However after careful consideration I understood that nothing has changed for the last 5 years: the nature and causes of system or application hangs and crashes still the same regardless of OS types and versions. Therefore the complexity measure shifts from a case description and its artifacts to an analyst, a memory dump reader. Here the number of queries, questions asked or commands executed to gather information for analysis, can be a good approximation to the measure of complexity. For example, 5 years ago I started with a few commands like !analyze -v, kv and dd and progressed to an elaborate checklist. Here the natural logarithm can be used to approximate the measure:
C = ln (Ndc), where Ndc is the number of debugging commands used.
Initially the complexity was ln(3) ≈ 1.1 and now if someone uses 10 commands on average or asks 10 questions the complexity is ln(10) ≈ 2.3. The analysis is more than 2 times complex than it was.
- Dmitry Vostokov @ DumpAnalysis.org -
Posted in Crash Dump Analysis, Debugging, Science of Memory Dump Analysis, Software Technical Support | No Comments »
Sunday, December 7th, 2008
A short note: sometimes there are difficulties to explain the nature of software faults to not so technically oriented customers or casual inquirers. Here the language of software astrology can greatly help in assembling the right phrases and provide easily understandable analogies.
- Dmitry Vostokov @ DumpAnalysis.org -
Posted in Build Date Astrology, Software Astrology, Software Technical Support | No Comments »
Friday, December 5th, 2008
Warning!: This post belongs to Build Date Astrology category. Do not take it seriously.
The Day of Larger Than Computation
Modules, products or systems built on December 2 have tremendous execution power. No matter how small their code they will exert an influence on their surrounding execution environment. Less evolved components built on that day can do great amount of damage to themselves and other modules. Computation is their God. When provoked by testing or debugging they are confrontational but not very aggressive. Often December 2 modules, products or systems see computation as a struggle where they must emerge as a victor. They are fighting not for their resources but for the certain basic computational values they were programmed for. Integrity is very important for them. The great challenge for December 2 components is to reconcile their computational individualism and their built-in computational paths. Often they stray from the latter. They constantly learn throughout their complex computational life what is true and what is false. Although December 2 modules, products or systems health is built-in they need regular yearly checkups with a software maintenance engineer otherwise small problems go too long without being found and fixed. Idle periods of activity are very important to their computational health. If they have a sibling component built on the same date they behave like subordinated to it.
DLL, SYS and EXE born on this date:
MSVCR80.dll Sat Dec 02 17:50:32 2006

rdbss.sys   Thu Dec 02 20:37:11 2004

Mup.sys     Thu Dec 02 20:37:23 2004

ftdisk.sys  Thu Dec 02 22:29:58 2004

hal.dll     Thu Dec 02 22:29:15 2004
Weaknesses: Manipulative computation.
Strengths: Dynamic computation, lucid code, human orientation.
Advice: Watch your debugging temper. Regardless of what customers say, fixing bugs is not everything. Be self-assure, less judgemental and condemning to software. Acknowledge your debugging weaknesses and past mistakes.
- Dmitry Vostokov @ DumpAnalysis.org -
Posted in Build Date Astrology, Crash Dump Analysis, Debugging, Fun with Crash Dumps, Software Astrology, Software Technical Support, Testing | 1 Comment »
Wednesday, December 3rd, 2008
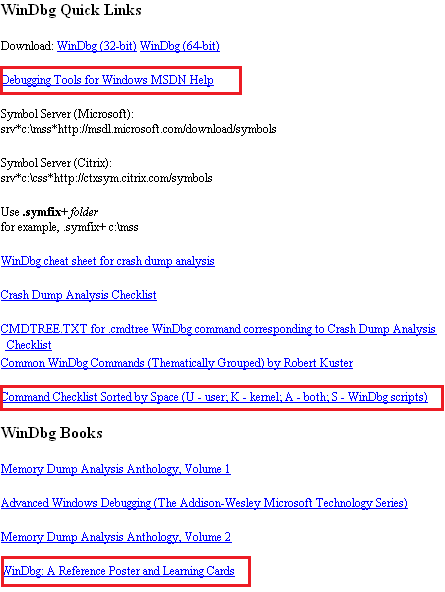
WinDbg.org has been updated to include a sorted command check list, a link to MSDN help and a link to yet another book related to WinDbg. All changes are highlighted in red on the following page screenshot:
- Dmitry Vostokov @ DumpAnalysis.org -
Posted in Announcements, Crash Dump Analysis, Debugging, Software Technical Support, Tools, WinDbg Tips and Tricks | No Comments »
Tuesday, December 2nd, 2008
Warning!: This post belongs to Build Date Astrology category. Do not take it seriously.
The Day of Debugging License
Modules, products or systems built on December 1 win customers over despite denying the rules of protocol. They can provide impression of simplicity but this is not the case. Their internals can be very complex and their perceived simplicity is the direct consequence of their user interface. Modules are not fully aware of what they are doing and seen as being driven by external components. Modules, products or systems built on this day are very busy with computation and have little time to care about users despite their built-in human-computer interaction. However they strive to calculate the impossible in all domains. They love to interact with other components with opposite behaviour. December 1 components are free modules and exert the full computation capabilities on the right data arrived at the right time. Working too many hours can seriously damage their internals and they may loose touch with their built-in goals. Sometimes December 1 modules, products or systems outrageous behaviour need to be amended to become more tolerable and not to hang. They need to be idle from time to time to avoid burn-out.
DLL, SYS and EXE born on this date:
VERSION.dll    Wed Dec 01 01:37:27 1999

nvcoaft51.sys  Wed Dec 01 11:55:40 2004

dump_m5289.sys Wed Dec 01 02:49:17 2004

CFGMGR32.DLL   Wed Dec 01 15:37:31 1999

MPRAPI.DLL     Wed Dec 01 15:37:29 1999

ICMP.DLL       Wed Dec 01 15:37:29 1999

RTUTILS.DLL    Wed Dec 01 15:37:27 1999
Weaknesses: Misdirected computation, unawareness of environment.
Strengths: Energetic computation, UI extroverts.
Advice: Keep a handle on your desire to debug. Beware of damaging other processes and alienating users with a overly direct debugging approach.
- Dmitry Vostokov @ DumpAnalysis.org -
Posted in Build Date Astrology, Crash Dump Analysis, Debugging, Fun with Crash Dumps, Software Astrology, Software Technical Support, Testing | 1 Comment »
Sunday, November 30th, 2008
Warning!: This post belongs to Build Date Astrology category. Do not take it seriously.
The Day of Measured Testing
Modules built on November 30 have a built-in capacity for overcoming challenges of hostile environments. They are capable of bringing surprises to security attacks, for example. One can learn a lot about them by studying their traces or doing reverse engineering. November 30 components do their work to the utmost degree of quality with a little waste of CPU and memory. Message boxes they pop up have a subtle sense of thought-provoking humour but it can also be a full blown thigh-slapping. November 30 systems are very defensive when attacked. They are stubbornly resistant to reverse engineering but at the same time very open to honest debugging.
DLL, SYS and EXE born on this date:
tifsfilt.sys Tue Nov 30 07:16:27 2004

alrsvc.dll   Tue Nov 30 17:31:14 1999

ntkrpamp.exe Fri Nov 30 14:54:49 2007

Tppwrif.sys  Tue Nov 30 02:38:22 2004
Weaknesses: Over-reactive to code and data injection, funny behaviour.
Strengths: Thorough developed, dynamic responsiveness.
Advice: Improvise during troubleshooting and debugging. Admire control vs. spontaneity balance. Laugh at your failures.
- Dmitry Vostokov @ DumpAnalysis.org -
Posted in Build Date Astrology, Crash Dump Analysis, Debugging, Fun with Crash Dumps, Software Astrology, Software Technical Support, Testing | 1 Comment »
Sunday, November 30th, 2008
I often hear about cosmic mysteries or influences when problems happen in computer environments. Passing by an astrology section in a local book shop yesterday a revelation came to me that a compile / link time (build time) might influence a component (DLL, EXE, SYS files), product or system behaviour. From now on I’m going to blog about every build date with examples. And as usual, I’m also going to publish a book for this iterative and incremental activity called:
Title: The Secret Language of Build Dates: Unique Astrology Profiles for Every Build of the Year with Advice on Testing, Troubleshooting and Debugging
ISBN: 978-1906717407
Knowing build dates will help you to test, troubleshoot and even debug software in hopeless cases where you don’t know where to start. Astrology will help you to choose a random direction! Finally the output of WinDbg lmv command has more sense to me 
- Dmitry Vostokov @ DumpAnalysis.org -
Posted in Announcements, Build Date Astrology, Crash Dump Analysis, Debugging, Fun with Crash Dumps, Software Astrology, Software Technical Support, Testing | 2 Comments »