Archive for the ‘Software Technical Support’ Category
Friday, November 28th, 2008
Following the release of WinDbg: A Reference Poster and Learning Cards the following book is planned for Windows (GDB), Linux and FreeBSD users:
- Title: GDB and KDB Debuggers:
A Reference Poster and Learning Cards
- Author: Gonçalo Gomes
- Publisher: Opentask (1 April 2009)
- Language: English
- Product Dimensions: 28.0 x 21.6
- ISBN-13: 978-1-906717-39-1
- Paperback: 16 pages
- Dmitry Vostokov @ DumpAnalysis.org -
Posted in Announcements, Books, Crash Dump Analysis, Debugging, GDB for WinDbg Users, Memory Analysis Forensics and Intelligence, Publishing, Security, Software Technical Support, Tools | No Comments »
Friday, November 28th, 2008
Due to some technical difficulties the release of WinDbg: A Reference Poster and Learning Cards has been delayed by 2 weeks. Now I got a proof copy and approved the book distribution on Amazon, B&N and other bookshops worldwide. Hope you will enjoy it and find it useful.
The similar book for GDB will be announced soon.
- Dmitry Vostokov @ DumpAnalysis.org -
Posted in Announcements, Books, Crash Dump Analysis, Crash Dump Patterns, Debugging, Publishing, Software Technical Support, Tools, WinDbg Tips and Tricks, WinDbg for GDB Users | No Comments »
Thursday, November 27th, 2008
I’ve been thinking through the so called First Faults after Dan Skwire, a veteran in mission-critical computer system problem resolution, problem prevention, and system recovery, organized a group on LinkedIn for first fault problem solving activity. He also has a website:
http://www.firstfaultproblemresolution.com/
From my software technical support experience first fault problem resolution is very important on Windows platforms, especially in enterprise terminal service and virtualized environments where hundreds of users can be hosted on just one server. Therefore, proper tools, processes and checklists need to be set up and established for effective and efficient troubleshooting and problem resolution from both engineering and customer relationship managing perspectives. Here crash and hang dump analysis helps immensely, especially memory analysis patterns and fault databases. More on this later with specific examples. I’m also working currently on incorporating first fault problem resolution into VERSION troubleshooting steps and PARTS troubleshooting methodology.
- Dmitry Vostokov @ DumpAnalysis.org -
Posted in Crash Dump Analysis, First Fault Problem Solving, Software Technical Support, Testing, Tools, Troubleshooting Methodology | No Comments »
Tuesday, November 25th, 2008
As one of the new initiatives for the Year of Debugging DumpAnalysis Portal will publish bimonthly full color 16 page publication called:
Debugged! MZ/PE: MagaZine for/from Practicing Engineers
The only serial publication dedicated entirely to Windows® debugging
The first issue is planned for March, 2009 and will have ISBN-13: 978-1-906717-38-4. If it goes well I’m planning to have ISSN number assigned to it too. More details will be announced soon.
- Dmitry Vostokov @ DumpAnalysis.org -
Posted in Announcements, Assembly Language, Books, Bugchecks Depicted, CDA Pattern Classification, Citrix, Common Mistakes, Crash Dump Analysis, Crash Dump Patterns, Crash Dumps for Dummies, Data Recovery, Debugged! MZ/PE, Debugging, IDA for WinDbg Users, Kernel Development, Memory Analysis Forensics and Intelligence, Memory Visualization, Minidump Analysis, Philosophy, Publishing, Security, Software Technical Support, Testing, Tools, Training and Seminars, Troubleshooting Methodology, Vista, WinDbg Scripts, WinDbg Tips and Tricks, WinDbg for GDB Users, Windows Server 2008 | 4 Comments »
Tuesday, November 25th, 2008
I’m pleased to announce that OpenTask has submitted the book Dumps, Bugs and Debugging Forensics: The Adventures of Dr. Debugalov for printing and here is the link to TOC:
Table of Contents
- Dmitry Vostokov @ DumpAnalysis.org -
Posted in Announcements, Books, Bugtations, Cartoons, Certification, Code Reading, Crash Dump Analysis, Crash Dumps for Dummies, Debugging, Fun with Crash Dumps, Memory Analysis Forensics and Intelligence, New Words, Philosophy, Publishing, Science of Memory Dump Analysis, Software Technical Support, Testing, WinDbg Tips and Tricks | No Comments »
Monday, November 24th, 2008
Thanks to shellexecute I got the news of this release. Remember, you can always access quick download links from www.windbg.org.
Dmitry Vostokov @ DumpAnalysis.org -
Posted in Announcements, Crash Dump Analysis, Debugging, Software Technical Support, Tools, WinDbg Tips and Tricks | 4 Comments »
Tuesday, November 11th, 2008
“Impatient” engineers “always” debug “too late.”
Jean Gwenaël Dutourd, Le Fond et la Forme, essai alphabétique sur la morale et sur le style
- Dmitry Vostokov @ DumpAnalysis.org -
Posted in Bugtations, Debugging, Software Technical Support, Testing | No Comments »
Monday, November 10th, 2008
While working on WinDbg command cards and even before that when compiling a comparison table for both WinDbg and GDB I came to an idea of abstract debugging commands that correspond to common debugging tasks, have clear syntax and semantics and serve metaphorically as a basis for conversion of analog thinking to digital debugger assistance (see analog-to-digital conversion for ADC abbreviation). Here a WinDbg extension can help but now I think about using a tree-based approach similar to CMDTREE.TXT for CDA Checklist. More on this later. Any comments or suggestions are greatly appreciated.
- Dmitry Vostokov @ DumpAnalysis.org -
Posted in Announcements, Crash Dump Analysis, Debugging, Software Architecture, Software Technical Support, WinDbg Tips and Tricks | 2 Comments »
Monday, November 10th, 2008
Suddenly the course of my publishing activities bended a little to produce a DIY poster and learning cards to be published soon. Here are the product details:
Annotation:
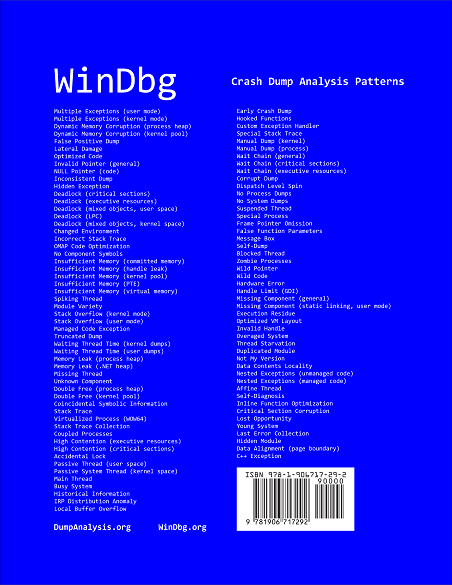
WinDbg is a powerful debugger from Microsoft Debugging Tools for Windows. It has more than 350 commands that can be used in different debugging scenarios. The cover of this book is a poster featuring crash dump analysis checklist and common patterns seen in memory dumps and live debugging sessions. Inside the book you can find ready to cut learning cards with commands and their descriptions coloured according to their use for crash dump or live debugging sessions and user, kernel or complete memory dumps. Tossing cards can create unexpected connections between commands and help to learn them more quickly. Uncut pages can also serve as birds eye view to WinDbg debugging capabilities. More than 350 WinDbg commands including meta-commands and extensions are included.
- Title: WinDbg: A Reference Poster and Learning Cards
- Authors: Dmitry Vostokov
- Publisher: Opentask (20 November 2008)
- Language: English
- Product Dimensions: 28.0 x 21.6
- ISBN-13: 978-1-906717-29-2
- Paperback: 20 pages
Book Excerpt
Front cover:
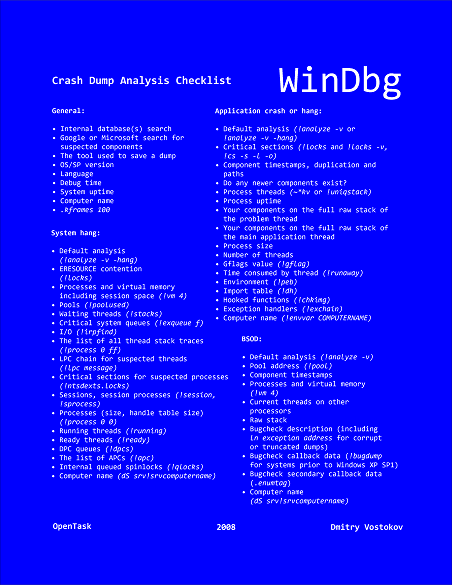
Back cover:
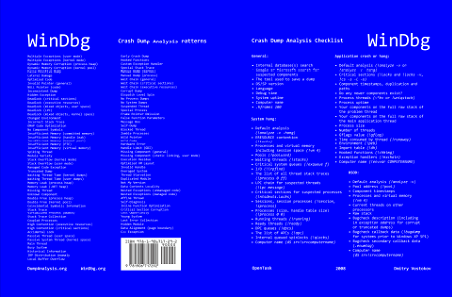
After you take inside pages out you are left with a cover that you can use as a crash dump analysis checklist and patterns poster:
I also plan to update this book on a yearly basis.
- Dmitry Vostokov @ DumpAnalysis.org -
Posted in Announcements, Books, Crash Dump Analysis, Crash Dump Patterns, Debugging, Publishing, Software Technical Support, Tools, Training and Seminars, WinDbg Scripts, WinDbg Tips and Tricks, WinDbg for GDB Users | 3 Comments »
Friday, November 7th, 2008
CtxHideEx32 tool has been updated to the version 1.1 and can be downloaded from Citrix support. It now allows a substring search for a window title or class, for example:
CtxHideEx32.exe HIDE "*error" "" OK
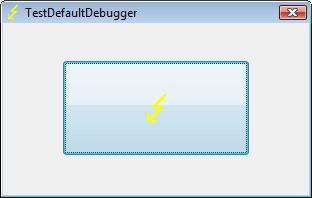
As by-product coupled with an optional command line I discovered that it allows to automatically dump any process displaying a message box with an error message in its window title. Here is an example using TestDefaultDebugger64 to simulate an application fault message where the following instance of CtxHideEx32 was setup to dump a process showing WER dialog on Vista:
CtxHideEx32.exe NONE "*Microsoft Windows" "" "C:\kktools\userdump8.1\x64\userdump.exe %d"
We click on a big lightning button:
and then WER dialog appears:
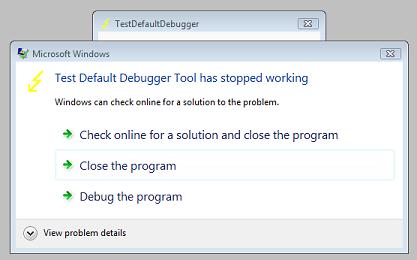
Immediately CtxHideEx32 kicks in and starts dumping the owner process incessantly so you better to dismiss this dialog by choosing something:
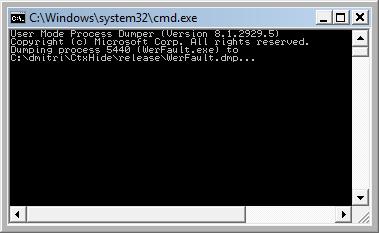
We see it was WerFault.exe.
Note: I think I have to amend CtxHideEx32 to make it wait until the spawned command line interpreter finishes its job. Stay tuned.
- Dmitry Vostokov @ DumpAnalysis.org -
Posted in Announcements, Citrix, Crash Dump Analysis, Debugging, Fun with Crash Dumps, Software Technical Support, Vista, Windows Server 2008 | 1 Comment »
Thursday, November 6th, 2008
This “Hamlet’s Question” of software technical support is often asked and unfortunately sometimes not even asked at all when troubleshooting and debugging complex enterprise environments. For applications the question of saving crash dumps is trivial. If a process is not in memory and not visible in Task Manager we won’t be able to dump it manually. With OS always running even when hanging the question often degenerates to “Let’s bugcheck and send the crash dump to dump file divers”. After that decision huge amounts of energy are spent in collecting, sending and storing gigabytes of data with always very little or no return. Therefore here is the preliminary list of symptoms where manual system dumps are appropriate and when they are not:
When a manual system dump is appropriate
-
- The system hangs visually (no GUI activity possible)
-
- No connections or logins are possible
-
- Abnormal system metrics (like pool, thread or process number growth)
-
- Insufficient system or session memory
When a manual process user dump is more appropriate than a complete memory dump
-
- Process hangs visually (other applications work as normal)
-
- Error message box appears
-
- Abnormal process metrics (like process memory growth or handle leaks)
When manual kernel and complete memory dumps are almost useless (I say almost because in rare circumstances they can aid in problem resolution so it is better not to collect them until explicitly asked from skilled memory dump file diver)
Note: 3rd-party kernel mode software developers should not face this question during the development of their drivers and delegate the responsibility for difficult bugcheck or panic decisions to an operating system. Surely Windows core developers face this question too.
Next we discuss another related question about choosing between kernel and complete memory dump options in Control Panel.
- Dmitry Vostokov @ DumpAnalysis.org -
Posted in Crash Dump Analysis, Crash Dumps for Dummies, Software Technical Support, Troubleshooting Methodology | No Comments »
Wednesday, November 5th, 2008
Matthieu Suiche has released the new version of win32dd tool with the ability to save physical memory in a WinDbg-compliant memory dump file including pages that normally are not saved in a complete memory dump.
- Dmitry Vostokov @ DumpAnalysis.org -
Posted in Announcements, Crash Dump Analysis, Data Recovery, Debugging, Memory Analysis Forensics and Intelligence, Security, Software Technical Support, Tools, Vista, Windows Server 2008 | No Comments »
Friday, October 31st, 2008
“One of the pleasures of reading old” memory dumps “is the knowledge that they need no answer.”
George Gordon Byron
- Dmitry Vostokov @ DumpAnalysis.org -
Posted in Bugtations, Crash Dump Analysis, Software Technical Support | No Comments »
Friday, October 31st, 2008
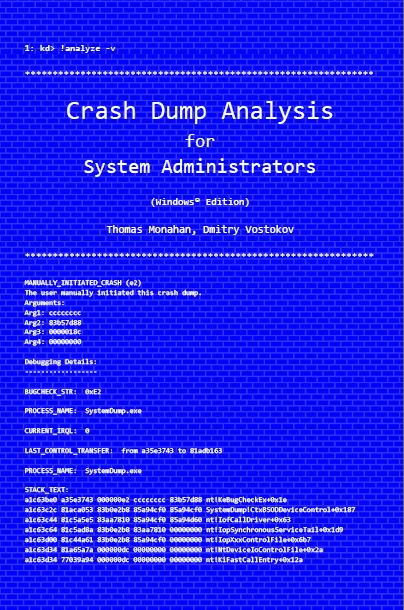
Previously announced book Crash Dump Analysis for System Administrators and Support Engineers (Windows Edition) has got its draft cover featuring WinDbg output from a kernel memory dump forced by Citrix SystemDump tool.
Front:
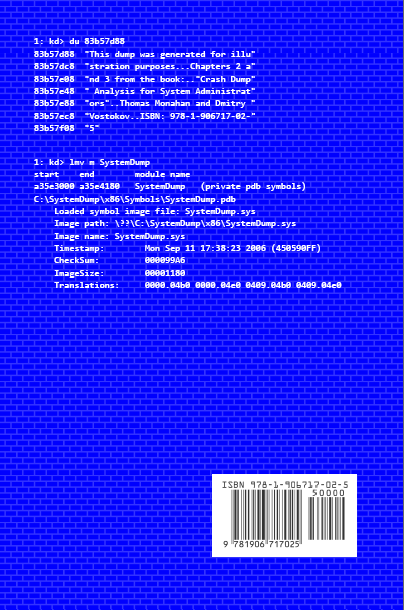
Back:
- Dmitry Vostokov @ DumpAnalysis.org -
Posted in Announcements, Books, Citrix, Crash Dump Analysis, Crash Dumps for Dummies, Minidump Analysis, Publishing, Security, Software Technical Support, Testing, Tools, Training and Seminars, Vista, WinDbg Tips and Tricks, Windows Server 2008 | No Comments »
Tuesday, October 28th, 2008
It is not about me. It is the reciprocal counterpart to Five golden rules of troubleshooting. Whereas the former are for artefact submitters, internal and external customers of memory dump analysts and complex trace readers, I‘m RARE are rules for writing analysis reports with easy to remember mnemonic:
I‘m RARE - Iridium Rules of Analysis Report Excellence
Note about Iridium metal from Wikipedia: “It is one of the rarest elements in the Earth’s crust, with annual production and consumption of only three tonnes.”
Here is the draft number 5 of them (subject to change in the forthcoming weeks):
-
Use a template.
-
Structure a report according to audience technical level and organizational processes.
-
Use checklists not only for commands and tools but also for things to avoid in reports and things to encourage.
-
Put all relevant data for later search and for other engineers to reproduce the analysis.
-
Provide appropriate explanations and narrative in the cases where analysis is inconclusive.
This also needs to be integrated with PARTS methodology.
- Dmitry Vostokov @ DumpAnalysis.org -
Posted in Announcements, Crash Dump Analysis, Debugging, Software Technical Support, Troubleshooting Methodology | 1 Comment »
Sunday, October 26th, 2008
I continued thinking about bugteria in memory dumps all the day yesterday and came to the conclusion that the study of crash dump analysis patterns needs its own name and the obvious choice was Bugteriology:
Bugteriology is the study of crash dump analysis patterns (bugteria). Its main subject is identification, classification and characterization of such patterns found in memory dumps (bugterial species).
I initially registered a domain for this purpose (later abandoned) pointing to crash dump analysis and debugging portal but I want to think through this idea and perhaps make it a subdomain of dumpanalysis.org with a page for easy online pattern classification and make it also an online supplement to forthcoming encyclopedia of crash dump analysis patterns.
- Dmitry Vostokov @ DumpAnalysis.org -
Posted in Announcements, Crash Dump Analysis, Crash Dump Patterns, Debugging, Fun with Crash Dumps, New Words, Science of Memory Dump Analysis, Software Technical Support | No Comments »
Saturday, October 25th, 2008
Yesterday was one of those days when I was in a good mood thinking about bugs. Suddenly a thought stroke me about the similar sounding words bacterium and bugterium (perhaps because I’m currently reading a theoretical biology book, Essays on Life Itself). I admit that it might be sounding the same only for a non-native English ear though. So the new definition was born:
Bugterium (pl. bugteria) - an instance of a memory dump analysis pattern found in a crash (memory, core) dump file.
Why a bugterium and not a cdarium? The motivation (with a hindsight) lies in the complexity of debugging (and life forms). While a bug is a complex thing (and a beast) and it takes sometimes days or weeks to chase and fix (kill) the one, a bugterium (bacterium) is of relatively smaller complexity and can be easily identified and dealt with by component removal or upgrade (massively killed). From software support perspective remember this bugtation No.14:
Crash dump analysis ”is anticipated with” joy, “performed with” eagerness, “and bragged about forever.”
Although the perceived simplicity of crash dump analysis is deceptive (bugtation No.2):
“It requires a very unusual mind to undertake the analysis of the obvious” crash.
Alfred North Whitehead, Science and the Modern World
- Dmitry Vostokov @ DumpAnalysis.org -
Posted in Announcements, Bugtations, Crash Dump Analysis, Crash Dump Patterns, Debugging, Fun with Crash Dumps, New Words, Software Technical Support | 1 Comment »
Thursday, October 23rd, 2008
“It takes a wise” engineer “to know when not to” debug.
Baltasar Gracián, The Art of Worldly Wisdom
- Dmitry Vostokov @ DumpAnalysis.org -
Posted in Bugtations, Debugging, Software Technical Support | No Comments »
Wednesday, October 22nd, 2008
Just realized that yesterday I wrote 100th crash dump analysis pattern. Today I’m going to write 101st. Just to remind that the fully classified color catalog of them is planned to be published:
Forthcoming CDAP Encyclopedia
More details will be announced closer to that date.
- Dmitry Vostokov @ DumpAnalysis.org -
Posted in Announcements, Books, Crash Dump Analysis, Crash Dump Patterns, Debugging, Philosophy, Software Technical Support, Testing | 1 Comment »
Saturday, October 18th, 2008
Paperback edition of Memory Dump Analysis Anthology, Volume 2 is finally available on Amazon and Barnes & Noble. Search Inside is also available on Amazon. In addition, I updated the list of recommended books:
Listmania! Crash Dump Analysis and Debugging
Hardcover edition will be available on Amazon and B&N in 2-3 weeks.
- Dmitry Vostokov @ DumpAnalysis.org -
Posted in Announcements, Assembly Language, Books, Bugchecks Depicted, CDF Analysis Tips and Tricks, Certification, Citrix, Common Mistakes, Crash Dump Analysis, Crash Dump Patterns, Crash Dumps for Dummies, Data Recovery, DebugWare Patterns, Debugging, Fun with Crash Dumps, Hardware, Kernel Development, Memory Analysis Forensics and Intelligence, Memory Dump Analysis Jobs, Memory Visualization, Minidump Analysis, Music for Debugging, New Words, Philosophy, Publishing, Science of Memory Dump Analysis, Security, Software Architecture, Software Technical Support, Stack Trace Collection, Testing, Tools, Training and Seminars, Troubleshooting Methodology, Virtualization, Vista, WinDbg Scripts, WinDbg Tips and Tricks, WinDbg for GDB Users, Windows Server 2008 | No Comments »