Archive for the ‘Software Technical Support’ Category
Sunday, May 31st, 2009
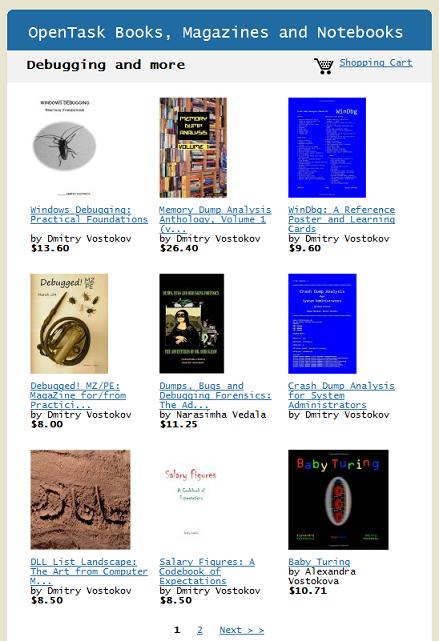
DumpAnalysis.org has changed its book store to Amazon aStore to incorporate all published OpenTask books, magazines and notebooks:
Here is the direct link:
Dump Analysis Portal Store
The screenshot:
- Dmitry Vostokov @ DumpAnalysis.org -
Posted in Announcements, Books, Crash Dump Analysis, Debugging, Publishing, Software Technical Support | No Comments »
Saturday, May 23rd, 2009
Universal memory dumps come from astronomical observations:
Dumps “are meaningless without” symbols “to interpret them.”
Raymond Arthur Lyttleton, Quoted in Astroparticle Physics, page 50
- Dmitry Vostokov @ DumpAnalysis.org -
Posted in Bugtations, Crash Dump Analysis, Crash Dumps for Dummies, Debugging, Minidump Analysis, Philosophy, Science of Memory Dump Analysis, Software Technical Support | No Comments »
Friday, May 22nd, 2009
“Oh, he is a good” troubleshooter, “but he has no power of” debugging!”
Charles Darwin, The life and letters of Charles Darwin, Volume 1
- Dmitry Vostokov @ DumpAnalysis.org -
Posted in Bugtations, Debugging, Software Technical Support | No Comments »
Monday, May 18th, 2009
This is a forthcoming book to be released next year after we finally publish DebugWare book by the end of this summer:
Software Tracing and Logging: Architecture, Design, Implementation and Analysis Patterns (ISBN: 978-1906717728)
I have already begun working on it in the background. The scope of DebugWare book is too wide to cover tracing and logging in great detail not to mention the very important subject of software trace analysis.
- Dmitry Vostokov @ TraceAnalysis.org -
Posted in Announcements, Books, Debugging, Publishing, Science of Software Tracing, Software Architecture, Software Technical Support, Tools, Trace Analysis Patterns, Troubleshooting Methodology, Windows System Administration | No Comments »
Monday, May 18th, 2009
This post number is 1,000. Wordpress admin panel reports that I have written 999 (excluding this one):
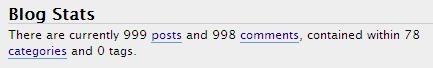
Of course, I wrote my 1,000th blog post some time ago if I count all my 7 blogs but this is 1,000th post for just this blog.
To celebrate this event, I’m posting a picture of troubleshooting and debugging labyrinth resting on a notion of universal memory dumps that are observational snapshots and include both memory and various traces we collect to resolve problems.
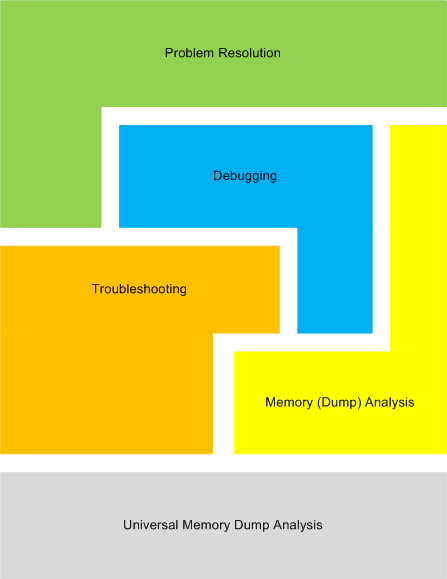
This picture shows how we arrive to problem resolution. For example:

I’m also working on another picture, called T&D Tangram 
- Dmitry Vostokov @ DumpAnalysis.org -
Posted in Announcements, Crash Dump Analysis, Debugging, History, Software Technical Support | No Comments »
Thursday, May 14th, 2009
Part 2 briefly discussed debuggers and their commands. Debugger commands can be grouped together into scripts that can be run against memory dump files and their resulted textual output can be redirected to log files.
Therefore we start with the first step in our analysis process diagram introduced in Part 1:
Information Collection: Scripts
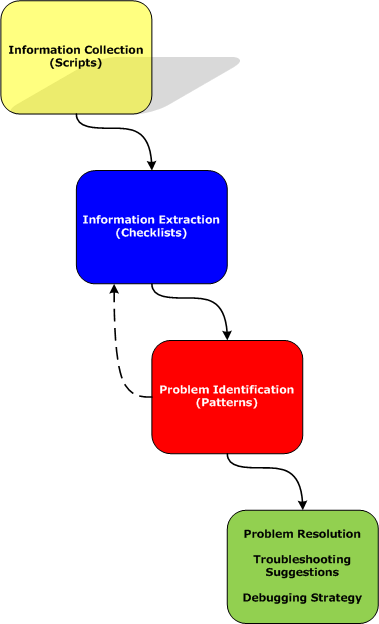
Here a script is a sequence of instructions to extract formatted textual information from a memory dump file (or a live system). There are many advantages of scripts and logs. Many companies, for example, banks, avoid sending plain memory dump files because of security considerations in order to prevent exposure of company or private information. After the advent of 64-bit personal computing complete memory dump files became larger and larger and it is now common to get 32Gb memory dumps. Processing multiple long-running commands can easily be done from textual log files. Additionally, scripts can be used to process hundreds of memory dumps in one go to look for similarities and differences. Many tools can be used for such purpose including built-in debugger scripting capabilities, shell scripting and regular expressions for intelligent search.
- Dmitry Vostokov @ DumpAnalysis.org -
Posted in Citrix, Crash Dump Analysis, Crash Dump Patterns, Debugging, Debugging Methodology, Memory Analysis Forensics and Intelligence, Security, Software Technical Support, Troubleshooting Methodology, WinDbg Scripts | No Comments »
Tuesday, May 12th, 2009
Previously announced memory dump analysis certification will have x86/x64-based tracks for Windows and Unix (including Linux / FreeBSD / Mac OS X). Each track consists of 3 exams, each having its own set of requirements and scope:
- Fundamentals of Memory Dump Analysis
- Intermediate Memory Dump Analysis
- Advanced Memory Dump Analysis
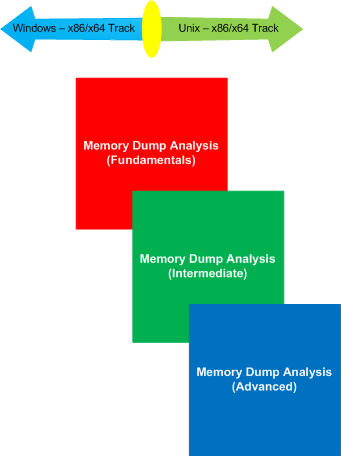
More information will be available later. The initiative is supported by OpenTask.
- Dmitry Vostokov @ DumpAnalysis.org -
Posted in Announcements, Certification, Crash Dump Analysis, Crash Dump Patterns, Debugging, Education and Research, Memory Dump Analysis Jobs, Minidump Analysis, Software Technical Support, Training and Seminars, WinDbg Tips and Tricks, WinDbg for GDB Users, Windows System Administration | No Comments »
Tuesday, April 28th, 2009
After coming back to engineering I decided to expand the domain of my research and start the new series of posts called Trace Analysis Patterns. In addition to Citrix CDF / Microsoft ETW traces I plan to cover other variants based on my extensive software engineering background in the past where I used tracing in software products ranging from soft multi-platform real-time systems to static code analysis tools. Connection with memory dump analysis will be covered too because sometimes the combination of static and dynamic data leads to interesting observations and helps to troubleshoot and resolve customer problems especially when not all data can be collected dynamically.
In fact, stack traces and their collections are specializations of the more general traces. Another example is historical information in memory dump files especially when it is somehow timestamped.
In this part I start with the obvious and to some extent the trivial pattern called Periodic Error. This is an error or a status value that is observed periodically many times:
No     PID  TID   Date      Time         Statement

[...]

664957 1788 22504 4/23/2009 17:59:14.600 MyClass::Initialize: Cannot open connection “Client ID: 310″, status=5

[…]

668834 1788 19868 4/23/2009 19:11:52.979 MyClass::Initialize: Cannot open connection “Client ID: 612″, status=5

[…]
or
No     PID  TID   Date      Time         Statement

[...]

202314 1788 19128 4/21/2009 16:03:46.861 HandleDataLevel: Error 12005 Getting Mask

[…]

347653 1788 17812 4/22/2009 13:26:00.735 HandleDataLevel: Error 12005 Getting Mask

[…]
Here single trace entries can be isolated from the trace and studied in detail.
Be aware though that some modules might report periodic errors that are false positive, in the sense, that they are expected as a part of implementation details, for example, when a function returns an error to indicate that bigger buffer is required or to estimate its size for a subsequent call. It merits its own pattern name and I come to it next time with more examples.
I also created a page where I’ll will be adding all tracing patterns:
Trace Analysis Patterns
- Dmitry Vostokov @ TraceAnalysis.org -
Posted in Announcements, CDF Analysis Tips and Tricks, Citrix, Debugging, Software Technical Support, Software Trace Analysis, Trace Analysis Patterns, Troubleshooting Methodology | 5 Comments »
Monday, April 27th, 2009
I’m RARE rule #5 says:
“Provide appropriate explanations and narrative in the cases where analysis is inconclusive”.
Here is the typical example of such case when a kernel dump was taken with the vague description about server problems. The dump file analysis revealed the following abnormal conditions warranting further troubleshooting steps:
The AppA.exe, the part of the customer product, is about 1Gb in size when its typical size should be no more than 200Mb. Perhaps we have a memory leak here. We can suggest to take a few consecutive memory dumps of the growing memory and analyze it later as described in a heap leak pattern. This can also be a .NET leak too if unmanaged AppA.exe happened to load any managed components through 3rd-party DLLs. It could be also some unknown loaded component reserved and committed large portion of virtual memory space.
0: kd> !vm

[...]

0eec AppA.exe        241366 (    965464 Kb)

03c0 svchost.exe      10304 (     41216 Kb)

0230 lsass.exe         8764 (     35056 Kb)

0298 svchost.exe       6402 (     25608 Kb)

01f4 winlogon.exe      5787 (     23148 Kb)

[…]
We can confirm the absence of handle leaks:
0: kd> !process 0eec

Searching for Process with Cid == eec

Cid Handle table at fffffa80014d6000 with 794 Entries in use

PROCESS fffffade6e601860

    SessionId: 0  Cid: 0eec    Peb: 7efdf000  ParentCid: 0eb8

    DirBase: b10fa000  ObjectTable: fffffa8000c39170  HandleCount: 865.

    Image: AppA.exe

    VadRoot fffffade68d7e580 Vads 1961 Clone 0 Private 237843. Modified 77. Locked 1.

    DeviceMap fffffa8001221580

    Token                             fffffa8001fdebe0

    ElapsedTime                       6 Days 22:18:09.271

    UserTime                          00:23:00.406

    KernelTime                        00:27:31.281

    QuotaPoolUsage[PagedPool]         106968

    QuotaPoolUsage[NonPagedPool]      19055186

    Working Set Sizes (now,min,max)  (240529, 50, 345) (962116KB, 200KB, 1380KB)

    PeakWorkingSetSize                240671

    VirtualSize                       1244 Mb

    PeakVirtualSize                   1246 Mb

    PageFaultCount                    244053

    MemoryPriority                    BACKGROUND

    BasePriority                      8

    CommitCharge                      241366
Kernel and user times seem high (about 30 minutes) but it correlates with almost 7 day extensive application usage that involves constant database access.
Looking further at running processes we see that the crucial AppB and AppC applications that were supposed to be running to serve user requests are orphaned:
09e8 AppB.exe            0 (         0 Kb)

09c0 AppC.exe            0 (         0 Kb)
Were they closed normally, forcefully terminated after being hang or crashed? These questions should be asked and appropriate measures taken to capture crash dumps in case event logs reveal access violations.
- Dmitry Vostokov @ DumpAnalysis.org -
Posted in Crash Dump Analysis, Crash Dump Patterns, Software Technical Support, Troubleshooting Methodology | No Comments »
Tuesday, April 21st, 2009
Before we explain stages of the analysis process shown in Part 1, let’s start with a brief overview of memory dumps, debuggers and logs. Recall that a memory dump is a snapshot of a process, system or physical memory state. This unifies post-mortem analysis and live debugging. Debuggers are tools that allow us to get and modify these memory snapshots. Other tools that allow us to get memory dump files are process dumpers like userdump.exe, Task Manager since Vista, WER, and system dumpers like LiveKd and Win32dd. We should not forget tools and methods that allow us to trigger Windows kernel ability to save consistent memory dump files: NMI button, keyboard method and various software bugcheck-triggers like Citrix SystemDump. Now coming back to debuggers. One of their essential features is to save a debugging session log, formatted textual output saved in a text file for further processing. One good example is !process 0 ff WinDbg command to output all processes and their thread stack traces (see Stack Trace Collection pattern for other variations).
I’ve created a page to add all P-DMA parts as soon as I write them:
Pattern-Driven Memory Analysis
- Dmitry Vostokov @ DumpAnalysis.org -
Posted in Citrix, Crash Dump Analysis, Crash Dump Patterns, Debugging, Debugging Methodology, Memory Analysis Forensics and Intelligence, Security, Software Technical Support, Troubleshooting Methodology, WinDbg Scripts | 1 Comment »
Wednesday, April 15th, 2009
On 15th of April last year I published
The First Windows Memory Dump Analysis Book!
To celebrate its anniversary OpenTask iterative and incremental publisher will publish Volume 3 this year simultaneously with another book featuring selected articles from Volumes 1-3 printed in full color:
Memory Dump Analysis Anthology: Color Supplement for Volumes 1-3 (ISBN: 978-1906717698)
This title will compensate for the lack of color inserts in MDAA volumes.
- Dmitry Vostokov @ DumpAnalysis.org -
Posted in Announcements, Books, Crash Dump Analysis, Debugging, Publishing, Software Technical Support | 1 Comment »
Wednesday, April 1st, 2009
Microsoft to add 5th memory dump type to the final version of Windows 7. In addition to kernel, complete, mini and user dump file types new memory dumps will include all open files to allow full data recovery and postmortem process resurrection on another computer. The new coming soon version of WinDbg includes specialized extensions for process instantiation and recursive data recovery near the point of failure:
blogs.technet.com/5thcolumn
- Dmitry Vostokov @ DumpAnalysis.org -
Posted in Announcements, Crash Dump Analysis, Data Recovery, Debugging, Security, Software Technical Support, Tools, Windows 7 | 2 Comments »
Sunday, March 29th, 2009
Finally it has been published and available for orders from Amazon and other bookstores:
http://www.dumpanalysis.org/Debugged+Magazine
I had to increase the number of pages for the first issue from 16, planned originally, to 28 and this is reflected in the retail price of $10 (originally planned $8) but bookstores should sell it with a discount between 0% and 55%.
More information about the next issue should be ready by the end of the next week.
- Dmitry Vostokov @ DumpAnalysis.org -
Posted in Announcements, Crash Dump Analysis, Crash Dump Patterns, Debugged! MZ/PE, Debugging, History, Memory Analysis Forensics and Intelligence, Publishing, Security, Software Technical Support, Testing, Tools, Training and Seminars, Troubleshooting Methodology, WinDbg Scripts, WinDbg Tips and Tricks | No Comments »
Sunday, March 29th, 2009
Previously announced Memory Analysis and Debugging Institute was registered in the Republic of Ireland (No. 382026) last week.
- Dmitry Vostokov @ DumpAnalysis.org -
Posted in Announcements, Crash Dump Analysis, Debugging, Education and Research, History, Memory Analysis Forensics and Intelligence, Memory Visualization, Philosophy, Riemann Programming Language, Science of Memory Dump Analysis, Security, Software Technical Support, Testing, Training and Seminars | No Comments »
Sunday, March 29th, 2009
I’m very proud to announce that my first 2 volumes of Memory Dump Analysis Anthology are to be translated and published in the Republic of Korea this year:
http://www.opentask.com/korean-rights-mdaa-v1-v2
- Dmitry Vostokov @ DumpAnalysis.org -
Posted in Announcements, Books, Crash Dump Analysis, Debugging, History, Publishing, Software Technical Support | 1 Comment »
Wednesday, March 18th, 2009
Yesterday I submitted the magazine to print and distribution world-wide. If everything is right it should be available by the end of this month. This first issue features 12 page WinDbg command supplement to pattern-driven memory dump analysis methodology, an overview of Win32dd complete memory dumper and PowerDbg enhancements to debug ASP.NET code. The magazine will only be available in print.
- Dmitry Vostokov @ DumpAnalysis.org -
Posted in Announcements, Books, Crash Dump Analysis, Crash Dump Patterns, Debugged! MZ/PE, Debugging, Memory Analysis Forensics and Intelligence, Minidump Analysis, Publishing, Security, Software Technical Support, Testing, Tools, Training and Seminars, WinDbg Scripts, WinDbg Tips and Tricks | No Comments »
Saturday, March 7th, 2009
I’m sorry to announce that the book has been delayed and the publication date has been changed to 30th of November, 2009. I promise this delay is the last one and kindly ask you to be patient. As a bonus or compensation for it, the book will also cover Windows 7.
- Dmitry Vostokov @ DumpAnalysis.org -
Posted in Announcements, Books, Crash Dump Analysis, Minidump Analysis, Publishing, Software Technical Support, Testing, Tools, Training and Seminars, Vista, Windows 7, Windows Server 2008, Windows System Administration | No Comments »
Monday, March 2nd, 2009
Last week I had an opportunity to present a pattern-driven memory dump analysis methodology at a global engineering conference. Now in a series of articles I’m going to clarify certain points and extend it to wider domain of memory analysis including computer memory forensics and intelligence.
Today I post the reworked picture of a waterfall-like analysis process:
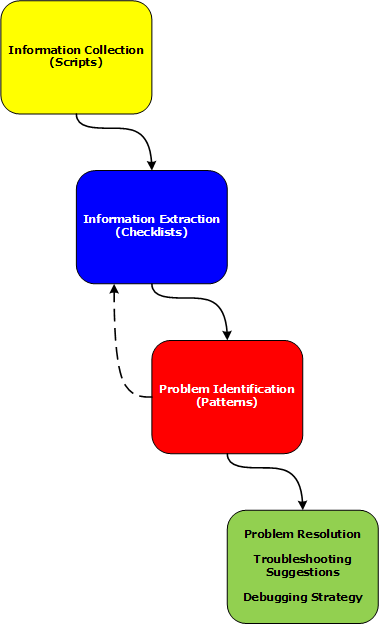
Various phases and their relationship will be discussed in subsequent parts together with examples.
- Dmitry Vostokov @ DumpAnalysis.org -
Posted in Citrix, Crash Dump Analysis, Crash Dump Patterns, Debugging, Debugging Methodology, Memory Analysis Forensics and Intelligence, Security, Software Technical Support, Troubleshooting Methodology, WinDbg Scripts | 2 Comments »
Thursday, February 26th, 2009
Debugger logs (textual output) from commands like !process 0 ff and various scripts can be very long and consist of thousands of pages. I found the following reading technique useful for my daily memory dump analysis activities:
CSA-QSA
Checklists-Skim-Analyze—Questions-Survey-Analyze
1. First, have a checklist
2. Skim through the log several times
3. Write analysis notes
4. Have a list of questions based on problem description and steps 1-3
5. Survey the log
6. Write analysis notes
Repeat steps 2,3 and 5,6 if necessary.
This technique can also be applied to reading any large logs, for example, voluminous CDF or ETW traces.
- Dmitry Vostokov @ DumpAnalysis.org -
Posted in CDF Analysis Tips and Tricks, Crash Dump Analysis, Crash Dump Patterns, Debugging, Software Technical Support, Stack Trace Collection, Tools | No Comments »