Archive for the ‘Software Behavior Patterns’ Category
Thursday, November 25th, 2010
Posted in Announcements, Complete Memory Dump Analysis, Crash Analysis Report Environment (CARE), Crash Dump Analysis, Crash Dump De-analysis, Crash Dump Patterns, Debugging, Debugging Industry, Escalation Engineering, Kernel Development, Memory Analysis Forensics and Intelligence, Memory Dump Analysis Services, Minidump Analysis, Software Behavior Patterns, Software Engineering, Software Technical Support, Software Trace Analysis, Software Troubleshooting Patterns, Tools, Trace Analysis Patterns, Vista, Windows 7, Windows Server 2008, Windows System Administration, Workaround Patterns, x64 Windows | No Comments »
Friday, November 12th, 2010
Five volumes of cross-disciplinary Anthology (dubbed by the author “The Summa Memorianica”) lay the foundation of the scientific discipline of Memoretics (study of computer memory snapshots and their evolution in time) that is also called Memory Dump and Software Trace Analysis.ca
The 5th volume contains revised, edited, cross-referenced, and thematically organized selected DumpAnalysis.org blog posts about crash dump, software trace analysis and debugging written in February 2010 - October 2010 for software engineers developing and maintaining products on Windows platforms, quality assurance engineers testing software on Windows platforms, technical support and escalation engineers dealing with complex software issues, and security researchers, malware analysts and reverse engineers. The fifth volume features:
- 25 new crash dump analysis patterns
- 11 new pattern interaction case studies (including software tracing)
- 16 new trace analysis patterns
- 7 structural memory patterns
- 4 modeling case studies for memory dump analysis patterns
- Discussion of 3 common analysis mistakes
- Malware analysis case study
- Computer independent architecture of crash analysis report service
- Expanded coverage of software narratology
- Metaphysical and theological implications of memory dump worldview
- More pictures of memory space and physicalist art
- Classification of memory visualization tools
- Memory visualization case studies
- Close reading of the stories of Sherlock Holmes: Dr. Watson’s observational patterns
- Fully cross-referenced with Volume 1, Volume 2, Volume 3, and Volume 4
Product information:
- Title: Memory Dump Analysis Anthology, Volume 5
- Author: Dmitry Vostokov
- Language: English
- Product Dimensions: 22.86 x 15.24
- Paperback: 400 pages
- Publisher: Opentask (10 December 2010)
- ISBN-13: 978-1-906717-96-4
- Hardcover: 400 pages
- Publisher: Opentask (10 December 2010)
- ISBN-13: 978-1-906717-97-1

Back cover features memory space art image Hot Computation: Memory on Fire.
- Dmitry Vostokov @ DumpAnalysis.org + TraceAnalysis.org -
Posted in Aesthetics of Memory Dumps, Announcements, Archaeology of Computer Memory, Art, Assembly Language, Books, C and C++, CDF Analysis Tips and Tricks, Categorical Debugging, Common Mistakes, Complete Memory Dump Analysis, Computer Science, Crash Analysis Report Environment (CARE), Crash Dump Analysis, Crash Dump De-analysis, Crash Dump Patterns, Debugging, Debugging Methodology, Debugging Slang, Deep Down C++, Dr. Watson, Dublin School of Security, Education and Research, Escalation Engineering, Fun with Crash Dumps, Fun with Debugging, Fun with Software Traces, General Memory Analysis, Hermeneutics of Memory Dumps and Traces, Images of Computer Memory, Kernel Development, Malware Analysis, Malware Patterns, Mathematics of Debugging, Memiotics (Memory Semiotics), Memoidealism, Memoretics, Memory Analysis Culture, Memory Analysis Forensics and Intelligence, Memory Analysis Report System, Memory Diagrams, Memory Dreams, Memory Dump Analysis Jobs, Memory Dump Analysis Services, Memory Dump Analysis and History, Memory Dumps in Movies, Memory Dumps in Myths, Memory Religion (Memorianity), Memory Space Art, Memory Systems Language, Memory Visualization, Memory and Glitches, Memuonics, Metaphysical Society of Ireland, Minidump Analysis, Movies and Debugging, Multithreading, Museum of Debugging, Music for Debugging, Music of Computation, New Acronyms, New Words, Paleo-debugging, Pattern Models, Pattern Prediction, Philosophy, Physicalist Art, Psychoanalysis of Software Maintenance and Support, Publishing, Science of Memory Dump Analysis, Science of Software Tracing, Security, Software Architecture, Software Behavior Patterns, Software Chorography, Software Chorology, Software Defect Construction, Software Engineering, Software Generalist, Software Maintenance Institute, Software Narratology, Software Technical Support, Software Trace Analysis, Software Trace Analysis and History, Software Trace Deconstruction, Software Trace Reading, Software Trace Visualization, Software Tracing for Dummies, Software Troubleshooting Patterns, Software Victimology, Stack Trace Collection, Structural Memory Analysis and Social Sciences, Structural Memory Patterns, Structural Trace Patterns, Systems Thinking, Testing, Theology, Tool Objects, Tools, Trace Analysis Patterns, Training and Seminars, Troubleshooting Methodology, Uses of UML, Victimware, Virtualization, Vista, Visual Dump Analysis, Webinars, WinDbg Scripts, WinDbg Tips and Tricks, WinDbg for GDB Users, Windows 7, Windows Server 2008, Windows System Administration, Workaround Patterns, x64 Windows | No Comments »
Saturday, November 6th, 2010
I’m pleased to announce that MDAA, Volume 4 is available in PDF format:
www.dumpanalysis.org/Memory+Dump+Analysis+Anthology+Volume+4
It features:
- 15 new crash dump analysis patterns
- 13 new pattern interaction case studies
- 10 new trace analysis patterns
- 6 new Debugware patterns and case study
- Workaround patterns
- Updated checklist
- Fully cross-referenced with Volume 1, Volume 2 and Volume 3
- Memory visualization tutorials
- Memory space art
Its table of contents is available here:
http://www.dumpanalysis.org/MDAA/MDA-Anthology-V4-TOC.pdf
Paperback and hardcover versions should be available in a week or two. I also started working on Volume 5 that should be available in December.
- Dmitry Vostokov @ DumpAnalysis.org + TraceAnalysis.org -
Posted in .NET Debugging, Aesthetics of Memory Dumps, Announcements, AntiPatterns, Art, Assembly Language, Books, C and C++, CDF Analysis Tips and Tricks, Categorical Debugging, Common Mistakes, Complete Memory Dump Analysis, Computer Science, Countefactual Debugging, Crash Dump Analysis, Crash Dump Patterns, DebugWare Patterns, Debugging, Debugging Slang, Deep Down C++, Education and Research, Escalation Engineering, Fun with Crash Dumps, Fun with Debugging, Images of Computer Memory, Kernel Development, Memiotics (Memory Semiotics), Memoidealism, Memoretics, Memory Space Art, Memory Visualization, Memuonics, Metaphysics of Memory Worldview, Multithreading, Opcodism, Philosophy, Physicalist Art, Publishing, Science Fiction, Science of Memory Dump Analysis, Science of Software Tracing, Security, Software Architecture, Software Behavior Patterns, Software Defect Construction, Software Engineering, Software Narratology, Software Technical Support, Software Trace Analysis, Software Trace Reading, Software Victimology, Stack Trace Collection, Testing, Tools, Trace Analysis Patterns, Troubleshooting Methodology, Uses of UML, Victimware, Virtualization, Vista, Visual Dump Analysis, WinDbg Scripts, WinDbg Tips and Tricks, Windows 7, Windows Server 2008, Windows System Administration, Workaround Patterns, x64 Windows | No Comments »
Wednesday, November 3rd, 2010
I have discovered rules that make it possible to devise a memory dump and software trace analysis equivalent of the Periodic Table of Elements in Chemistry. It allows prediction of abnormal software behaviour and structural defects and what patterns to look for after deploying software and collecting its artifacts. More on this is in the next part of these series.
- Dmitry Vostokov @ DumpAnalysis.org + TraceAnalysis.org -
Posted in Announcements, Chemistry, Crash Dump Analysis, Crash Dump Patterns, Debugging, Pattern Prediction, Software Behavior Patterns, Software Trace Analysis, Structural Memory Patterns, Structural Trace Patterns, Trace Analysis Patterns | No Comments »
Wednesday, November 3rd, 2010
There are two trace reading practices with techniques borrowed from structuralist and post-structuralist narratology:
1. Close reading
- emphasizes structural patterns
- looks at a software trace as a unity of messages
- searches for similarities, repetitions and contrasts
- reveals code reflections in message texts
2. Deconstructive reading
- reveals subconscious exposed in message texts
- searches for conflicting and absent messages
- looks at a software trace as a disunity of messages from conflicting components
- Dmitry Vostokov @ DumpAnalysis.org + TraceAnalysis.org -
Posted in Debugging, Software Behavior Patterns, Software Narratology, Software Trace Analysis, Software Trace Deconstruction, Software Trace Reading, Structural Trace Patterns, Trace Analysis Patterns | No Comments »
Saturday, October 23rd, 2010
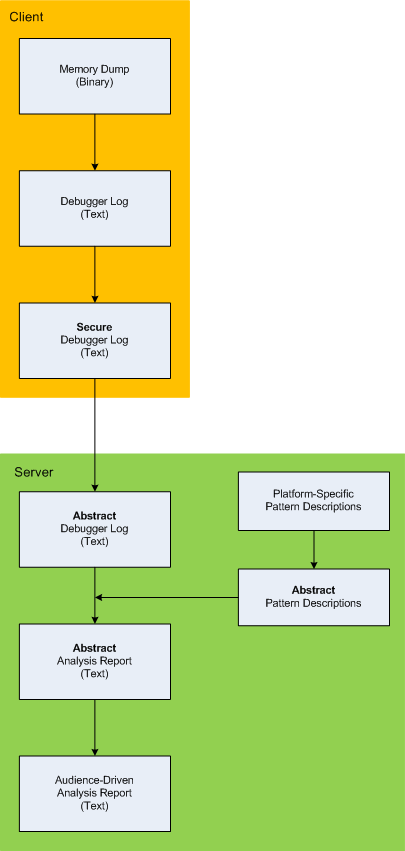
Here is the description of a high-level architecture of the previously announced project CARE (Crash Analysis Report Environment). To remind, the main idea of the project is to process memory dumps on a client to save debugger logs. They can be sent to a server for pattern-driven analysis of software behaviour. Textual logs can also be inspected by a client security team before sending. Certain sensitive information can be excluded or modified to have generic meaning according to the built-in processing rules like renaming (for example, server names and folders). Before processing, verified secured logs are converted to abstract debugger logs. Abstracting platform-specific debugger log format allows reuse of the same architecture for different computer platforms. We call it CIA (Computer Independent Architecture). Do not confuse it with ICA (Independent Computer Architecture) and CIA acronym is more appropriate for memory analysis (like similar MAFIA acronym, Memory Analysis Forensics and Intelligence Architecture). These abstract logs are checked for various patterns (in abstracted form) using abstract debugger commands and an abstract report is generated according to various checklists. Abstract reports are then converted to structured reports for the required audience level. Abstract memory analysis pattern descriptions are prepared from platform-specific pattern descriptions. In certain architectural component deployment configurations both client and server parts can reside on the same machine. Here’s the simple diagram depicting the flow of processing:
- Dmitry Vostokov @ DumpAnalysis.org + TraceAnalysis.org -
Posted in Announcements, Crash Analysis Report Environment (CARE), Crash Dump Analysis, Crash Dump Patterns, Debugging, Memory Analysis Forensics and Intelligence, New Acronyms, Security, Software Architecture, Software Behavior Patterns, Software Technical Support, Structural Memory Patterns, Tools | No Comments »
Wednesday, October 20th, 2010
As a practical example of applying behavioral and structural pattern analysis of computer memory and traces OpenTask plans to publish the following title next year:
- Title: Malware Patterns: Structure and Behavior of Computer Adware, Crimeware, Rootkits, Scareware, Spyware, Trojans, Viruses, Victimware and Worms
- Author: Dmitry Vostokov
- Paperback: 1200 pages
- Publisher: OpenTask (October 2011)
- ISBN-13: 978-1-908043-01-6
The inclusion of victimware is necessary because of the effects of defective malware.
- Dmitry Vostokov @ DumpAnalysis.org + TraceAnalysis.org -
Posted in Announcements, Books, Crash Dump Analysis, Crash Dump Patterns, Malware Analysis, Malware Patterns, Memiotics (Memory Semiotics), Memoretics, Memory Analysis Forensics and Intelligence, Publishing, Science of Memory Dump Analysis, Science of Software Tracing, Security, Software Behavior Patterns, Software Defect Construction, Software Trace Analysis, Software Victimology, Structural Memory Patterns, Trace Analysis Patterns, Victimware | No Comments »
Thursday, October 7th, 2010
It is time now to introduce a syntactical notation for memory (dump) and software trace analysis pattern languages (in addition to graphical notation proposed earlier). It should be simple and concise: allow easy grammar with plain syntax and obvious reading semantics. We propose to use capitalized letters for major pattern categories, for example, W for wait chains and D for deadlocks. Then use subscripts (or small letters) for pattern subcategories, for example, Wcs and Dlpc. Several categories and subcategories can be combined by using slash (/), for example, Wcs/Dcs/lpc. Slash notation is better viewed using subscripts:
Wcs/Dcs/lpc
Next part will introduce more categories and propose notational adornments for pattern succession, space differentiation and the inclusion of details in notational sentences.
- Dmitry Vostokov @ DumpAnalysis.org + TraceAnalysis.org -
Posted in Analysis Notation, Crash Dump Analysis, Crash Dump Patterns, Debugging, Science of Memory Dump Analysis, Science of Software Tracing, Software Behavior Patterns, Software Trace Analysis, Structural Memory Patterns, Trace Analysis Patterns | No Comments »
Tuesday, October 5th, 2010
The choice of webinars below mostly reflects my personal preferences and long time desire to speak on topics like systems thinking, troubleshooting tool design and development. The other topic about BSOD minidump analysis was requested by participants in an ongoing survey. There will be more topics in 2011. All forthcoming webinars will be hosted by Memory Dump Analysis Services. The planning list includes:
Systems Thinking in Memory Dump and Software Trace Analysis
Software Troubleshooting and Debugging Tools: Objects, Components, Patterns and Frameworks with UML
- UML basics
- DebugWare patterns
- Unified Troubleshooting Framework
- RADII software development process
- Hands-on exercise: designing and building a tool
Blue Screen Of Death Analysis Done Right: Minidump Investigation for System Administrators
- Making sense of !analyze –v output
- Get extra troubleshooting information with additional WinDbg commands
- Guessing culprits with raw stack analysis
- Who’s responsible: hardware or software?
- Checklist and patterns
- Including hands-on exercises: send your own minidumps
More detailed information will be available soon.
- Dmitry Vostokov @ DumpAnalysis.org + TraceAnalysis.org -
Posted in Announcements, CDF Analysis Tips and Tricks, Common Mistakes, Common Questions, Crash Analysis Report Environment (CARE), Crash Dump Analysis, Crash Dump De-analysis, Crash Dump Patterns, Crash Dumps for Dummies, DebugWare Patterns, Debugging, Debugging Industry, Debugging Methodology, Escalation Engineering, General Memory Analysis, Hermeneutics of Memory Dumps and Traces, Memory Systems Language, Minidump Analysis, Software Architecture, Software Behavior Patterns, Software Engineering, Software Technical Support, Software Trace Analysis, Software Tracing for Dummies, Structural Memory Patterns, Systems Thinking, Tools, Trace Analysis Patterns, Training and Seminars, Troubleshooting Methodology, Vista, Webinars, WinDbg Tips and Tricks, Windows 7, Windows Server 2008, Windows System Administration, x64 Windows | No Comments »
Monday, September 27th, 2010
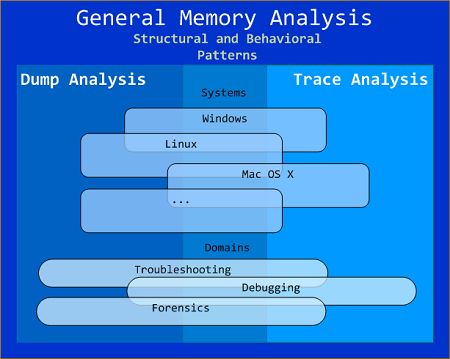
General Memory Analysis is another name for Memoretics, a discipline that studies memory snapshots including their similarities and differences on different system platforms such as Windows, Linus, Mac OS X, embedded and mobile systems, historical architectures, etc. The analysis of memory helps solve problems in various domains such as software troubleshooting and debugging, computer forensic analysis, etc.
The current focus of interdisciplinary research is to build a unified memory pattern language that covers both behavioral and structural patterns and also to study the possibility of building memory systems from below, not from requirements -> architecture -> design -> implementation -> compilation -> linking -> loading -> execution but from directly modeling and assembling memory systems using memory patterns.
- Dmitry Vostokov @ DumpAnalysis.org + TraceAnalysis.org -
Posted in Announcements, Crash Dump Analysis, Debugging, General Memory Analysis, Memiotics (Memory Semiotics), Memoretics, Memory Analysis Forensics and Intelligence, Memory Systems Language, Security, Software Behavior Patterns, Software Technical Support, Software Trace Analysis, Structural Memory Patterns, Trace Analysis Patterns | No Comments »
Friday, September 24th, 2010
Now it’s time to divide memory analysis patterns discerned so far as mostly abnormal software behavior memory dump and software trace patterns into behavioral and structural catalogues. The goal is to account for normal system-independent structural entities and relationships visible in memory like modules, threads, processes and so on.
The first pattern (and also a super-pattern) we discuss in this part is called Memory Snapshot. It is further subdivided into Structured Memory Snapshot and BLOB Memory Snapshot. Structured sub-pattern includes:
- Contiguous memory dump files with artificially generated headers (for example, physical or process virtual space memory dump)
- Software trace messages with imposed internal structure
BLOB sub-pattern variety includes address range snapshots without any externally imposed structure, for example, saved by .writemem WinDbg command or ReadProcessMemory API and contiguous buffer and raw memory dumps saved by various memory acquisition tools.
Behavioral patterns that relate to Memory Snapshot pattern are:
I strive initially to publish at least one such pattern every day to fill the gap of normal patterns in memory analysis and later add more multi-platform details and examples from other platforms like Linux, Mac OS X, embedded and selected important historical architectures.
- Dmitry Vostokov @ DumpAnalysis.org + TraceAnalysis.org -
Posted in Crash Dump Analysis, Crash Dump Patterns, Debugging, General Memory Analysis, Memiotics (Memory Semiotics), Memoretics, Memory Analysis Forensics and Intelligence, Memory Systems Language, Science of Memory Dump Analysis, Science of Software Tracing, Security, Software Behavior Patterns, Software Trace Analysis, Structural Memory Patterns | 1 Comment »
Sunday, July 18th, 2010

Memory Dump Analysis Services (DumpAnalysis.com) organizes a free webinar
Date: 18th of August 2010
Time: 21:00 (BST) 16:00 (Eastern) 13:00 (Pacific)
Duration: 90 minutes
Topics include:
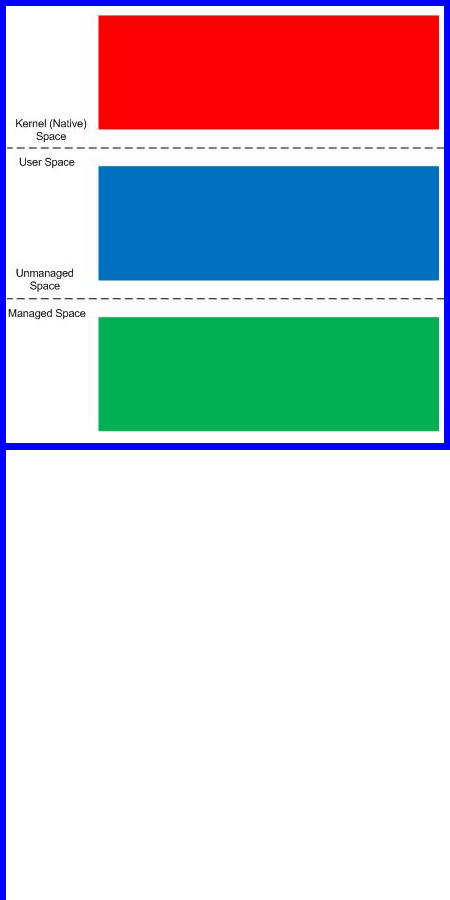
- User vs. kernel vs. physical (complete) memory space
- Challenges of complete memory dump analysis
- Common WinDbg commands
- Patterns
- Common mistakes
- Fiber bundles
- Hands-on exercise: a complete memory dump analysis
- A guide to DumpAnalysis.org case studies
Prerequisites: working knowledge of basic user process and kernel memory dump analysis or live debugging using WinDbg
The webinar link will be posted before 18th of August on DumpAnalysis.com
- Dmitry Vostokov @ DumpAnalysis.org + TraceAnalysis.org -
Posted in Announcements, Common Mistakes, Common Questions, Complete Memory Dump Analysis, Crash Dump Analysis, Crash Dump Patterns, Debugging, Escalation Engineering, Memory Dump Analysis Services, Pattern Models, Security, Software Architecture, Software Behavior Patterns, Software Defect Construction, Software Engineering, Software Technical Support, Stack Trace Collection, Testing, Tools, Training and Seminars, Troubleshooting Methodology, Virtualization, Vista, Webinars, WinDbg Scripts, WinDbg Tips and Tricks, Windows 7, Windows Server 2008, Windows System Administration, x64 Windows | 1 Comment »
Tuesday, July 13th, 2010
Here we model Message Hooks pattern using MessageHistory tool. It uses window message hooking mechanism to intercept window messages. Download the tool and run either MessageHistory.exe or MessageHistory64.exe and push its Start button. Whenever any process becomes active after that either mhhooks.dll or mhhooks64.dll gets injected into the process virtual address space. Then we run WinDbg x86 or WinDbg x64, run notepad.exe and attach the debugger noninvasively to it:
*** wait with pending attach

Symbol search path is: srv*

Executable search path is:

WARNING: Process 2932 is not attached as a debuggee

         The process can be examined but debug events will not be received

(b74.f44): Wake debugger - code 80000007 (first chance)

USER32!NtUserGetMessage+0xa:

00000000`76f9c92a c3              ret
0:000> .symfix
0:000> .reload
0:000> k

Child-SP          RetAddr           Call Site

00000000`0028f908 00000000`76f9c95e USER32!NtUserGetMessage+0xa

00000000`0028f910 00000000`ff511064 USER32!GetMessageW+0x34

00000000`0028f940 00000000`ff51133c notepad!WinMain+0x182

00000000`0028f9c0 00000000`76e7f56d notepad!DisplayNonGenuineDlgWorker+0x2da

00000000`0028fa80 00000000`770b3281 kernel32!BaseThreadInitThunk+0xd

00000000`0028fab0 00000000`00000000 ntdll!RtlUserThreadStart+0x1d
If we don’t select “Noninvasive” in “Attach to Process” dialog box we need to switch from the debugger injected thread to our main notepad application thread:
0:001> .symfix
0:001> .reload
0:001> k

Child-SP          RetAddr           Call Site

00000000`024bfe18 00000000`77178638 ntdll!DbgBreakPoint

00000000`024bfe20 00000000`76e7f56d ntdll!DbgUiRemoteBreakin+0x38

00000000`024bfe50 00000000`770b3281 kernel32!BaseThreadInitThunk+0xd

00000000`024bfe80 00000000`00000000 ntdll!RtlUserThreadStart+0x1d
0:001> ~0s

USER32!NtUserGetMessage+0xa:

00000000`76f9c92a c3              ret
0:000> k

Child-SP          RetAddr           Call Site

00000000`000af9e8 00000000`76f9c95e USER32!NtUserGetMessage+0xa

00000000`000af9f0 00000000`ff511064 USER32!GetMessageW+0x34

00000000`000afa20 00000000`ff51133c notepad!WinMain+0x182

00000000`000afaa0 00000000`76e7f56d notepad!DisplayNonGenuineDlgWorker+0x2da

00000000`000afb60 00000000`770b3281 kernel32!BaseThreadInitThunk+0xd

00000000`000afb90 00000000`00000000 ntdll!RtlUserThreadStart+0x1d
We then inspect the raw stack data to see any execution residue and find a few related function calls:
0:000> !teb

TEB at 000007fffffdd000

    ExceptionList:        0000000000000000

    StackBase:            0000000000290000

    StackLimit:           000000000027f000

    SubSystemTib:         0000000000000000

    FiberData:            0000000000001e00

    ArbitraryUserPointer: 0000000000000000

    Self:                 000007fffffdd000

    EnvironmentPointer:   0000000000000000

    ClientId:             0000000000000b74 . 0000000000000f44

    RpcHandle:            0000000000000000

    Tls Storage:          000007fffffdd058

    PEB Address:          000007fffffdf000

    LastErrorValue:       0

    LastStatusValue:      c0000034

    Count Owned Locks:    0

    HardErrorMode:        0
0:000> dps 000000000027f000 0000000000290000

[...]

00000000`0028e388  00000000`008bd8e0

00000000`0028e390  00000000`00000000

00000000`0028e398  00000000`00000001

00000000`0028e3a0  00000000`00000282

00000000`0028e3a8  00000000`76f966b2 USER32!SendMessageToUI+0x6a

00000000`0028e3b0  00000000`001406b0

00000000`0028e3b8  00000000`004000f8

00000000`0028e3c0  00000000`00000001

00000000`0028e3c8  00000001`800014b8 mhhooks64!CallWndProc+0×2d8

00000000`0028e3d0  00000000`00000000

00000000`0028e3d8  00000000`002f0664

00000000`0028e3e0  00000000`00000001

00000000`0028e3e8  00000000`76f96a72 USER32!ImeNotifyHandler+0xb4

00000000`0028e3f0  00000000`00000000

00000000`0028e3f8  00000000`004000f8

00000000`0028e400  00000000`00000001

00000000`0028e408  000007fe`ff1213b4 IMM32!CtfImmDispatchDefImeMessage+0×60

00000000`0028e410  00000000`00000000

00000000`0028e418  00000000`002f0664

00000000`0028e420  00000000`00000000

00000000`0028e428  00000000`002f0664

00000000`0028e430  00000000`008bd8e0

00000000`0028e438  00000000`76f96a06 USER32!ImeWndProcWorker+0×3af

00000000`0028e440  00000000`00000282

00000000`0028e448  00000000`00000000

00000000`0028e450  00000000`00000001

00000000`0028e458  00000000`004000f8

00000000`0028e460  00000000`00000000

00000000`0028e468  00000000`00000001

00000000`0028e470  00000000`00000000

00000000`0028e478  00000000`00000000

00000000`0028e480  00000000`00000000

00000000`0028e488  00000000`76f9a078 USER32!_fnDWORD+0×44

00000000`0028e490  00000000`00000000

[…]

00000000`0028f770  00000000`001406b0

00000000`0028f778  000007ff`fffdd000

00000000`0028f780  00000000`0028f8c8

00000000`0028f788  00000000`008bd8e0

00000000`0028f790  00000000`00000018

00000000`0028f798  00000000`76f885a0 USER32!DispatchHookW+0×2c

00000000`0028f7a0  000022b2`00000000

00000000`0028f7a8  00000000`00000001

00000000`0028f7b0  000007fe`ff2d2560 MSCTF!IMCLock::`vftable’

00000000`0028f7b8  00000000`00407c50

00000000`0028f7c0  00000000`000c0e51

00000000`0028f7c8  00000000`00000000

00000000`0028f7d0  00000000`00000000

00000000`0028f7d8  00000000`00000113

00000000`0028f7e0  00000000`00000113

00000000`0028f7e8  00000000`00000001

00000000`0028f7f0  00000000`00000000

00000000`0028f7f8  00000000`76f9c3df USER32!UserCallWinProcCheckWow+0×1cb

00000000`0028f800  00000000`ff510000 notepad!CFileDialogEvents_QueryInterface <PERF> (notepad+0×0)

00000000`0028f808  00000000`00000000

00000000`0028f810  00000000`00000000

00000000`0028f818  00000000`00000000

00000000`0028f820  00000000`00000000

00000000`0028f828  00000000`00000038

00000000`0028f830  00000000`00000000

00000000`0028f838  00000000`00000000

00000000`0028f840  00000000`00000000

00000000`0028f848  00000000`770cfdf5 ntdll!KiUserCallbackDispatcherContinue

00000000`0028f850  00000000`00000048

00000000`0028f858  00000000`00000001

00000000`0028f860  00000000`00000000

[…]
We also see a 3rd-party module in proximity having “hook” in its module name: mhhooks64. We disassemble its address to see yet another message hooking evidence:
0:000> .asm no_code_bytes

Assembly options: no_code_bytes
0:000> ub 00000001`800014b8

mhhooks64!CallWndProc+0×2ae:

00000001`8000148e imul    rcx,rcx,30h

00000001`80001492 lea     rdx,[mhhooks64!sendMessages (00000001`80021030)]

00000001`80001499 mov     dword ptr [rdx+rcx+28h],eax

00000001`8000149d mov     r9,qword ptr [rsp+50h]

00000001`800014a2 mov     r8,qword ptr [rsp+48h]

00000001`800014a7 mov     edx,dword ptr [rsp+40h]

00000001`800014ab mov     rcx,qword ptr [mhhooks64!hCallWndHook (00000001`80021028)]

00000001`800014b2 call    qword ptr [mhhooks64!_imp_CallNextHookEx (00000001`80017280)]
- Dmitry Vostokov @ DumpAnalysis.org + TraceAnalysis.org -
Posted in Crash Dump Analysis, Crash Dump Patterns, Debugging, Pattern Models, Software Behavior Patterns | No Comments »
Wednesday, June 16th, 2010
Adding AI. Analysis Improvement.
After reading earlier today Windows Internals pages about system audit an idea came to my mind in the evening to provide audit services for memory dump and software trace analysis. One mind is good but two are better, especially if the second is a pattern-driven AI. Here are possible problem scenarios:
Problem: You are not satisfied with a crash report.
Problem: Your critical issue is escalated to the VP level. Engineers analyze memory dumps and software traces. No definite conclusion so far. You want to be sure that nothing has been omitted from the analysis.
Problem: You analyze a system dump or a software trace. You need a second pair of eyes but don’t want to send your memory dump due to your company security policies.
Other scenarios (use cases) will be added as soon as I see the service fit to the realities of software technical support.
I plan to make this service operational in July - August, 2010. Prices to be announced soon.
- Dmitry Vostokov @ DumpAnalysis.org + TraceAnalysis.org -
Posted in .NET Debugging, Announcements, Common Mistakes, Complete Memory Dump Analysis, Crash Analysis Report Environment (CARE), Crash Dump Analysis, Crash Dump De-analysis, Crash Dump Patterns, Debugging, Escalation Engineering, Minidump Analysis, Software Behavior Patterns, Software Engineering, Software Technical Support, Software Trace Analysis, Software Troubleshooting Patterns, Tools, Trace Analysis Patterns | 1 Comment »
Sunday, May 30th, 2010
Finally, after careful consideration, I’ve come up with the topic that has been neglected so far but at the same time important for both camps (kernel space and user space, including managed space): complete memory dump and software trace analysis. I plan to publish the first webinar agenda early in July and deliver the webinar in August (the date should be finalized by mid July).
PS. Sailing memory spaces under an RGB flag 
- Dmitry Vostokov @ DumpAnalysis.org + TraceAnalysis.org -
Posted in Announcements, CDF Analysis Tips and Tricks, Crash Analysis Report Environment (CARE), Crash Dump Analysis, Crash Dump Patterns, Debugging, DumpAnalysis and TraceAnalysis Logos, Escalation Engineering, Software Behavior Patterns, Software Technical Support, Software Trace Analysis, Software Troubleshooting Patterns, Tools, Trace Analysis Patterns, Training and Seminars, WinDbg Scripts, WinDbg Tips and Tricks | 2 Comments »
Sunday, May 23rd, 2010
We continue our modeling of software behaviour with the ubiquitous Memory Leak (process heap) pattern. Instead of leaking small heap allocations that are easy to debug with user mode stack trace database our model program leaks large heap allocations:
// MemoryLeak-ProcessHeap

// Copyright (c) 2010 Dmitry Vostokov

// GNU GENERAL PUBLIC LICENSE

// http://www.gnu.org/licenses/gpl-3.0.txt
#include <windows.h>
int _tmain(int argc, _TCHAR* argv[])

{

 // create extra 25 heaps initially

 for (int i = 0; i < 25; ++i)

  HeapCreate(0, 0, 0);
 // create a heap to leak within

 HANDLE hHeap = HeapCreate(0, 0, 0);
 while (true)

 {

  HeapAlloc(hHeap, 0, 1024*1024);

  Sleep(1000);

 }
 return 0;

}
The program creates extra process heaps to simulate real life heap leaks that usually happen not in a default process heap. Then it slowly leaks 0×100000 bytes every second. The application can be downloaded from here (zip file contains source code, x86 and x64 binaries together with corresponding PDB files):
Download MemoryLeak-ProcessHeap.zip
Here I present the results from x64 Windows Server 2008 R2 but x86 variants (I tested on x86 Vista) should be the same.
First we run the application and save a dump of it after a few seconds (I used Task Manager). Heap statistics shows 9 virtual blocks for the last 0000000001e00000 heap:
0:000> !heap -s

LFH Key                   : 0x000000d529c37801

Termination on corruption : ENABLED

          Heap     Flags   Reserv  Commit  Virt   Free  List   UCR  Virt  Lock  Fast

                            (k)     (k)    (k)     (k) length      blocks cont. heap

————————————————————————————-

00000000002b0000 00000002    1024    164   1024      3     1     1    0      0   LFH

0000000000010000 00008000      64      4     64      1     1     1    0      0

0000000000020000 00008000      64     64     64     61     1     1    0      0

0000000000220000 00001002    1088    152   1088      3     2     2    0      0   LFH

0000000000630000 00001002     512      8    512      3     1     1    0      0

0000000000870000 00001002     512      8    512      3     1     1    0      0

0000000000ad0000 00001002     512      8    512      3     1     1    0      0

00000000007e0000 00001002     512      8    512      3     1     1    0      0

0000000000cc0000 00001002     512      8    512      3     1     1    0      0

0000000000ed0000 00001002     512      8    512      3     1     1    0      0

00000000010c0000 00001002     512      8    512      3     1     1    0      0

00000000005b0000 00001002     512      8    512      3     1     1    0      0

00000000009f0000 00001002     512      8    512      3     1     1    0      0

00000000004d0000 00001002     512      8    512      3     1     1    0      0

0000000000230000 00001002     512      8    512      3     1     1    0      0

0000000000700000 00001002     512      8    512      3     1     1    0      0

00000000012d0000 00001002     512      8    512      3     1     1    0      0

0000000000950000 00001002     512      8    512      3     1     1    0      0

0000000000b90000 00001002     512      8    512      3     1     1    0      0

00000000014c0000 00001002     512      8    512      3     1     1    0      0

0000000000e50000 00001002     512      8    512      3     1     1    0      0

0000000001020000 00001002     512      8    512      3     1     1    0      0

00000000016e0000 00001002     512      8    512      3     1     1    0      0

0000000001940000 00001002     512      8    512      3     1     1    0      0

0000000001b90000 00001002     512      8    512      3     1     1    0      0

0000000001200000 00001002     512      8    512      3     1     1    0      0

0000000000c20000 00001002     512      8    512      3     1     1    0      0

0000000000db0000 00001002     512      8    512      3     1     1    0      0

0000000000f50000 00001002     512      8    512      3     1     1    0      0

Virtual block: 0000000001350000 - 0000000001350000 (size 0000000000000000)

Virtual block: 0000000001540000 - 0000000001540000 (size 0000000000000000)

Virtual block: 0000000001760000 - 0000000001760000 (size 0000000000000000)

Virtual block: 00000000019c0000 - 00000000019c0000 (size 0000000000000000)

Virtual block: 0000000001c10000 - 0000000001c10000 (size 0000000000000000)

Virtual block: 0000000001e80000 - 0000000001e80000 (size 0000000000000000)

Virtual block: 0000000001f90000 - 0000000001f90000 (size 0000000000000000)

Virtual block: 00000000020a0000 - 00000000020a0000 (size 0000000000000000)

Virtual block: 00000000021b0000 - 00000000021b0000 (size 0000000000000000)

0000000001e00000 00001002     512      8    512      3     1     1    9      0

————————————————————————————-
We then wait for a few minutes and save a memory dump again. Heap statistics clearly shows virtual block leaks because now we 276 of them instead of previous 9 (I skipped most of them in the output below):
0:000> !heap -s

LFH Key                   : 0x000000d529c37801

Termination on corruption : ENABLED

          Heap     Flags   Reserv  Commit  Virt   Free  List   UCR  Virt  Lock  Fast

                            (k)     (k)    (k)     (k) length      blocks cont. heap

————————————————————————————-

00000000002b0000 00000002    1024    164   1024      3     1     1    0      0   LFH

0000000000010000 00008000      64      4     64      1     1     1    0      0

0000000000020000 00008000      64     64     64     61     1     1    0      0

0000000000220000 00001002    1088    152   1088      3     2     2    0      0   LFH

0000000000630000 00001002     512      8    512      3     1     1    0      0

0000000000870000 00001002     512      8    512      3     1     1    0      0

0000000000ad0000 00001002     512      8    512      3     1     1    0      0

00000000007e0000 00001002     512      8    512      3     1     1    0      0

0000000000cc0000 00001002     512      8    512      3     1     1    0      0

0000000000ed0000 00001002     512      8    512      3     1     1    0      0

00000000010c0000 00001002     512      8    512      3     1     1    0      0

00000000005b0000 00001002     512      8    512      3     1     1    0      0

00000000009f0000 00001002     512      8    512      3     1     1    0      0

00000000004d0000 00001002     512      8    512      3     1     1    0      0

0000000000230000 00001002     512      8    512      3     1     1    0      0

0000000000700000 00001002     512      8    512      3     1     1    0      0

00000000012d0000 00001002     512      8    512      3     1     1    0      0

0000000000950000 00001002     512      8    512      3     1     1    0      0

0000000000b90000 00001002     512      8    512      3     1     1    0      0

00000000014c0000 00001002     512      8    512      3     1     1    0      0

0000000000e50000 00001002     512      8    512      3     1     1    0      0

0000000001020000 00001002     512      8    512      3     1     1    0      0

00000000016e0000 00001002     512      8    512      3     1     1    0      0

0000000001940000 00001002     512      8    512      3     1     1    0      0

0000000001b90000 00001002     512      8    512      3     1     1    0      0

0000000001200000 00001002     512      8    512      3     1     1    0      0

0000000000c20000 00001002     512      8    512      3     1     1    0      0

0000000000db0000 00001002     512      8    512      3     1     1    0      0

0000000000f50000 00001002     512      8    512      3     1     1    0      0

Virtual block: 0000000001350000 - 0000000001350000 (size 0000000000000000)

Virtual block: 0000000001540000 - 0000000001540000 (size 0000000000000000)

Virtual block: 0000000001760000 - 0000000001760000 (size 0000000000000000)

Virtual block: 00000000019c0000 - 00000000019c0000 (size 0000000000000000)

[… skipped …]

Virtual block: 00000000131b0000 - 00000000131b0000 (size 0000000000000000)

Virtual block: 00000000132c0000 - 00000000132c0000 (size 0000000000000000)

Virtual block: 00000000133d0000 - 00000000133d0000 (size 0000000000000000)

Virtual block: 00000000134e0000 - 00000000134e0000 (size 0000000000000000)

Virtual block: 00000000135f0000 - 00000000135f0000 (size 0000000000000000)

Virtual block: 0000000013700000 - 0000000013700000 (size 0000000000000000)

Virtual block: 0000000013810000 - 0000000013810000 (size 0000000000000000)

Virtual block: 0000000013920000 - 0000000013920000 (size 0000000000000000)

Virtual block: 0000000013a30000 - 0000000013a30000 (size 0000000000000000)

Virtual block: 0000000013b40000 - 0000000013b40000 (size 0000000000000000)

Virtual block: 0000000013c50000 - 0000000013c50000 (size 0000000000000000)

Virtual block: 0000000013d60000 - 0000000013d60000 (size 0000000000000000)

0000000001e00000 00001002     512      8    512      3     1     1  276      0

————————————————————————————-
We see that size of these blocks is 0×101000 bytes (with hindsight, extra 1000 is probably bookkeeping info):
0:000> !address 0000000013d60000

 ProcessParametrs 00000000002b1f20 in range 00000000002b0000 00000000002d9000

 Environment 00000000002b1320 in range 00000000002b0000 00000000002d9000

    0000000013d60000 : 0000000013d60000 - 0000000000101000

                    Type     00020000 MEM_PRIVATE

                    Protect  00000004 PAGE_READWRITE

                    State    00001000 MEM_COMMIT

                    Usage    RegionUsageHeap

                    Handle   0000000001e00000
We want to know which thread allocates them and we search for the heap address 0000000001e00000 through virtual memory to find any execution residue on thread raw stacks:
0:000> s -q 0 LFFFFFF 0000000001e00000

00000000`001cf608  00000000`01e00000 00000000`01e00000

00000000`001cf610  00000000`01e00000 00000000`00000858

00000000`001cf630  00000000`01e00000 00000000`0000000a

00000000`001cf6c8  00000000`01e00000 00000000`00000000

00000000`001cf6e0  00000000`01e00000 00000000`01e00a80

00000000`001cf720  00000000`01e00000 00000000`00000020

00000000`001cf778  00000000`01e00000 00000000`01e00000

00000000`001cf780  00000000`01e00000 00000000`00000000

00000000`001cf798  00000000`01e00000 00000000`01e02000

00000000`001cf7b0  00000000`01e00000 02100301`00000000

00000000`001cf7c8  00000000`01e00000 00000000`01c10000

00000000`001cf808  00000000`01e00000 00000000`00000001

00000000`001cf830  00000000`01e00000 00000000`00000002

00000000`001cf940  00000000`01e00000 00000000`00000000

00000000`002d8378  00000000`01e00000 004c0044`005c0064

00000000`01e00028  00000000`01e00000 00000000`01e00000

00000000`01e00030  00000000`01e00000 00000000`00000080
Address range 00000000`001cfxxxx belongs to the main thread:
0:000> kL

Child-SP          RetAddr           Call Site

00000000`001cf898 000007fe`fdd91203 ntdll!NtDelayExecution+0xa

00000000`001cf8a0 00000001`3f39104f KERNELBASE!SleepEx+0xab

00000000`001cf940 00000001`3f3911ea MemoryLeak_ProcessHeap!wmain+0×4f

00000000`001cf970 00000000`778cf56d MemoryLeak_ProcessHeap!__tmainCRTStartup+0×15a

00000000`001cf9b0 00000000`77b03281 kernel32!BaseThreadInitThunk+0xd

00000000`001cf9e0 00000000`00000000 ntdll!RtlUserThreadStart+0×1d
We dump the raw stack fragment now:
0:000> dps 00000000`001cf608 00000000`001cf940

00000000`001cf608  00000000`01e00000

00000000`001cf610  00000000`01e00000

00000000`001cf618  00000000`00000858

00000000`001cf620  00000000`00000000

00000000`001cf628  00000000`77b229ac ntdll!RtlAllocateHeap+0×16c

00000000`001cf630  00000000`01e00000

00000000`001cf638  00000000`0000000a

00000000`001cf640  00000000`00000858

00000000`001cf648  00000000`00000860

00000000`001cf650  00000000`00000000

00000000`001cf658  00000000`001cf740

00000000`001cf660  00000020`00001000

00000000`001cf668  fffff680`01000000

00000000`001cf670  00000001`3f390000 MemoryLeak_ProcessHeap!wmain <PERF> (MemoryLeak_ProcessHeap+0×0)

00000000`001cf678  01000000`00000080

00000000`001cf680  00000000`0000f000

00000000`001cf688  02100210`02100210

00000000`001cf690  00000001`3f390000 MemoryLeak_ProcessHeap!wmain <PERF> (MemoryLeak_ProcessHeap+0×0)

00000000`001cf698  00000000`0000f000

00000000`001cf6a0  00000000`01e01fd0

00000000`001cf6a8  00000000`77b07ff3 ntdll!RtlpCreateUCREntry+0xb3

00000000`001cf6b0  00000000`001cf6b8

00000000`001cf6b8  00000000`01e01fc0

00000000`001cf6c0  00000000`00000080

00000000`001cf6c8  00000000`01e00000

00000000`001cf6d0  00000000`00000000

00000000`001cf6d8  00000000`00000a00

00000000`001cf6e0  00000000`01e00000

00000000`001cf6e8  00000000`01e00a80

00000000`001cf6f0  00000000`0007e000

00000000`001cf6f8  00000000`77b0f2bb ntdll!RtlpInitializeHeapSegment+0×19b

00000000`001cf700  00000000`01e00208

00000000`001cf708  00000000`00000000

00000000`001cf710  00000000`01e00230

00000000`001cf718  00000000`00000000

00000000`001cf720  00000000`01e00000

00000000`001cf728  00000000`00000020

00000000`001cf730  00000000`00000000

00000000`001cf738  00000000`77b0f676 ntdll!RtlpInitializeUCRIndex+0×36

00000000`001cf740  000007ff`00000003

00000000`001cf748  00000000`00000100

00000000`001cf750  00000000`00000000

00000000`001cf758  00000000`00001002

00000000`001cf760  00000000`00001002

00000000`001cf768  00000000`77b0fec9 ntdll!RtlCreateHeap+0×8f7

00000000`001cf770  00000000`01e02000

00000000`001cf778  00000000`01e00000

00000000`001cf780  00000000`01e00000

00000000`001cf788  00000000`00000000

00000000`001cf790  03010301`00000000

00000000`001cf798  00000000`01e00000

00000000`001cf7a0  00000000`01e02000

00000000`001cf7a8  00000000`01e80000

00000000`001cf7b0  00000000`01e00000

00000000`001cf7b8  02100301`00000000

00000000`001cf7c0  00000000`001f0000

00000000`001cf7c8  00000000`01e00000

00000000`001cf7d0  00000000`01c10000

00000000`001cf7d8  00000000`01e02000

00000000`001cf7e0  00000000`00270000

00000000`001cf7e8  03020302`00000230

00000000`001cf7f0  00000000`77be7288 ntdll!RtlpInterceptorRoutines

00000000`001cf7f8  00000000`00000000

00000000`001cf800  00000000`00100010

00000000`001cf808  00000000`01e00000

00000000`001cf810  00000000`00000001

00000000`001cf818  00000000`00100000

00000000`001cf820  00000000`00000000

00000000`001cf828  00000000`77b229ac ntdll!RtlAllocateHeap+0×16c

00000000`001cf830  00000000`01e00000

00000000`001cf838  00000000`00000002

00000000`001cf840  00000000`00100000

00000000`001cf848  00000000`00101000

00000000`001cf850  00000000`00000000

00000000`001cf858  00000000`001cf940

00000000`001cf860  00000000`00000000

00000000`001cf868  0000f577`2bd1e0ff

00000000`001cf870  00000000`ffffffff

00000000`001cf878  00000000`10010011

00000000`001cf880  00000000`c00000bb

00000000`001cf888  00000000`00000000

00000000`001cf890  00000000`00000100

00000000`001cf898  000007fe`fdd91203 KERNELBASE!SleepEx+0xab

00000000`001cf8a0  00000000`001cf958

00000000`001cf8a8  00000000`00000000

00000000`001cf8b0  00000000`00000000

00000000`001cf8b8  00000000`00000012

00000000`001cf8c0  ffffffff`ff676980

00000000`001cf8c8  00000000`001cf8c0

00000000`001cf8d0  00000000`00000048

00000000`001cf8d8  00000000`00000001

00000000`001cf8e0  00000000`00000000

00000000`001cf8e8  00000000`00000000

00000000`001cf8f0  00000000`00000000

00000000`001cf8f8  00000000`00000000

00000000`001cf900  00000000`00000000

00000000`001cf908  00000000`00000000

00000000`001cf910  00000000`00000000

00000000`001cf918  00000000`00000000

00000000`001cf920  00000000`00000000

00000000`001cf928  00000000`00000001

00000000`001cf930  00000000`00000000

00000000`001cf938  00000001`3f39104f MemoryLeak_ProcessHeap!wmain+0×4f

00000000`001cf940  00000000`01e00000
We see traces of RtlAllocateHeap but it could be a coincidence (imagine that we don’t have access to source code and can’t do live debugging to put breakpoints). We advise to enable use mode stack trace database as explained for another example process: CTX106970. Then we launch our application again and save a new user dump. We repeat the same procedure to examine the raw stack:
0:000> !heap -s

NtGlobalFlag enables following debugging aids for new heaps:

    stack back traces

LFH Key                   : 0x000000c21e1b31e6

Termination on corruption : ENABLED

          Heap     Flags   Reserv  Commit  Virt   Free  List   UCR  Virt  Lock  Fast

                            (k)     (k)    (k)     (k) length      blocks cont. heap

-------------------------------------------------------------------------------------

0000000001bc0000 08000002    1024    168   1024      5     1     1    0      0   LFH

0000000000010000 08008000      64      4     64      1     1     1    0      0

0000000000020000 08008000      64     64     64     61     1     1    0      0

0000000000100000 08001002    1088    152   1088      2     2     2    0      0   LFH

0000000001d90000 08001002     512      8    512      3     1     1    0      0

0000000001f90000 08001002     512      8    512      3     1     1    0      0

00000000021c0000 08001002     512      8    512      3     1     1    0      0

0000000002130000 08001002     512      8    512      3     1     1    0      0

0000000002370000 08001002     512      8    512      3     1     1    0      0

0000000001e80000 08001002     512      8    512      3     1     1    0      0

0000000000110000 08001002     512      8    512      3     1     1    0      0

0000000002510000 08001002     512      8    512      3     1     1    0      0

0000000002760000 08001002     512      8    512      3     1     1    0      0

0000000001cc0000 08001002     512      8    512      3     1     1    0      0

0000000002030000 08001002     512      8    512      3     1     1    0      0

0000000002960000 08001002     512      8    512      3     1     1    0      0

0000000002670000 08001002     512      8    512      3     1     1    0      0

0000000002b90000 08001002     512      8    512      3     1     1    0      0

00000000022f0000 08001002     512      8    512      3     1     1    0      0

00000000028b0000 08001002     512      8    512      3     1     1    0      0

0000000001f10000 08001002     512      8    512      3     1     1    0      0

0000000002450000 08001002     512      8    512      3     1     1    0      0

00000000025f0000 08001002     512      8    512      3     1     1    0      0

0000000002a40000 08001002     512      8    512      3     1     1    0      0

0000000002c90000 08001002     512      8    512      3     1     1    0      0

0000000002d90000 08001002     512      8    512      3     1     1    0      0

0000000002e80000 08001002     512      8    512      3     1     1    0      0

0000000002fc0000 08001002     512      8    512      3     1     1    0      0

00000000030b0000 08001002     512      8    512      3     1     1    0      0

Virtual block: 0000000003130000 - 0000000003130000 (size 0000000000000000)

Virtual block: 0000000003240000 - 0000000003240000 (size 0000000000000000)

Virtual block: 0000000003350000 - 0000000003350000 (size 0000000000000000)

Virtual block: 0000000003460000 - 0000000003460000 (size 0000000000000000)

Virtual block: 0000000003570000 - 0000000003570000 (size 0000000000000000)

Virtual block: 0000000003680000 - 0000000003680000 (size 0000000000000000)

Virtual block: 0000000003790000 - 0000000003790000 (size 0000000000000000)

Virtual block: 00000000038a0000 - 00000000038a0000 (size 0000000000000000)

Virtual block: 00000000039b0000 - 00000000039b0000 (size 0000000000000000)

Virtual block: 0000000003ac0000 - 0000000003ac0000 (size 0000000000000000)

Virtual block: 0000000003bd0000 - 0000000003bd0000 (size 0000000000000000)

Virtual block: 0000000003ce0000 - 0000000003ce0000 (size 0000000000000000)

0000000002270000 08001002     512      8    512      3     1     1   12      0
0:000> s -q 0 LFFFFFF 0000000002270000

00000000`0029f648  00000000`02270000 00000000`000000a8

00000000`0029f660  00000000`02270000 00000000`77b99bc7

00000000`0029f6e8  00000000`02270000 00000000`02270000

00000000`0029f6f0  00000000`02270000 00000000`00000858

00000000`0029f710  00000000`02270000 00000000`0000000a

00000000`0029f758  00000000`02270000 00000000`0029f918

00000000`0029f7c0  00000000`02270000 00000000`03ce0040

00000000`0029f858  00000000`02270000 00000000`02270000

00000000`0029f860  00000000`02270000 00000000`00000000

00000000`0029f878  00000000`02270000 00000000`02272000

00000000`0029f890  00000000`02270000 02100301`00000000

00000000`0029f8f8  00000000`02270000 00000000`03ce0040

00000000`0029fa20  00000000`02270000 00000000`00000000

00000000`01be8a08  00000000`02270000 0064006e`00690057

00000000`02270028  00000000`02270000 00000000`02270000

00000000`02270030  00000000`02270000 00000000`00000080
0:000> dqs 00000000`0029f648 00000000`0029fa20

00000000`0029f648  00000000`02270000

00000000`0029f650  00000000`000000a8

00000000`0029f658  00000000`00000a80

00000000`0029f660  00000000`02270000

00000000`0029f668  00000000`77b99bc7 ntdll!RtlStdLogStackTrace+0x47

00000000`0029f670  00000000`002a0000

00000000`0029f678  00000000`0000007e

00000000`0029f680  00000000`02270a80

00000000`0029f688  00000000`00000000

00000000`0029f690  00000000`02270208

00000000`0029f698  00070000`77b99bc7

00000000`0029f6a0  00000000`77b6cd8a ntdll! ?? ::FNODOBFM::`string'+0xf35a

00000000`0029f6a8  00000000`77b0fd07 ntdll!RtlCreateHeap+0x56e

00000000`0029f6b0  000007fe`fdd9c6a4 KERNELBASE!HeapCreate+0x54

00000000`0029f6b8  00000001`3faa1030 MemoryLeak_ProcessHeap!wmain+0x30

00000000`0029f6c0  00000001`3faa11ea MemoryLeak_ProcessHeap!__tmainCRTStartup+0x15a

00000000`0029f6c8  00000000`778cf56d kernel32!BaseThreadInitThunk+0xd

00000000`0029f6d0  00000000`77be7288 ntdll!RtlpInterceptorRoutines

00000000`0029f6d8  00000000`00000000

00000000`0029f6e0  00000000`00000860

00000000`0029f6e8  00000000`02270000

00000000`0029f6f0  00000000`02270000

00000000`0029f6f8  00000000`00000858

00000000`0029f700  00000000`00000000

00000000`0029f708  00000000`77b229ac ntdll!RtlAllocateHeap+0x16c

00000000`0029f710  00000000`02270000

00000000`0029f718  00000000`0000000a

00000000`0029f720  00000000`00000858

00000000`0029f728  00000000`00000860

00000000`0029f730  00000000`00000000

00000000`0029f738  00000000`0029f820

00000000`0029f740  00000000`77be7288 ntdll!RtlpInterceptorRoutines

00000000`0029f748  00000000`00000002

00000000`0029f750  00000000`00100030

00000000`0029f758  00000000`02270000

00000000`0029f760  00000000`0029f918

00000000`0029f768  00000000`00000020

00000000`0029f770  00000000`00000002

00000000`0029f778  00000000`00000005

00000000`0029f780  00000000`000750f0

00000000`0029f788  00000000`77ba25b2 ntdll!RtlpRegisterStackTrace+0x92

00000000`0029f790  00000000`000750b8

00000000`0029f798  00000000`00000003

00000000`0029f7a0  00000000`00000000

00000000`0029f7a8  00000000`77ad7a0a ntdll!RtlCaptureStackBackTrace+0x4a

00000000`0029f7b0  00000000`00000002

00000000`0029f7b8  00000000`00100030

00000000`0029f7c0  00000000`02270000

00000000`0029f7c8  00000000`03ce0040

00000000`0029f7d0  00000000`00100020

00000000`0029f7d8  00000000`77ba2eb7 ntdll!RtlpStackTraceDatabaseLogPrefix+0x57

00000000`0029f7e0  00000000`03ce0040

00000000`0029f7e8  00000000`00000000

00000000`0029f7f0  00000000`00100020

00000000`0029f7f8  00000000`000750f0

00000000`0029f800  00000000`77b6ed2d ntdll! ?? ::FNODOBFM::`string’+0×1a81b

00000000`0029f808  00000001`3faa1044 MemoryLeak_ProcessHeap!wmain+0×44

00000000`0029f810  00000001`3faa11ea MemoryLeak_ProcessHeap!__tmainCRTStartup+0×15a

00000000`0029f818  00000000`778cf56d kernel32!BaseThreadInitThunk+0xd

00000000`0029f820  00000000`77b03281 ntdll!RtlUserThreadStart+0×1d

00000000`0029f828  00000000`00000100

00000000`0029f830  00000000`00000000

00000000`0029f838  00000000`08001002

00000000`0029f840  00000000`08001002

00000000`0029f848  00000000`77b0fec9 ntdll!RtlCreateHeap+0×8f7

00000000`0029f850  00000000`02272000

00000000`0029f858  00000000`02270000

00000000`0029f860  00000000`02270000

00000000`0029f868  00000000`00000000

00000000`0029f870  03010301`00000000

00000000`0029f878  00000000`02270000

00000000`0029f880  00000000`02272000

00000000`0029f888  00000000`022f0000

00000000`0029f890  00000000`02270000

00000000`0029f898  02100301`00000000

00000000`0029f8a0  00000000`00001000

00000000`0029f8a8  00000000`77b9a886 ntdll!RtlpSetupExtendedBlock+0xc6

00000000`0029f8b0  00000000`00000000

00000000`0029f8b8  00000000`02272000

00000000`0029f8c0  00000000`000b0000

00000000`0029f8c8  03020302`00000230

00000000`0029f8d0  00000000`77be7288 ntdll!RtlpInterceptorRoutines

00000000`0029f8d8  00000000`00000002

00000000`0029f8e0  00000000`77be7288 ntdll!RtlpInterceptorRoutines

00000000`0029f8e8  00000000`00000002

00000000`0029f8f0  00000000`00100030

00000000`0029f8f8  00000000`02270000

00000000`0029f900  00000000`03ce0040

00000000`0029f908  00000000`77b6ed6a ntdll! ?? ::FNODOBFM::`string’+0×1a858

00000000`0029f910  00000000`00000000

00000000`0029f918  00000000`00000000

00000000`0029f920  00000000`00100000

00000000`0029f928  00000000`00101000

00000000`0029f930  00000000`00000020

00000000`0029f938  00000000`00000002

00000000`0029f940  00000000`00000000

00000000`0029f948  0000f569`df709780

00000000`0029f950  00000000`ffffffff

00000000`0029f958  00000000`12010013

00000000`0029f960  00000000`c00000bb

00000000`0029f968  00000000`00000000

00000000`0029f970  00000000`00000100

00000000`0029f978  000007fe`fdd91203 KERNELBASE!SleepEx+0xab

00000000`0029f980  00000000`0029fa38

00000000`0029f988  00000000`00000000

00000000`0029f990  00000000`00000000

00000000`0029f998  00000000`00000012

00000000`0029f9a0  ffffffff`ff676980

00000000`0029f9a8  00000000`0029f9a0

00000000`0029f9b0  00000000`00000048

00000000`0029f9b8  00000000`00000001

00000000`0029f9c0  00000000`00000000

00000000`0029f9c8  00000000`00000000

00000000`0029f9d0  00000000`00000000

00000000`0029f9d8  00000000`00000000

00000000`0029f9e0  00000000`00000000

00000000`0029f9e8  00000000`00000000

00000000`0029f9f0  00000000`00000000

00000000`0029f9f8  00000000`00000000

00000000`0029fa00  00000000`00000000

00000000`0029fa08  00000000`00000001

00000000`0029fa10  00000000`00000000

00000000`0029fa18  00000001`3faa104f MemoryLeak_ProcessHeap!wmain+0×4f

00000000`0029fa20  00000000`02270000
Now we see this stack trace fragment from user mode stack trace database on the raw stack shown above:
00000000`0029f800  00000000`77b6ed2d ntdll! ?? ::FNODOBFM::`string'+0x1a81b

00000000`0029f808  00000001`3faa1044MemoryLeak_ProcessHeap!wmain+0×44

00000000`0029f810  00000001`3faa11ea MemoryLeak_ProcessHeap!__tmainCRTStartup+0×15a

00000000`0029f818  00000000`778cf56d kernel32!BaseThreadInitThunk+0xd

00000000`0029f820  00000000`77b03281 ntdll!RtlUserThreadStart+0×1d
And it looks like HeapAlloc was called from wmain indeed with 0×100000 parameter:
0:000> ub 00000001`3faa1044

MemoryLeak_ProcessHeap!wmain+0x26:

00000001`3faa1026 xor     edx,edx

00000001`3faa1028 xor     ecx,ecx

00000001`3faa102a call    qword ptr [MemoryLeak_ProcessHeap!_imp_HeapCreate (00000001`3faa7000)]

00000001`3faa1030 mov     rbx,rax

00000001`3faa1033 xor     edx,edx

00000001`3faa1035 mov     r8d,100000h

00000001`3faa103b mov     rcx,rbx

00000001`3faa103e call    qword ptr [MemoryLeak_ProcessHeap!_imp_HeapAlloc (00000001`3faa7008)]
0:000> dps 00000001`3faa7008 L1

00000001`3faa7008  00000000`77b21b70 ntdll!RtlAllocateHeap
The stack trace fragment from x86 Vista user dump even more straightforward:
0040fa00 77946e0c ntdll!RtlAllocateHeap+0×1e3

0040fa04 0022103a MemoryLeak_ProcessHeap!wmain+0×3a

0040fa08 7677d0e9 kernel32!BaseThreadInitThunk+0xe

0040fa0c 779219bb ntdll!__RtlUserThreadStart+0×23

0040fa10 7792198e ntdll!_RtlUserThreadStart+0×1b

0040fa14 7798924f ntdll!RtlpLogCapturedStackTrace+0×103
Of course, we could simply disassemble wmain after identifying our thread but in real life functions are longer and leaking allocations could have happened from frames not present on current stack traces.
- Dmitry Vostokov @ DumpAnalysis.org + TraceAnalysis.org -
Posted in Crash Dump Analysis, Crash Dump Patterns, Debugging, Pattern Models, Software Behavior Patterns, Software Defect Construction | No Comments »
Friday, May 21st, 2010
In this part I would like to introduce the notion of Forgotten Facts in opposition to Basic Facts or supporting information. These are facts that engineers often feel uncomfortable to mention because they are troubleshooting information they couldn’t obtain (if they tried) due to some time or customer pressures, failures, incorrectly understood troubleshooting procedures or some other obstacles. Therefore it is important to have a set of counter questions or checklists mapped from common software behaviour patterns to software troubleshooting patterns. Problem descriptions should also be subjected to close reading to reveal unconsciously concealed information. Next part will explore this in more detail with some case studies commissioned by Software Maintenance Institute.
- Dmitry Vostokov @ DumpAnalysis.org + TraceAnalysis.org -
Posted in Crash Dump Analysis, Debugging, Escalation Engineering, Psychoanalysis of Software Maintenance and Support, Psychology, Software Behavior Patterns, Software Maintenance Institute, Software Technical Support, Software Trace Analysis, Software Trace Reading, Software Troubleshooting Patterns | 1 Comment »
Sunday, May 16th, 2010
Due to many requests for memory dumps corresponding to crash dump analysis patterns I’ve started modeling software behaviour and defects. Every pattern will have an example application(s), service(s) or driver(s) or combination of them. Their execution results in memory layout that corresponds to memory or trace analysis patterns. Today we introduce an example model for Multiple Exceptions (user mode) pattern. The following source code models 3 threads each having an exception during their execution on Windows XP, Windows 7 and Windows Server 2008 R2:
// MultipleExceptions-UserMode

// Copyright (c) 2010 Dmitry Vostokov

// GNU GENERAL PUBLIC LICENSE

// http://www.gnu.org/licenses/gpl-3.0.txt
#include <windows.h>

#include <process.h>
void thread_one(void *)

{

 *(int *)NULL = 0;

}
void thread_two(void *)

{

 *(int *)NULL = 0;

}
int main(int argc, WCHAR* argv[])

{

 _beginthread(thread_two, 0, NULL);

 _beginthread(thread_one, 0, NULL);
DebugBreak();
 return 0;

}
In fact, thread_one and thread_two can be replaced with just one function because they are identical. Visual C++ compiler does that during code optimization. On Windows 7 and W2K8 R2 I created LocalDumps registry key to save full crash dumps. On Windows XP I set Dr. Watson as a postmortem debugger (via drwtsn32 -i command and configured it to save full user dumps via drwtsn32 command that brings Dr. Watson GUI). Vista had some peculiar behaviour so I postponed its discussion for another post. The application can be downloaded from here (zip file contains source code, x86 and x64 binaries together with corresponding PDB files):
Download MultipleExceptions-UserMode.zip
Now I provide modeling results for x64 W2K8 R2 running on 2 processor machine. Windows 7 and Windows XP results are very similar. If we run x64 executable it crashes and a dump file is saved (x86 crash dump is similar). Default analysis command gives these results:
0:000> !analyze -v
[...]
FAULTING_IP:

MultipleExceptions_UserMode!thread_two+0

00000001`3f8b1000 c704250000000000000000 mov dword ptr [0],0
EXCEPTION_RECORD:  ffffffffffffffff -- (.exr 0xffffffffffffffff)

ExceptionAddress: 000007fefddc2442 (KERNELBASE!DebugBreak+0x0000000000000002)

   ExceptionCode: 80000003 (Break instruction exception)

  ExceptionFlags: 00000000

NumberParameters: 1

   Parameter[0]: 0000000000000000
[...]
ERROR_CODE: (NTSTATUS) 0x80000003 - {EXCEPTION} Breakpoint A breakpoint has been reached.
[...]
PRIMARY_PROBLEM_CLASS: STATUS_BREAKPOINT
[...]
STACK_TEXT:

00000001`3f8b1000 MultipleExceptions_UserMode!thread_two+0x0

00000001`3f8b10eb MultipleExceptions_UserMode!_callthreadstart+0x17

00000001`3f8b1195 MultipleExceptions_UserMode!_threadstart+0x95

00000000`778cf56d kernel32!BaseThreadInitThunk+0xd

00000000`77b03281 ntdll!RtlUserThreadStart+0x1d
[...]
We see debug break on the first thread:
0:000> kL

Child-SP          RetAddr           Call Site

00000000`002eec78 000007fe`fdd913a6 ntdll!NtWaitForMultipleObjects+0xa

00000000`002eec80 00000000`778d3143 KERNELBASE!WaitForMultipleObjectsEx+0xe8

00000000`002eed80 00000000`77949025 kernel32!WaitForMultipleObjectsExImplementation+0xb3

00000000`002eee10 00000000`779491a7 kernel32!WerpReportFaultInternal+0x215

00000000`002eeeb0 00000000`779491ff kernel32!WerpReportFault+0x77

00000000`002eeee0 00000000`7794941c kernel32!BasepReportFault+0x1f

00000000`002eef10 00000000`77b6573c kernel32!UnhandledExceptionFilter+0x1fc

00000000`002eeff0 00000000`77ae5148 ntdll! ?? ::FNODOBFM::`string'+0x2365

00000000`002ef020 00000000`77b0554d ntdll!_C_specific_handler+0x8c

00000000`002ef090 00000000`77ae5d1c ntdll!RtlpExecuteHandlerForException+0xd

00000000`002ef0c0 00000000`77b1fe48 ntdll!RtlDispatchException+0x3cb

00000000`002ef7a0 000007fe`fddc2442 ntdll!KiUserExceptionDispatcher+0x2e

00000000`002efd58 00000001`3f8b103c KERNELBASE!DebugBreak+0×2

00000000`002efd60 00000001`3f8b13fb MultipleExceptions_UserMode!main+0×2c

00000000`002efd90 00000000`778cf56d MultipleExceptions_UserMode!__tmainCRTStartup+0×15b

00000000`002efdd0 00000000`77b03281 kernel32!BaseThreadInitThunk+0xd

00000000`002efe00 00000000`00000000 ntdll!RtlUserThreadStart+0×1d
2 other threads show exception processing too:
0:000> ~1s; kL

ntdll!NtDelayExecution+0xa:

00000000`77b201fa c3              ret

Child-SP          RetAddr           Call Site

00000000`0076ef78 000007fe`fdd91203 ntdll!NtDelayExecution+0xa

00000000`0076ef80 00000000`77949175 KERNELBASE!SleepEx+0xab

00000000`0076f020 00000000`779491ff kernel32!WerpReportFault+0×45

00000000`0076f050 00000000`7794941c kernel32!BasepReportFault+0×1f

00000000`0076f080 00000000`77b6573c kernel32!UnhandledExceptionFilter+0×1fc

00000000`0076f160 00000000`77ae5148 ntdll! ?? ::FNODOBFM::`string’+0×2365

00000000`0076f190 00000000`77b0554d ntdll!_C_specific_handler+0×8c

00000000`0076f200 00000000`77ae5d1c ntdll!RtlpExecuteHandlerForException+0xd

00000000`0076f230 00000000`77b1fe48 ntdll!RtlDispatchException+0×3cb

00000000`0076f910 00000001`3f8b1000 ntdll!KiUserExceptionDispatcher+0×2e

00000000`0076fec8 00000001`3f8b10eb MultipleExceptions_UserMode!thread_two

00000000`0076fed0 00000001`3f8b1195 MultipleExceptions_UserMode!_callthreadstart+0×17

00000000`0076ff00 00000000`778cf56d MultipleExceptions_UserMode!_threadstart+0×95

00000000`0076ff30 00000000`77b03281 kernel32!BaseThreadInitThunk+0xd

00000000`0076ff60 00000000`00000000 ntdll!RtlUserThreadStart+0×1d
0:001> ~2s; kL

ntdll!NtDelayExecution+0xa:

00000000`77b201fa c3              ret

Child-SP          RetAddr           Call Site

00000000`0086e968 000007fe`fdd91203 ntdll!NtDelayExecution+0xa

00000000`0086e970 00000000`77949175 KERNELBASE!SleepEx+0xab

00000000`0086ea10 00000000`779491ff kernel32!WerpReportFault+0×45

00000000`0086ea40 00000000`7794941c kernel32!BasepReportFault+0×1f

00000000`0086ea70 00000000`77b6573c kernel32!UnhandledExceptionFilter+0×1fc

00000000`0086eb50 00000000`77ae5148 ntdll! ?? ::FNODOBFM::`string’+0×2365

00000000`0086eb80 00000000`77b0554d ntdll!_C_specific_handler+0×8c

00000000`0086ebf0 00000000`77ae5d1c ntdll!RtlpExecuteHandlerForException+0xd

00000000`0086ec20 00000000`77b1fe48 ntdll!RtlDispatchException+0×3cb

00000000`0086f300 00000001`3f8b1000 ntdll!KiUserExceptionDispatcher+0×2e

00000000`0086f8b8 00000001`3f8b10eb MultipleExceptions_UserMode!thread_two

00000000`0086f8c0 00000001`3f8b1195 MultipleExceptions_UserMode!_callthreadstart+0×17

00000000`0086f8f0 00000000`778cf56d MultipleExceptions_UserMode!_threadstart+0×95

00000000`0086f920 00000000`77b03281 kernel32!BaseThreadInitThunk+0xd

00000000`0086f950 00000000`00000000 ntdll!RtlUserThreadStart+0×1d
We look at unhandled exception filter parameter to get exception pointers information:
0:002> kv

Child-SP          RetAddr           : Args to Child                                                           : Call Site

[...]

00000000`0086ea70 00000000`77b6573c : 00000000`0086ebb0 00000000`00000006 00000001`00000000 00000000`00000001 : kernel32!UnhandledExceptionFilter+0×1fc
0:002> .exptr 00000000`0086ebb0
----- Exception record at 00000000`0086f7f0:

ExceptionAddress: 000000013f8b1000 (MultipleExceptions_UserMode!thread_two)

   ExceptionCode: c0000005 (Access violation)

  ExceptionFlags: 00000000

NumberParameters: 2

   Parameter[0]: 0000000000000001

   Parameter[1]: 0000000000000000

Attempt to write to address 0000000000000000
----- Context record at 00000000`0086f300:

rax=00000000000ef0b0 rbx=00000000000ef0b0 rcx=0000000000000000

rdx=0000000000000000 rsi=0000000000000000 rdi=0000000000000000

rip=000000013f8b1000 rsp=000000000086f8b8 rbp=0000000000000000

 r8=000007fffffda000  r9=0000000000000000 r10=0000000000000045

r11=000007fffffd9328 r12=0000000000000000 r13=0000000000000000

r14=0000000000000000 r15=0000000000000000

iopl=0         nv up ei pl nz na pe nc

cs=0033  ss=002b  ds=002b  es=002b  fs=0053  gs=002b             efl=00010202

MultipleExceptions_UserMode!thread_two:

00000001`3f8b1000 c704250000000000000000 mov dword ptr [0],0 ds:00000000`00000000=????????
What we now see that default analysis command showed the break instruction exception record and error code from the first thread but IP and stack trace from other threads having NULL pointer access violation exception.
- Dmitry Vostokov @ DumpAnalysis.org + TraceAnalysis.org -
Posted in Crash Dump Analysis, Crash Dump Patterns, Debugging, Pattern Models, Software Behavior Patterns, Software Defect Construction | No Comments »
Monday, May 10th, 2010
My drive to generalization led me to place an adornment on the portal to highlight the fact that memory and software trace analysis patterns are under an umbrella of general software behaviour patterns:
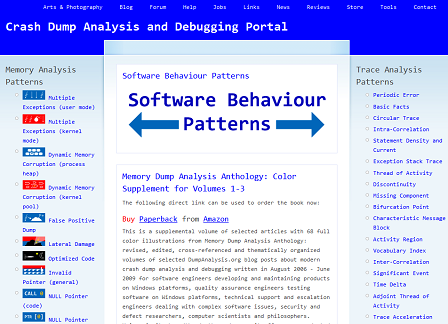
http://www.dumpanalysis.org/Software-Behavior-Patterns-Headline
In the forthcoming post series I plan to write about similarities between these two branches and also provide pattern examples from non-Windows platforms. All this material will provide the foundation for the forthcoming book Software Behavior: A Guide to Systematic Analysis (ISBN: 978-1906717162).
- Dmitry Vostokov @ DumpAnalysis.org + TraceAnalysis.org -
Posted in Announcements, Computer Science, Crash Dump Analysis, Crash Dump Patterns, Debugging, Escalation Engineering, Memiotics (Memory Semiotics), Memoretics, Science of Memory Dump Analysis, Science of Software Tracing, Software Behavior Patterns, Software Engineering, Software Maintenance Institute, Software Technical Support, Software Trace Analysis, Software Troubleshooting Patterns, Trace Analysis Patterns | No Comments »
Thursday, April 22nd, 2010
I’ve decided to adapt archaeological classificatory framework (using my favourite method of inquiry: metaphorical bijectionism) to lay out foundations for yet another attempt to classify DA+TA patterns):
Attribute  ↔ Pattern

Artefact   ↔ Component Artefact1

Assemblage ↔ Component Assemblage

Culture    ↔ Memory System Culture
2

1 Can be either a component-generated artefact or a component like a module or symbol file
2 Typical examples of memory system cultures are Windows, UNIX or even “Multiplatform”
I propose a word Memoarchaeological for such a framework and Memoarchaeology for a branch of Memoretics that studies saved computer memory artifacts from past computations (as opposed to live memory).
Note: In one of the forthcoming issues of Debugged! MZ/PE magazine there will be presented yet another classificatory scheme.
- Dmitry Vostokov @ DumpAnalysis.org + TraceAnalysis.org -
Posted in Announcements, Archaeology of Computer Memory, CDA Pattern Classification, Crash Dump Analysis, Crash Dump Patterns, Debugging, Memoretics, Memory Analysis Forensics and Intelligence, New Words, Science of Memory Dump Analysis, Science of Software Tracing, Software Behavior Patterns, Software Trace Analysis, Trace Analysis Patterns | No Comments »