Graphical Notation for Memory Dumps (Part 1)
Inspired by Penrose tensor notation encountered in The Road to Reality book and Feynman diagrams I’d like to introduce Visual Dump Objects (VDO) graphical notation to depict and communicate memory dump analysis patterns, their combinations and analysis results. Let’s look at some basic visual objects (shown in handwriting).
1. A thread:
 or
or 
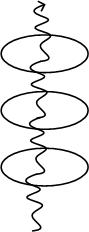
2. A function:

3. A module:

4. A thread running through functions, modules or both (stack trace). Optional arrowhead can indicate stack trace direction:
 or
or 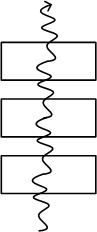 or
or 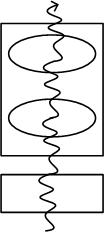
Threads running through modules depict collapsed stack traces.
5. A blocked thread:

An example of 3 threads blocked by another thread (an arrowhead can disambiguate the direction of the waiting chain):
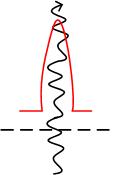
6. A spiking thread (colors are encouraged in VDO notation):
 or
or 
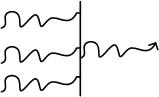
7. Space boundary between user land and kernel land:

Here is an example of the thread spiking in kernel space:
or with modules from stack trace:
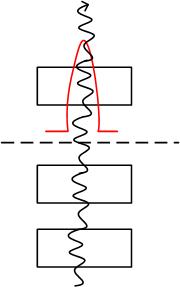
More notation to come very soon.
- Dmitry Vostokov @ DumpAnalysis.org -
May 24th, 2009 at 11:49 am
Прикольные червячки получились
May 24th, 2009 at 7:14 pm
Thanks! English translation of the previous comment: funny worms
Google translation from Russian is very funny too: Funny edge of one’s appetite was reached
October 7th, 2010 at 1:15 pm
[…] notation for memory (dump) and software trace analysis pattern languages (in addition to graphical notation proposed earlier). It should be simple and concise: allow easy grammar with plain syntax and […]