Archive for the ‘Software Behavior Patterns’ Category
Friday, November 11th, 2011
One of the new initiatives for 2012 is the development of SPDL (Software Problem Description Language). Its purpose is automatic generation of a software troubleshooting tool(s) based on the description of a problem. Here software problem means a post-construction problem as outlined in Introduction to Pattern-Driven Software Problem Solving. The tool construction will utilize an expanded set of DebugWare and Workaround patterns together with the refind version of RADII software development process. This will also provide necessary effectiveness, efficiency and enhanced problem solving capabilities to existing TaaS (Tools as a Service) implementations that are limited in the number of tools they offer.
- Dmitry Vostokov @ DumpAnalysis.org + TraceAnalysis.org -
Posted in Announcements, Computer Science, Crash Dump Analysis, DebugWare Patterns, Debugging, Generative Debugging, New Acronyms, New Debugging School, SPDL, Software Behavior DNA, Software Behavior Patterns, Software Behavioral Genome, Software Engineering, Software Problem Solving, Software Technical Support, Software Trace Analysis, Software Troubleshooting Patterns, Software and Modeling, TaaS, Testing, Tool Objects, Tools, Troubleshooting Methodology, Unified Debugging Patterns, Windows System Administration | No Comments »
Thursday, November 3rd, 2011
The new 6th volume contains revised, edited, cross-referenced, and thematically organized selected DumpAnalysis.org blog posts about memory dump and software trace analysis, software troubleshooting and debugging written in November 2010 - October 2011 for software engineers developing and maintaining products on Windows platforms, quality assurance engineers testing software on Windows platforms, technical support and escalation engineers dealing with complex software issues, and security researchers, malware analysts and reverse engineers. The sixth volume features:
- 56 new crash dump analysis patterns including 14 new .NET memory dump analysis patterns
- 4 new pattern interaction case studies
- 11 new trace analysis patterns
- New Debugware pattern
- Introduction to UI problem analysis patterns
- Introduction to intelligence analysis patterns
- Introduction to unified debugging pattern language
- Introduction to generative debugging, metadefect template library and DNA of software behaviour
- The new school of debugging and trends
- .NET memory dump analysis checklist
- Software trace analysis checklist
- Introduction to close and deconstructive readings of a software trace
- Memory dump analysis compass
- Computical and Stack Trace Art
- The abductive reasoning of Philip Marlowe
- Orbifold memory space and cloud computing
- Memory worldview
- Interpretation of cyberspace
- Relationship of memory dumps to religion
- Fully cross-referenced with Volume 1, Volume 2, Volume 3, Volume 4, and Volume 5
Product information:
- Title: Memory Dump Analysis Anthology, Volume 6
- Author: Dmitry Vostokov
- Language: English
- Product Dimensions: 22.86 x 15.24
- Paperback: 300 pages
- Publisher: Opentask (December 2011)
- ISBN-13: 978-1-908043-19-1
- Hardcover: 300 pages
- Publisher: Opentask (January 2012)
- ISBN-13: 978-1-908043-20-7

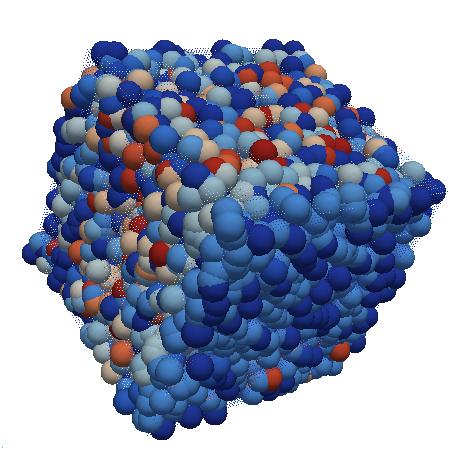
Back cover features 3d memory space visualization image created with ParaView.
- Dmitry Vostokov @ DumpAnalysis.org + TraceAnalysis.org -
Posted in .NET Debugging, Announcements, Art, Books, Cloud Computing, Cloud Memory Dump Analysis, Common Mistakes, Complete Memory Dump Analysis, Computer Science, Computicart (Computical Art), Crash Dump Analysis, Crash Dump Patterns, Cyber Intelligence, Cyber Problems, Cyber Security, Cyber Space, Cyber Warfare, DebugWare Patterns, Debugging, Debugging Industry, Debugging Methodology, Debugging Slang, Debugging Trends, Escalation Engineering, Generative Debugging, Intelligence Analysis Patterns, Kernel Development, Memoidealism, Memoretics, Memory Visualization, Metadefect Template Library, New Debugging School, Philosophy, Physicalist Art, Publishing, Root Cause Analysis, Science of Memory Dump Analysis, Science of Software Tracing, Security, Software Behavior DNA, Software Behavior Patterns, Software Behavioral Genome, Software Engineering, Software Narratology, Software Technical Support, Software Trace Analysis, Software Trace Deconstruction, Software Trace Reading, Software Victimology, Testing, The Way of Philip Marlowe, Tools, Trace Analysis Patterns, Training and Seminars, Troubleshooting Methodology, UI Problem Analysis Patterns, Unified Debugging Patterns, Victimware, WinDbg Tips and Tricks, Windows 7, Windows Azure, Windows Data Structures, Windows Server 2008, Windows System Administration, x64 Windows | No Comments »
Wednesday, September 21st, 2011
Memoretics promotes pattern-driven memory dump and software trace analysis which has many uses but not limited to:
- Software and site reliability
- Software Debugging
- QA and Software Testing
- Computer Security
- Software Troubleshooting
- Malware Research and Analysis
- Tools as a Service (TaaS)
- Supportability
- Software Diagnostics

- Dmitry Vostokov @ DumpAnalysis.org + TraceAnalysis.org -
Posted in Cloud Memory Dump Analysis, Computer Forensics, Crash Dump Analysis, Crash Dump Patterns, DebugWare Patterns, Debugging, Debugging Trends, Escalation Engineering, Malware Analysis, Malware Patterns, Memiotics (Memory Semiotics), Memoretics, Memory Analysis Forensics and Intelligence, Metadefect Template Library, Metamalware, Pattern Models, Pattern Prediction, Reverse Engineering, Root Cause Analysis, Science of Memory Dump Analysis, Science of Software Tracing, Security, Software Behavior DNA, Software Behavior Patterns, Software Behavioral Genome, Software Defect Construction, Software Engineering, Software Generalist, Software Narratology, Software Support Patterns, Software Technical Support, Software Trace Analysis, Software Troubleshooting Patterns, Structural Memory Patterns, Structural Trace Patterns, Systems Thinking, Testing, Tools, Trace Analysis Patterns, Troubleshooting Methodology, UI Problem Analysis Patterns, Unified Debugging Patterns, Victimware, Windows System Administration, Workaround Patterns | No Comments »
Wednesday, September 21st, 2011
Memoretics as a science of memory snapshots borrows many ideas from the following disciplines (the list is not exhaustive):
- Troubleshooting and Debugging
- Intelligence Analysis
- Critical Thinking
- Forensics
- Linguistics
- Archaeology
- Psychoanalysis
- History
- Mathematics: Sets and Categories
- Literary Criticism and Narratology
It also contributes many ideas back. The following diagram depicts such an interaction:

- Dmitry Vostokov @ DumpAnalysis.org + TraceAnalysis.org -
Posted in Archaeology of Computer Memory, Categorical Debugging, Computer Forensics, Computer Science, Countefactual Debugging, Crash Dump Analysis, Crash Dump De-analysis, Crash Dump Patterns, Debugging, Debugging Methodology, Dublin School of Security, Education and Research, Escalation Engineering, General Memory Analysis, Generative Debugging, Hermeneutics of Memory Dumps and Traces, History, Intelligence Analysis Patterns, M->analysis, Malware Analysis, Malware Patterns, Mathematics of Debugging, Memiotics (Memory Semiotics), Memoretics, Memory Analysis Forensics and Intelligence, Memory Dump Analysis and History, Memory Systems Language, Memory Visualization, Metadefect Template Library, Metamalware, New Debugging School, Paleo-debugging, Pattern Models, Pattern Prediction, Psychoanalysis of Software Maintenance and Support, Psychology, Reverse Engineering, Root Cause Analysis, Science of Memory Dump Analysis, Science of Software Tracing, Security, Software Architecture, Software Behavior DNA, Software Behavior Patterns, Software Behavioral Genome, Software Chorography, Software Chorology, Software Defect Construction, Software Engineering, Software Narratology, Software Technical Support, Software Trace Analysis, Software Trace Analysis and History, Software Trace Deconstruction, Software Trace Linguistics, Software Trace Reading, Software Trace Visualization, Software Tracing Implementation Patterns, Software Troubleshooting Patterns, Software Victimology, Software and History, Structural Memory Analysis and Social Sciences, Structural Memory Patterns, Structural Trace Patterns, Systems Thinking, Testing, Tools, Trace Analysis Patterns, Troubleshooting Methodology, UI Problem Analysis Patterns, Unified Debugging Patterns, Victimware, Virtualization, Visual Dump Analysis, Workaround Patterns | No Comments »
Saturday, September 17th, 2011
Whereas DNA of a ruptured computation is a coarse grained, software behavioral genome in general is fine grained consisting of multiple behavioral patterns such as seen in memory dumps and software traces. I will elaborate more on it later especially in relation to software behavior profiles. Here’s a nice “memory DNA” metaphorical picture from 3D memory visualization post:
- Dmitry Vostokov @ DumpAnalysis.org + TraceAnalysis.org -
Posted in Announcements, Crash Dump Patterns, Memory Visualization, Software Behavior DNA, Software Behavior Patterns, Software Behavioral Genome, Trace Analysis Patterns | No Comments »
Thursday, July 14th, 2011
As a part of unified debugging pattern and generative debugging approach we extend software behavior analysis patterns such as memory dump and software trace analysis with UI abnormal behaviour patterns. Here by abnormality we mean behavior that users should not encounter while using software. Typical example is some error message or GUI distortion during execution of a functional use case. Such patterns will extend software behavior analysis pattern language we use for description of various post-construction software problems.
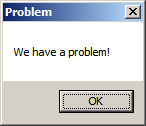
The first pattern we start with is called Error Message Box and we link it to Message Box and Self-Diagnosis memory analysis patterns. You can download x86 and x64 modeling examples from this location:
UIPMessageBox.zip
When we start the application it shows a message box:
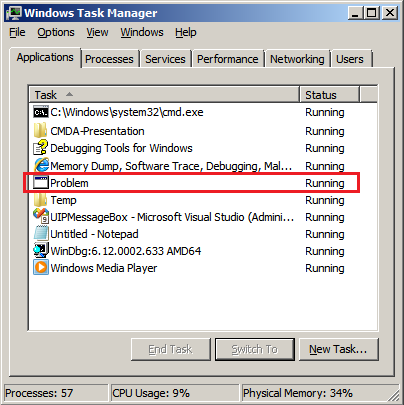
We then launch Task Manager and find the window:
Then we save a crash dump using right-click context menu:
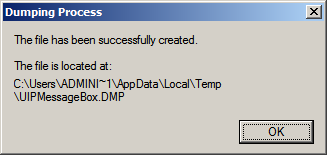
When we open the process memory dump we see this stack trace:
0:000> ~*kL
.  0  Id: d30.71c Suspend: 0 Teb: 000007ff`fffdd000 Unfrozen

Child-SP          RetAddr           Call Site

00000000`002ff1e8 00000000`77837214 user32!ZwUserWaitMessage+0xa

00000000`002ff1f0 00000000`778374a5 user32!DialogBox2+0x274

00000000`002ff280 00000000`778827f0 user32!InternalDialogBox+0x135

00000000`002ff2e0 00000000`77881ae5 user32!SoftModalMessageBox+0x9b4

00000000`002ff410 00000000`7788133b user32!MessageBoxWorker+0x31d

00000000`002ff5d0 00000000`77881232 user32!MessageBoxTimeoutW+0xb3

00000000`002ff6a0 00000001`3ffa101d user32!MessageBoxW+0×4e

00000000`002ff6e0 00000001`3ffa1039 UIPMessageBox!bar+0×1d

00000000`002ff710 00000001`3ffa1052 UIPMessageBox!foo+0×9

00000000`002ff740 00000001`3ffa11ea UIPMessageBox!wmain+0×12

00000000`002ff770 00000000`7770f56d UIPMessageBox!__tmainCRTStartup+0×15a

00000000`002ff7b0 00000000`77942cc1 kernel32!BaseThreadInitThunk+0xd

00000000`002ff7e0 00000000`00000000 ntdll!RtlUserThreadStart+0×1d
We see there that foo function called bar function which displayed the message box. In real scenarios function name could me more meaningful and give a clue for troubleshooting and debugging in addition to message text:
0:000> ub 00000001`3ffa101d

UIPMessageBox!__unguarded_readlc_active+0xfff:

00000001`3ffa0fff add     byte ptr [rax-7Dh],cl

00000001`3ffa1002 in      al,dx

00000001`3ffa1003 sub     byte ptr [rbp+33h],al

00000001`3ffa1006 leave

00000001`3ffa1007 lea     r8,[UIPMessageBox!__mnames+0×28 (00000001`3ffa83c8)]

00000001`3ffa100e lea     rdx,[UIPMessageBox!__mnames+0×38 (00000001`3ffa83d8)]

00000001`3ffa1015 xor     ecx,ecx

00000001`3ffa1017 call    qword ptr [UIPMessageBox!_imp_MessageBoxW (00000001`3ffa71d8)]
0:000> du 00000001`3ffa83c8

00000001`3ffa83c8  “Problem”
0:000> du 00000001`3ffa83d8

00000001`3ffa83d8  “We have a problem!”
- Dmitry Vostokov @ DumpAnalysis.org + TraceAnalysis.org -
Posted in Announcements, Crash Dump Analysis, Crash Dump Patterns, Debugging, Generative Debugging, Pattern Models, Software Behavior Patterns, UI Problem Analysis Patterns, Unified Debugging Patterns, x64 Windows | No Comments »
Sunday, May 15th, 2011
Presentation Software Trace and Memory Dump Analysis: Patterns, Tools, Processes and Best Practices from E2E Virtualization Conference (13th of May, 2011) is available for download:
http://www.dumpanalysis.com/STMDA-materials
- Dmitry Vostokov @ DumpAnalysis.org + TraceAnalysis.org -
Posted in Announcements, Debugging, Debugging Methodology, Escalation Engineering, Presentations, Root Cause Analysis, Software Behavior Patterns, Software Technical Support, Software Trace Analysis, Software Trace Reading, Tools, Trace Analysis Patterns, Training and Seminars, Troubleshooting Methodology | No Comments »
Sunday, May 1st, 2011
To model software behavior at application and system levels, test generative debugging scenarious and construct software defects using metaprogramming I started working on MdTL (Metadefect Template Library). Its consists of C++ templates for structural and behavioral patterns. The simplest examples include Threads<Spike> and Spike<Thread>. The template classes can be more complex, of course, utilizing the full power of C++, STL, and existing libraries like Boost. The unique and novel feature of this library is the inclusion of dual classes of behaviour such as Leak<>, Deadlock<>, Overflow<>, Residue<>, Exception<>, Contention<>, etc. parameterized by various structural memory classes like Process<>, Thread<>, Heap<>, Stack<>, Region<>, Buffer<>, etc. MdTL also includes classes to model software tracing and this will be used for simultaneous software trace and memory dump analysis case study in the forthcoming presentation. I also plan to extend this metaprogramming approach in the future to model malware analysis patterns by introducing Metamalware Template Library (MmTL).
Forthcoming parts will introduce template classes and examples.
- Dmitry Vostokov @ DumpAnalysis.org + TraceAnalysis.org -
Posted in C and C++, Crash Dump Patterns, Debugging, Generative Debugging, Malware Analysis, Malware Patterns, Metadefect Template Library, Metamalware, New Acronyms, Software Behavior Patterns, Software Defect Construction, Structural Memory Patterns, Structural Trace Patterns, Tools, Trace Analysis Patterns, Victimware | No Comments »
Thursday, April 21st, 2011
Imagine a pattern-driven crash analysis report (car) when you need it: at the very moment of a crash, just in time! And the car drives you to a problem resolution. Imagine also a periodic pattern-driven just-in-time memory space analysis (JIT MSA) that provides you instant intelligent reports on what’s going on inside memory while your application, service or system is running! This is a forthcoming optional client side part of CARE (Crash Analysis Report Environment) which is being developed by Memory Dump Analysis Services engineering team under the leadership of Alexey Golikov. Combined with generative debugging techniques both client and server parts form a complete unique enterprise crash and hang analysis solution suitable for development and production environments. Stay tuned for further exciting updates.
PS. The car drives on a road to the first fault software problem solving.
- Dmitry Vostokov @ DumpAnalysis.org + TraceAnalysis.org -
Posted in Crash Analysis Report Environment (CARE), Crash Dump Analysis, Debugging, Debugging Methodology, Escalation Engineering, First Fault Problem Solving, Generative Debugging, JIT Crash Analysis, JIT Memory Space Analysis, Memory Analysis Forensics and Intelligence, Memory Dump Analysis Services, Pattern Prediction, Software Behavior Patterns, Software Engineering, Software Technical Support, Testing, Tools, Windows System Administration | No Comments »
Sunday, April 17th, 2011
I’m pleased to announce that MDAA, Volume 5 is available in PDF format:
www.dumpanalysis.org/Memory+Dump+Analysis+Anthology+Volume+5
It features:
- 25 new crash dump analysis patterns
- 11 new pattern interaction case studies (including software tracing)
- 16 new trace analysis patterns
- 7 structural memory patterns
- 4 modeling case studies for memory dump analysis patterns
- Discussion of 3 common analysis mistakes
- Malware analysis case study
- Computer independent architecture of crash analysis report service
- Expanded coverage of software narratology
- Metaphysical and theological implications of memory dump worldview
- More pictures of memory space and physicalist art
- Classification of memory visualization tools
- Memory visualization case studies
- Close reading of the stories of Sherlock Holmes: Dr. Watson’s observational patterns
- Fully cross-referenced with Volume 1, Volume 2, Volume 3, and Volume 4
Its table of contents is available here:
www.dumpanalysis.org/MDAA/MDA-Anthology-V5-TOC.pdf
Paperback and hardcover versions should be available in a week or two. I also started working on Volume 6 that should be available in November-December.
- Dmitry Vostokov @ DumpAnalysis.org + TraceAnalysis.org -
Posted in Aesthetics of Memory Dumps, Analysis Notation, Announcements, AntiPatterns, Archaeology of Computer Memory, Art, Assembly Language, Best Practices, Books, C and C++, CDF Analysis Tips and Tricks, Categorical Debugging, Citrix, Common Mistakes, Common Questions, Complete Memory Dump Analysis, Computer Forensics, Computer Science, Crash Analysis Report Environment (CARE), Crash Dump Analysis, Crash Dump De-analysis, Crash Dump Patterns, Crash Dumps for Dummies, Cyber Warfare, Debugging, Debugging Bureau, Debugging Industry, Debugging Methodology, Debugging Slang, Debugging Trends, Deep Down C++, Dr. Watson, Dublin School of Security, Education and Research, Escalation Engineering, Fun with Crash Dumps, Fun with Debugging, Fun with Software Traces, General Memory Analysis, Hermeneutics of Memory Dumps and Traces, Images of Computer Memory, Kernel Development, Malware Analysis, Mathematics of Debugging, Memiotics (Memory Semiotics), Memory Analysis Forensics and Intelligence, Memory Diagrams, Memory Dump Analysis Services, Memory Dumps in Myths, Memory Space Art, Memory Systems Language, Memory Visualization, Memory and Glitches, Metaphysics of Memory Worldview, Multithreading, Music for Debugging, New Acronyms, New Debugging School, New Words, Pattern Models, Philosophy, Physicalist Art, Publishing, Reverse Engineering, Science of Memory Dump Analysis, Science of Software Tracing, Security, Software Architecture, Software Behavior Patterns, Software Chorography, Software Chorology, Software Defect Construction, Software Engineering, Software Generalist, Software Maintenance Institute, Software Narratology, Software Technical Support, Software Trace Analysis, Software Trace Reading, Software Trace Visualization, Software Tracing for Dummies, Software Troubleshooting Patterns, Software Victimology, Structural Memory Patterns, Structural Trace Patterns, Systems Thinking, Testing, The Way of Philip Marlowe, Tools, Trace Analysis Patterns, Training and Seminars, Troubleshooting Methodology, Victimware, Vista, Webinars, WinDbg Scripting Extensions, WinDbg Scripts, WinDbg Tips and Tricks, WinDbg for GDB Users, Windows 7, Windows Server 2008, Windows System Administration, Workaround Patterns, x64 Windows | No Comments »
Friday, April 15th, 2011
Followed by my search for a periodic table of software defects I came up with a novel approach called Generative Debugging partially borrowed from principles and parameters generative linguistics framework. For debugging and post-construction software problem solving purposes we have Behavioral Principles and Structural Parameters. The parameters allow us to describe existing and even generate new software defects (I’m also considering Structural Principles and Behavioural Parameters but whether this is fruitful needs to be explored and seen. We may also consider the name “generative debugging” as a “naming” counterpart to software construction problem solving called generative programming. So the former could also be used to generate problem solutions faster in automatic fashion. Both, in the future, may be combined into a unified generative software problem solving.
As a first example, consider an application functional hang with a thread blocked by a pending I/O request packet (IRP). It is composed from general behavioral principle of blocked (or unresponsive) activity and structural parameters including Thread and IRP.
In the following parts many software incidents will be explored from this generative perspective.
- Dmitry Vostokov @ DumpAnalysis.org + TraceAnalysis.org -
Posted in Announcements, Debugging, Generative Debugging, Memory Systems Language, New Debugging School, Software Behavior Patterns, Structural Memory Patterns, Structural Trace Patterns | No Comments »
Saturday, March 26th, 2011
The presentation materials from the webinar (25th of March, 2011) are available for download:
http://www.dumpanalysis.com/PDSPSI-materials
Thanks to everyone who registered and attended!
- Dmitry Vostokov @ DumpAnalysis.org + TraceAnalysis.org -
Posted in Announcements, Crash Dump Analysis, Crash Dump Patterns, DebugWare Patterns, Debugging, Debugging Methodology, Escalation Engineering, Mac Crash Corner, Malware Analysis, Malware Patterns, Memory Analysis Forensics and Intelligence, Software Architecture, Software Behavior Patterns, Software Engineering, Software Technical Support, Software Trace Analysis, Software Tracing Implementation Patterns, Software Troubleshooting Patterns, Structural Memory Patterns, Structural Trace Patterns, Tools, Trace Analysis Patterns, Training and Seminars, Troubleshooting Methodology, Unified Debugging Patterns, Webinars, Workaround Patterns | No Comments »
Friday, March 18th, 2011
The forthcoming Software Behavior Analysis Patterns and Checklists: Corporate Reference Poster Edition for Windows Crash and Hang Memory Dump and Software Trace Analysis (ISBN: 978-1908043030) will feature Analysis Compass based on the reversal of an extended version of pattern-to-command table published in the printed version of Debugged! MZ/PE March, 2009 issue. Here’s a sneak preview screenshot of this feature:
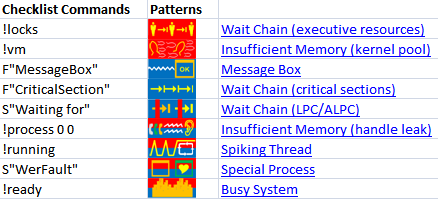
The notation F”Function” means searching for frames having the given Function name in stack traces from Stack Trace Collection. S”String” means searching for String in the output of WinDbg commands, for example, !process 0 ff.
- Dmitry Vostokov @ DumpAnalysis.org + TraceAnalysis.org -
Posted in Books, Crash Dump Analysis, Crash Dump Patterns, Debugging, Debugging Methodology, Software Behavior Patterns | No Comments »
Monday, March 7th, 2011

The first Webinar to start an in-depth discussion of pattern-driven software troubleshooting, debugging and maintenance:
Date: 25th of March 2011
Time: 18:30 (GMT) 14:30 (EST) 11:30 (PST)
Duration: 60 minutes
Space is limited.
Reserve your Webinar seat now at:
https://www3.gotomeeting.com/register/448268158
Topics include:
- A Short History of DumpAnalysis.org
- Memory Dump Analysis Patterns
- Troubleshooting and Debugging Tools (Debugware) Patterns
- Software Trace Analysis Patterns
- From Software Defects to Software Behavior
- Workaround Patterns
- Structural Memory Patterns
- Memory Analysis Domain Pattern Hierarchy
- New Directions
Prerequisites: experience in software troubleshooting and/or debugging.
- Dmitry Vostokov @ DumpAnalysis.org + TraceAnalysis.org -
Posted in .NET Debugging, Analysis Notation, Announcements, AntiPatterns, Best Practices, CDA Pattern Classification, Crash Dump Analysis, Crash Dump Patterns, DebugWare Patterns, Debugging, Debugging Methodology, Debugging Trends, Escalation Engineering, Java Debugging, Linux Crash Corner, Mac Crash Corner, Malware Analysis, Malware Patterns, Memory Analysis Forensics and Intelligence, Memory Dump Analysis Services, Pattern Models, Pattern Prediction, Presentations, Software Behavior Patterns, Software Chorology, Software Engineering, Software Narratology, Software Technical Support, Software Trace Analysis, Software Trace Reading, Software Tracing Implementation Patterns, Software Troubleshooting Patterns, Structural Memory Patterns, Structural Trace Patterns, Systems Thinking, Testing, Trace Analysis Patterns, Training and Seminars, Troubleshooting Methodology, Unified Debugging Patterns, Webinars, Workaround Patterns | No Comments »
Saturday, January 22nd, 2011
Software trace analysis is difficult and it is very common to hear “couldn’t see anything …”. One of advantages of software trace analysis patterns is that we can use that pattern language to write analysis reports. Here I provide an example for an analysis of a CDF trace from Citrix XenApp server. Instead of replying “didn’t find anything suspicious …” an engineer identified the following patterns:
Seeing the list of patterns it was much easier to ask questions to aid in further troubleshooting.
- Dmitry Vostokov @ DumpAnalysis.org + TraceAnalysis.org -
Posted in CDF Analysis Tips and Tricks, Software Behavior Patterns, Software Trace Analysis, Software Trace Reading, Structural Trace Patterns, Trace Analysis Patterns | No Comments »
Saturday, January 1st, 2011
With the new year starts the new initiative to integrate traditional multidisciplinary debugging approaches and methodologies with multiplatform pattern-driven software problem solving, unified debugging patterns, best practices in memory dump analysis and software tracing, computer security, economics, and the new emerging trends I’m going to write about during this year.
- Dmitry Vostokov @ DumpAnalysis.org + TraceAnalysis.org -
Posted in Announcements, Best Practices, Computer Forensics, Computer Science, Countefactual Debugging, Crash Analysis Report Environment (CARE), Crash Dump Analysis, Crash Dump Patterns, DebugWare Patterns, Debugging, Debugging Industry, Debugging Methodology, Debugging Trends, Dublin School of Security, Economics, Education and Research, Escalation Engineering, First Fault Problem Solving, Malware Analysis, Malware Patterns, Mathematics of Debugging, Memiotics (Memory Semiotics), Memoretics, Memory Analysis Forensics and Intelligence, Memory Analysis Report System, Memory Dump Analysis Services, Memory Systems Language, Memory Visualization, New Debugging School, Science of Memory Dump Analysis, Science of Software Tracing, Security, Software Behavior Patterns, Software Defect Construction, Software Engineering, Software Generalist, Software Maintenance Institute, Software Narratology, Software Trace Analysis, Software Trace Visualization, Software Tracing Implementation Patterns, Software Troubleshooting Patterns, Structural Memory Patterns, Structural Trace Patterns, Systems Thinking, Testing, Tool Objects, Tools, Trace Analysis Patterns, Training and Seminars, Troubleshooting Methodology, Unified Debugging Patterns, Victimware, Visual Dump Analysis, Webinars, Workaround Patterns | No Comments »
Friday, December 24th, 2010
Borrowing routine activity theory (RAT) from criminology I would like to introduce the similar approach to abnormal software behavior with patterning activities that adds additional unmotivated offenders to combine malware (software rats) with unintentional ordinary common bugware:
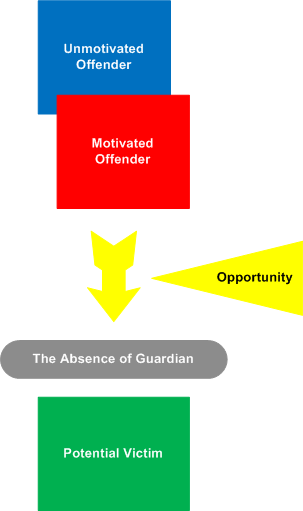
The application of RAT to software can be metaphorically named as Function Activity Theory (FAT).
- Dmitry Vostokov @ DumpAnalysis.org + TraceAnalysis.org -
Posted in Malware Analysis, Security, Software Behavior Patterns, Software Victimology, Structural Memory Patterns, Victimware | No Comments »
Friday, December 17th, 2010
As the new decade is approaching (2011-2020) we would like to make a few previews and predictions:
- Increased complexity of software will bring more methods from biological, social sciences and humanities in addition to existing methods of automated debugging and computer science techniques
- Focus on first fault software problem solving (when aspect)
- Focus on pattern-driven software problem solving (how aspect)
- Fusion of debugging and malware analysis into a unified structural and behavioral pattern framework
- Visual debugging, memory and software trace visualization techniques
- Software maintenance certification
- Focus on domain-driven troubleshooting and debugging tools as a service (debugware TaaS)
- Focus on security issues related to memory dumps and software traces
- New scripting languages and programming language extensions for debugging
- The maturation of the science of memory snapshots and software traces (memoretics)
Imagining is not not limited to the above and more to come and explain in the forthcoming parts.
- Dmitry Vostokov @ DumpAnalysis.org + TraceAnalysis.org -
Posted in Announcements, Anthropology, Archaeology of Computer Memory, Biology, Certification, Computer Science, Countefactual Debugging, Crash Analysis Report Environment (CARE), Crash Dump Analysis, Crash Dump Patterns, DebugWare Patterns, Debugging, Debugging Industry, Debugging Methodology, Debugging Trends, Dublin School of Security, EasyDbg, Economics, Escalation Engineering, Evolution, First Fault Problem Solving, Futuristic Memory Dump Analysis, General Memory Analysis, General Science, Geography, Hardware, Hermeneutics of Memory Dumps and Traces, History, Humanities, Language, Laws of Troubleshooting and Debugging, Logic, Malware Analysis, Malware Patterns, Mathematics of Debugging, Memiotics (Memory Semiotics), Memoretics, Memory Analysis Forensics and Intelligence, Memory Analysis Report System, Memory Dump Analysis and History, Memory Systems Language, Memory Visualization, Paleo-debugging, Pattern Models, Pattern Prediction, Physics, Psychology, Publishing, Science of Memory Dump Analysis, Science of Software Tracing, Security, Social Media, Social Sciences, Software Architecture, Software Behavior Patterns, Software Chorography, Software Chorology, Software Defect Construction, Software Engineering, Software Generalist, Software Maintenance Institute, Software Narrative Fiction, Software Narratology, Software Technical Support, Software Trace Analysis, Software Trace Analysis and History, Software Trace Deconstruction, Software Trace Linguistics, Software Trace Visualization, Software Troubleshooting Patterns, Software Victimology, Statistics, Structural Memory Analysis and Social Sciences, Structural Memory Patterns, Structural Trace Patterns, Systems Thinking, Testing, Tools, Trace Analysis Patterns, Troubleshooting Methodology, Unified Debugging Patterns, Uses of UML, Victimware, Virtualization, Visual Dump Analysis, Windows System Administration, Workaround Patterns | No Comments »
Friday, December 3rd, 2010
We now start unifying software behavior analysis patterns with debugging architecture, design, implementation and usage. This is analogous to software construction where a problem analysis leads to various software engineering phases. The important difference here is the addition of debugging usage patterns. Let’s look at an example (we discuss suggested patterns later):
- Analysis Patterns
Shared Buffer Overwrite
- Architectural Patterns
Debug Event Subscription / Notification
- Design Patterns
Punctuated Execution
- Implementation Patterns
Breakpoint (software and hardware)
- Usage Patterns
Kernel vs. user space breakpoints
To differentiate this systematic approach from the various published ad hoc debugging patterns we call it Unified Debugging Pattern Language. ADI parts can also correspond to various DebugWare patterns where we provide a mapping later.
- Dmitry Vostokov @ DumpAnalysis.org + TraceAnalysis.org -
Posted in Crash Dump Analysis, Crash Dump Patterns, DebugWare Patterns, Debugging, Software Architecture, Software Behavior Patterns, Software Engineering, Software Trace Analysis, Trace Analysis Patterns, Unified Debugging Patterns | No Comments »
Tuesday, November 30th, 2010
MAaaS includes 2 complementary DA+TA services:
1. Dump Analysis as a Service (DAaaS)
2. Trace Analysis as a Service (TAaaS)
Memory Dump Analysis Services is the first organization to provide such a service at an audit and certification levels.
- Dmitry Vostokov @ DumpAnalysis.org + TraceAnalysis.org -
Posted in Certification, Complete Memory Dump Analysis, Crash Analysis Report Environment (CARE), Crash Dump Analysis, Crash Dump Patterns, Debugging, Dublin School of Security, Escalation Engineering, Malware Analysis, Malware Patterns, Memiotics (Memory Semiotics), Memoretics, Memory Analysis Forensics and Intelligence, Memory Analysis Report System, Memory Dump Analysis Services, Minidump Analysis, Security, Software Behavior Patterns, Software Technical Support, Software Trace Analysis, Software Trace Reading, Structural Memory Patterns, Structural Trace Patterns, Tools, Trace Analysis Patterns, Windows System Administration | No Comments »