Crash Dump Analysis Patterns (Part 3)
Another pattern I observe frequently is False Positive Dump. We get dumps pointing in a wrong direction or not useful for analysis and this usually happens when wrong tool was selected or right one was not properly configured for capturing crash dumps. Here is one example I investigated in detail.
The customer experienced frequent spooler crashes. The dump was sent for investigation to find an offending component: usually it is a printer driver. WinDbg revealed the following exception thread stack (parameters are not shown here for readability):
KERNEL32!RaiseException+0x56

KERNEL32!OutputDebugStringA+0x55

KERNEL32!OutputDebugStringW+0x39

HPZUI041!ConvertTicket+0x3c90

HPZUI041!DllGetClassObject+0x5d9b

HPZUI041!DllGetClassObject+0x11bb
The immediate response is to point to HPZUI041.DLL but if we look at parameters to KERNEL32!OutputDebugStringA we would see that the string passed to it is a valid NULL-terminated string:
0:010> da 000d0040

000d0040  ".Lower DWORD of elapsed time = 3"

000d0060  "750000."
If we disassemble OutputDebugStringA up to RaiseException call we would see:
0:010> u KERNEL32!OutputDebugStringA

KERNEL32!OutputDebugStringA+0x55

KERNEL32!OutputDebugStringA:

push    ebp

mov     ebp,esp

push    0FFFFFFFFh

push    offset KERNEL32!'string'+0x10

push    offset KERNEL32!_except_handler3

mov     eax,dword ptr fs:[00000000h]

push    eax

mov     dword ptr fs:[0],esp

push    ecx

push    ecx

sub     esp,228h

push    ebx

push    esi

push    edi

mov     dword ptr [ebp-18h],esp

and     dword ptr [ebp-4],0

mov     edx,dword ptr [ebp+8]

mov     edi,edx

or      ecx,0FFFFFFFFh

xor     eax,eax

repne scas byte ptr es:[edi]

not     ecx

mov     dword ptr [ebp-20h],ecx

mov     dword ptr [ebp-1Ch],edx

lea     eax,[ebp-20h]

push    eax

push    2

push    0

push    40010006h

call    KERNEL32!RaiseException
There is no jumps in the code prior to KERNEL32!RaiseException call and this means that raising exception was expected. Also MSDN documentation says:
“If the application has no debugger, the system debugger displays the string. If the application has no debugger and the system debugger is not active, OutputDebugString does nothing.”
So spoolsv.exe might have been monitored by a debugger which caught that exception and instead of dismissing it dumped the spooler process.
If we look at ‘analyze -v’ output we could see the following:
Comment: 'Userdump generated complete user-mode minidump

with Exception Monitor function on WS002E0O-01-MFP'
ERROR_CODE: (NTSTATUS) 0x40010006 -
Debugger printed exception on control C.
Now we see that debugger was User Mode Process Dumper you can download from Microsoft web site:
How to use the Userdump.exe tool to create a dump file
If we download it, install it and write a small console program in Visual C++ to reproduce this crash:
#include "stdafx.h"

#include

int _tmain(int argc, _TCHAR* argv[])

{

    OutputDebugString(_T("Sample string"));

    return 0;

}
and if we compile it in Release mode and configure Process Dumper applet in Control Panel to include TestOutputDebugString.exe with the following properties:
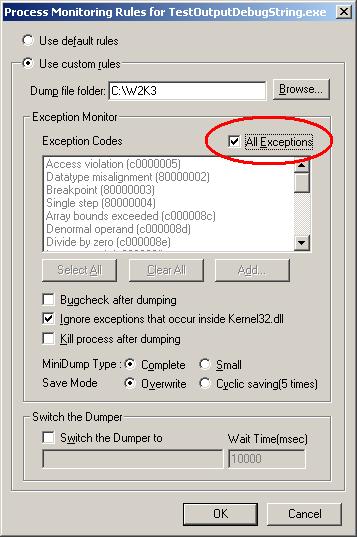
and then run our program we would see Process Dumper catching KERNEL32!RaiseException and saving the dump.
Even if we select to ignore exceptions that occur inside kernel32.dll this tool still dumps our process. Now we can see that the customer most probably enabled ‘All Exceptions’ check box too. What the customer should have done is to use default rules like on the picture below:
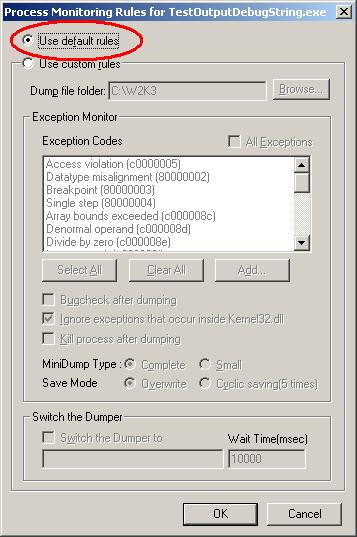
Or select exception codes manually. In this case no dump is generated even if we manually select all of them. Just to check that the latter configuration still catches access violations we can add a line of code dereferencing NULL pointer and Process Dumper will catch it and save the dump.
Conclusion: the customer should have used NTSD as a default postmortem debugger from the start. Then if crash happened we would have seen the real offending component or could have applied other patterns and requested additional dumps.
- Dmitry Vostokov @ DumpAnalysis.org -
February 12th, 2008 at 11:50 am
[…] mapping from False Positive Dump pattern brings us to False Project Failure pattern that usually happen when assessing the current […]
September 17th, 2008 at 9:50 am
[…] http://www.dumpanalysis.org/blog/index.php/2006/11/01/crash-dump-analysis-patterns-part-3/ […]
August 4th, 2009 at 9:31 am
Thanks for posting this! it really saved me time because i just could not figure out from this dump i got what was wrong with the string that was passed - the memory was valid….
March 12th, 2010 at 4:08 pm
[…] we introduce an icon for False Positive Dump […]
September 24th, 2010 at 10:54 am
[…] False Positive Dump […]
October 29th, 2011 at 12:55 am
Thanks for the great article.
I think I see a variant of this signature in another crash scenario:
We’re seeing WER AppCrash reports, ending in
Kernelbase!RaiseException
OutputDebugString
We’ve closely inspected our machines, and can’t see any debuggers present, nor does ‘!analyze -v’ mention one.
The common theme in our issue is that we see this on Win Server 2008 R2 (64), where other OSes don’t fail (XP 32/64, Win7).
We are a 32bit app.
I suspect (and this is hunches) that in this OS, RaiseException is sometimes used to trigger a heap corruption check, we fail, and get terminated. Is this paranoia or FUD?
Though (head/tail) pageheap and other lenses don’t seem to catch the corruption (it may be subtle?).
Thanks again for a great blog, you’re an indispensable resource for Win developers!
October 31st, 2011 at 1:04 pm
I think you need to see what module calls OutputDebugString. You may also have other issues on other threads that !analyze -v is not able to figure out. You can ask for memory dump analysis audit:
http://www.dumpanalysis.com/memory-dump-analysis-audit-service