Archive for the ‘Software Architecture’ Category
Monday, November 10th, 2008
While working on WinDbg command cards and even before that when compiling a comparison table for both WinDbg and GDB I came to an idea of abstract debugging commands that correspond to common debugging tasks, have clear syntax and semantics and serve metaphorically as a basis for conversion of analog thinking to digital debugger assistance (see analog-to-digital conversion for ADC abbreviation). Here a WinDbg extension can help but now I think about using a tree-based approach similar to CMDTREE.TXT for CDA Checklist. More on this later. Any comments or suggestions are greatly appreciated.
- Dmitry Vostokov @ DumpAnalysis.org -
Posted in Announcements, Crash Dump Analysis, Debugging, Software Architecture, Software Technical Support, WinDbg Tips and Tricks | 2 Comments »
Saturday, October 18th, 2008
Paperback edition of Memory Dump Analysis Anthology, Volume 2 is finally available on Amazon and Barnes & Noble. Search Inside is also available on Amazon. In addition, I updated the list of recommended books:
Listmania! Crash Dump Analysis and Debugging
Hardcover edition will be available on Amazon and B&N in 2-3 weeks.
- Dmitry Vostokov @ DumpAnalysis.org -
Posted in Announcements, Assembly Language, Books, Bugchecks Depicted, CDF Analysis Tips and Tricks, Certification, Citrix, Common Mistakes, Crash Dump Analysis, Crash Dump Patterns, Crash Dumps for Dummies, Data Recovery, DebugWare Patterns, Debugging, Fun with Crash Dumps, Hardware, Kernel Development, Memory Analysis Forensics and Intelligence, Memory Dump Analysis Jobs, Memory Visualization, Minidump Analysis, Music for Debugging, New Words, Philosophy, Publishing, Science of Memory Dump Analysis, Security, Software Architecture, Software Technical Support, Stack Trace Collection, Testing, Tools, Training and Seminars, Troubleshooting Methodology, Virtualization, Vista, WinDbg Scripts, WinDbg Tips and Tricks, WinDbg for GDB Users, Windows Server 2008 | No Comments »
Friday, October 3rd, 2008
“Everything is memory dump.”
I’m very excited to announce that Volume 2 is available in paperback, hardcover and digital editions:
Memory Dump Analysis Anthology, Volume 2
In one or two weeks paperback edition should also appear on Amazon and other bookstores. Amazon hardcover edition is planned to be available by the end of October.
I’m often asked when Volume 3 is available and I currently plan to release it in October - November, 2009. In the mean time I’m planning to concentrate on other publishing projects.
- Dmitry Vostokov @ DumpAnalysis.org -
Posted in Announcements, Assembly Language, Books, Bugchecks Depicted, CDF Analysis Tips and Tricks, Citrix, Common Mistakes, Crash Dump Analysis, Crash Dump Patterns, Crash Dumps for Dummies, Data Recovery, DebugWare Patterns, Debugging, Fun with Crash Dumps, Kernel Development, Memory Analysis Forensics and Intelligence, Memory Dump Analysis Jobs, Memory Visualization, Minidump Analysis, Music for Debugging, New Words, Philosophy, Publishing, Science of Memory Dump Analysis, Security, Software Architecture, Software Technical Support, Stack Trace Collection, Testing, Tools, Training and Seminars, Troubleshooting Methodology, Virtualization, Vista, WinDbg Scripts, WinDbg Tips and Tricks, WinDbg for GDB Users, Windows Server 2008 | No Comments »
Friday, September 26th, 2008
Here you can find the draft TOC for the forthcoming book “DebugWare: The Art and Craft of Writing Troubleshooting and Debugging Tools”:
Table of Contents
- Dmitry Vostokov @ DumpAnalysis.org -
Posted in Announcements, Books, DebugWare Patterns, Debugging, Publishing, Software Architecture, Software Technical Support, Tools | No Comments »
Saturday, September 20th, 2008
APIs “govern the world.”
John Selden, Table Talk
- Dmitry Vostokov @ DumpAnalysis.org -
Posted in Bugtations, Debugging, Software Architecture | No Comments »
Monday, September 15th, 2008
Another pattern that logically flows from Tool Chain is called Tool Box. Their principal difference is that the former launches subordinated tools in a sequence to reach the common goal and the latter is the tool that launches other tools in any sequence independently:
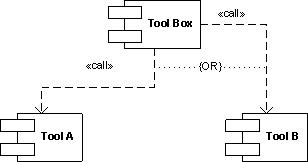
Often tool boxes are implemented as toolbars. Another boundary example is the so called resource kit tools where an HTML page or taskbar menu serves the role of tool box.
- Dmitry Vostokov @ DumpAnalysis.org -
Posted in DebugWare Patterns, Debugging, Software Architecture, Software Technical Support, Tools | No Comments »
Friday, September 12th, 2008
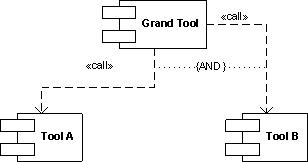
Usually after writing and using a tool we think about an extension of it or we find another tool that is suitable as that extension. In such cases it is better to reuse existing components and adapt the former tool to use the latter. Tool Chain is a good pattern name here. A programming analogy could be a compiler and linker:
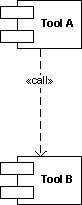
Typical example could be a logging tool that now acquires log viewer functionality by implementing a button that launches a separate log viewer or vice versa, a log viewer that can now do logging. Another simple example is a command file that launches different tools in a sequence. The tools might not be related by the data they produce and operate upon: this not the same as well-known architectural Filters and Pipes pattern. What is important is the fact that tools are related buy overall tool chain goal, for example, to debug problems by recording and analyzing log files or monitor some process activity and periodically create memory dumps:
- Dmitry Vostokov @ DumpAnalysis.org -
Posted in DebugWare Patterns, Debugging, Software Architecture, Software Technical Support, Tools | 1 Comment »
Saturday, September 6th, 2008
Debugging “of today reminds one of the Tower of Babel, for few” engineers “can follow profitably the” internals of components “other than their own, and even there they sometimes made to feel like strangers.”
George Sarton, The Study of the History of Mathematics
- Dmitry Vostokov @ DumpAnalysis.org -
Posted in Bugtations, Debugging, Software Architecture | No Comments »
Sunday, August 10th, 2008
Good troubleshooting tools usually have two interfaces: one is graphical (GUI) and the other is command line (CLI). The latter is very useful when GUI console is not available or there is a need to automate the tool. Both interfaces can be implemented in one component:
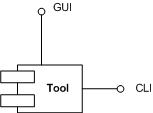
or there could be a separate GUI wrapper for complex CUI interface or when CUI interface was developed earlier and we don’t want to touch tool code (see Tool Façade pattern). Therefore this common pattern is called Dual Interface. Some tool examples:
Gflags
CDFControl
SystemDump
- Dmitry Vostokov @ DumpAnalysis.org -
Posted in DebugWare Patterns, Debugging, Software Architecture, Software Technical Support, Tools | No Comments »
Monday, August 4th, 2008
Many products have lots of configuration parameters stored in OS configuration database, Windows registry. Some of parameters are internal and some are public but never exposed via product GUI or management consoles. Configuration parameters can be related to product functionality or can make troubleshooting and debugging easier, for example, additional tracing parameters to set the verbosity level of debugging output or enable additional safety checks. These parameters can be scattered across different registry branches or keys. Therefore another pattern frequently seen in troubleshooting and debugging tools is called:
Configuration Wrapper
Here excellent example is Microsoft tool:
Gflags
- Dmitry Vostokov @ DumpAnalysis.org -
Posted in DebugWare Patterns, Debugging, Software Architecture, Software Technical Support, Tools | No Comments »
Sunday, July 20th, 2008
Next pattern is called
Tool Façade (or Tool Facade)
It is used when there is a tool with a cumbersome interface like command line with many options and there is a need for a better and easier to use interface, for example, GUI. This can be illustrated on the following UML component diagram:
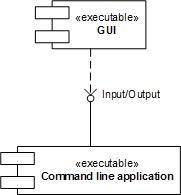
Excellent example of this pattern is:
StressPrinters
designed as a GUI wrapper around command line tool AddPrinter. Adding the powerful GUI interface allowed to extend its functionality and even find new domains, like testing, where the tool can be used. Excellent information about this tool can be found in the article:
Understanding and using Citrix StressPrinters
- Dmitry Vostokov @ DumpAnalysis.org -
Posted in DebugWare Patterns, Debugging, Software Architecture, Software Technical Support, Tools | 4 Comments »
Monday, June 16th, 2008
This new book will be published later this year:
Concurrent Programming on Windows Vista: Architecture, Principles, and Patterns (Microsoft .NET Development Series)
Although it is featured in Microsoft .NET Development Series I believe that it might be very interesting read for both unmanaged and managed code developers and escalation engineers. Understanding concurrency and having the ability to see its patterns is the crucial skill for crash dump analysis and debugging of complex software issues. I pre-ordered it myself and write a review once it is in print.
- Dmitry Vostokov @ DumpAnalysis.org -
Posted in Announcements, Books, Software Architecture, Vista, Windows Server 2008 | No Comments »
Friday, April 25th, 2008
Due to demand from people that prefer ebooks I published Memory Dump Analysis Anthology, Volume 1 in a digital format that can be purchased in Crash Dump Analysis Store. This format has color pictures inside.
- Dmitry Vostokov @ DumpAnalysis.org -
Posted in Announcements, Assembly Language, Books, Bugchecks Depicted, Citrix, Crash Dump Analysis, Crash Dump Patterns, Crash Dumps for Dummies, Debugging, Fun with Crash Dumps, GDB for WinDbg Users, Hardware, Kernel Development, Memory Dump Analysis Jobs, Memory Visualization, Minidump Analysis, Publishing, Science of Memory Dump Analysis, Security, Software Architecture, Software Technical Support, Stack Trace Collection, Tools, Troubleshooting Methodology, Vista, WinDbg Scripts, WinDbg Tips and Tricks, WinDbg for GDB Users, Windows Server 2008 | No Comments »
Tuesday, April 15th, 2008
I’m very proud to announce that it is finally available in both paperback and hardback. Why have I made available both editions? Because I personally prefer hardcover books. You can order the book today and it will be printed in 3-5 days (paperback) or 5-10 days (hardcover) and sent to you:
Memory Dump Analysis Anthology, Volume 1
Note: although listed on Amazon and other online bookstores it is not immediately available at these stores at the moment due to the late submission. I apologize for this. However, I expect that in a few weeks pre-orders taken there will be eventually fulfilled. In the mean time, if you want the book now, you can use the link above.
- Dmitry Vostokov @ DumpAnalysis.org -
Posted in Announcements, Assembly Language, Books, Bugchecks Depicted, CDF Analysis Tips and Tricks, Citrix, Crash Dump Analysis, Crash Dump Patterns, Crash Dumps for Dummies, Debugging, Fun with Crash Dumps, GDB for WinDbg Users, Hardware, Kernel Development, Memory Dump Analysis Jobs, Memory Visualization, Minidump Analysis, Publishing, Science of Memory Dump Analysis, Security, Software Architecture, Software Technical Support, Stack Trace Collection, Tools, Troubleshooting Methodology, Vista, WinDbg Scripts, WinDbg Tips and Tricks, WinDbg for GDB Users, Windows Server 2008 | 3 Comments »
Wednesday, April 2nd, 2008
Born out of 2008 April Fool’s joke (although I was thinking about it long before) the idea is to have a general framework and associated IDE for analysis activities for various tools that produce logs. Similar to planned GUI Monitor integrating WindowHistory, MesageHistory and ScreenHistory tools but also including Debugger Log Analyzer, Debugging Notebooks, various memory and trace log visualization subsystems. It also has the working title UTF (Unified Tools Framework).
Seems I’m very easy on inceptions  All this will be covered in great detail in the forthcoming book which I tirelessly advertise:
DebugWare: The Art and Craft of Writing Troubleshooting Tools
- Dmitry Vostokov @ DumpAnalysis.org -
Posted in Announcements, Crash Dump Analysis, Crash Dump Patterns, Debugging, Memory Visualization, Minidump Analysis, Software Architecture, Software Technical Support, Stack Trace Collection, Tools, Troubleshooting Methodology | 2 Comments »
Tuesday, March 25th, 2008
Although the first volume has not been published yet (scheduled for 15th of April, 2008) the planning for the second volume has already begun. Preliminary information is:
- Title: Memory Dump Analysis Anthology, Volume 2
- Paperback: 512 pages (*)
- ISBN-13: 978-0-9558328-7-1
- Author: Dmitry Vostokov
- Publisher: Opentask (01 Oct 2008)
- Language: English
- Product Dimensions: 22.86 x 15.24
Hardcover version is also planned. PDF version will be available for download too.
(*) subject to change
- Dmitry Vostokov @ DumpAnalysis.org -
Posted in Announcements, Assembly Language, Books, Bugchecks Depicted, Crash Dump Analysis, Crash Dump Patterns, Crash Dumps for Dummies, Debugging, Fun with Crash Dumps, Hardware, Kernel Development, Memory Dump Analysis Jobs, Memory Visualization, Minidump Analysis, Science of Memory Dump Analysis, Security, Software Architecture, Software Technical Support, Stack Trace Collection, Tools, Troubleshooting Methodology, Vista, WinDbg Scripts, WinDbg Tips and Tricks, WinDbg for GDB Users, Windows Server 2008 | 1 Comment »
Thursday, March 20th, 2008
Why do we need yet another book about device drivers? There are couple of reasons here:
-
Old books are more about developing the narrow range of legacy drivers than troubleshooting and debugging them.
-
New books shift towards WDF and ignore legacy drivers.
-
Windows Internals book is too big and something lightweight is desperately needed.
-
No published driver books use UML as communication device and discuss driver developement as software factory.
-
Existing books mostly view device drivers as hardware device drivers.
I started collecting and organizing information about Windows drivers 2 years ago and published a few selected materials so you can get an approximate flavour of what is expected in the forthcoming book scheduled for the next year:
UML and Device Drivers
- Title: Windows Device Drivers: An Introduction
- Author: Dmitry Vostokov
- Paperback: 128 pages
- ISBN-13: 978-0-9558328-4-0
- Publisher: Opentask (15 Apr 2009)
- Language: English
- Product Dimensions: 22.86 x 15.24
- Dmitry Vostokov @ DumpAnalysis.org -
Posted in Announcements, Books, Debugging, Hardware, Kernel Development, Software Architecture, Software Technical Support, Tools, Vista, Windows Server 2008 | No Comments »
Wednesday, March 19th, 2008
This is a forthcoming book about .NET debugging seen in a wider context than .NET runtime environment (CLR). There is the whole new generation of .NET software developers, designers and architects thinking in terms of managed code and associated concepts. However CLR runs in unmanaged environment which finally interfaces with native code. Therefore understanding unmanaged and native code is vital for successful debugging of real customer problems. Preliminary information is:
- Title: Unmanaged Code: Escaping the Matrix of .NET
- Author: Dmitry Vostokov
- Paperback: 512 pages (*)
- ISBN-13: 978-0-9558328-6-4
- Publisher: Opentask (1 Feb 2009)
- Language: English
- Product Dimensions: 22.86 x 15.24
(*) subject to change
- Dmitry Vostokov @ DumpAnalysis.org -
Posted in .NET Debugging, Announcements, Books, Crash Dump Analysis, Debugging, Software Architecture, Software Technical Support | 4 Comments »
Tuesday, February 26th, 2008
Finally release dates are set for the following two books:
DebugWare: The Art and Craft of Writing Troubleshooting and Debugging Tools
- Author: Kapildev Ramlal, Dmitry Vostokov
- Paperback: 256 pages (*)
- ISBN-13: 978-0-9558328-3-3
- Publisher: Opentask (15 Nov 2008)
- Language: English
- Product Dimensions: 22.86 x 15.24
Windows® Crash Dump Analysis
- Author: Dmitry Vostokov
- Paperback: 512 pages (*)
- ISBN-13: 978-0-9558328-2-6
- Publisher: Opentask (01 Dec 2008)
- Language: English
- Product Dimensions: 22.86 x 15.24
The latter book will be shorter than planned initially and will contain references to Memory Dump Analysis Anthology, Volume I and Volume II.
(*) subject to change
- Dmitry Vostokov @ DumpAnalysis.org -
Posted in Announcements, Books, Crash Dump Analysis, Debugging, Software Architecture, Software Technical Support, Tools, Vista, Windows Server 2008 | No Comments »
Friday, February 15th, 2008
Tons of PPTs based on Windows Internals book and David Solomon Expert Seminars. All can be found here:
The Windows Operating Systems Internals Curriculum Resource Kit
Lots of other materials including Windows Core Architecture by Dave Probert can be found here too:
Academic Resource Center - Operating Systems
- Dmitry Vostokov @ DumpAnalysis.org -
Posted in Books, Software Architecture | 1 Comment »