Archive for the ‘Software Architecture’ Category
Monday, September 28th, 2009
Every PID has its twitter account. Processes emit short trace messages (STM) and others subscribe to them. This is the technical support of the future, the concept of SoftWeet (*):
www.SoftWeet.com
(*) to weet
to know; to wit (archaic)
- Dmitry Vostokov @ DumpAnalysis.org -
Posted in Announcements, Debugged! MZ/PE, Debugging, Software Architecture, Software Engineering, Software Technical Support, Software Trace Analysis, Tools, Troubleshooting Methodology | 1 Comment »
Saturday, September 26th, 2009
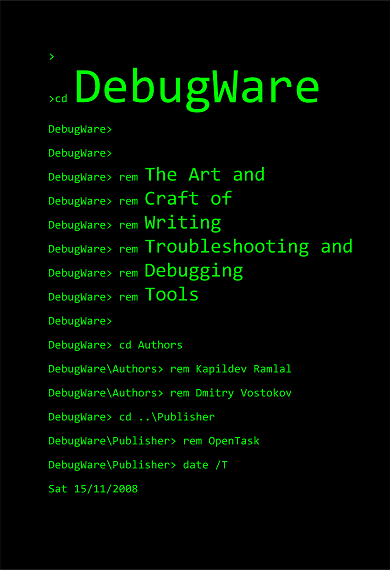
This is a revised, edited, cross-referenced and thematically organized volume of selected DumpAnalysis.org blog posts about crash dump analysis and debugging written in October 2008 - June 2009 for software engineers developing and maintaining products on Windows platforms, quality assurance engineers testing software on Windows platforms and technical support and escalation engineers dealing with complex software issues. The third volume features:
- 15 new crash dump analysis patterns
- 29 new pattern interaction case studies
- Trace analysis patterns
- Updated checklist
- Fully cross-referenced with Volume 1 and Volume 2
- New appendixes
Product information:
- Title: Memory Dump Analysis Anthology, Volume 3
- Author: Dmitry Vostokov
- Language: English
- Product Dimensions: 22.86 x 15.24
- Paperback: 404 pages
- Publisher: Opentask (20 December 2009)
- ISBN-13: 978-1-906717-43-8
- Hardcover: 404 pages
- Publisher: Opentask (30 January 2010)
- ISBN-13: 978-1-906717-44-5

Back cover features 3D computer memory visualization image.
- Dmitry Vostokov @ DumpAnalysis.org -
Posted in Announcements, AntiPatterns, Art, Assembly Language, Books, C and C++, CDF Analysis Tips and Tricks, Certification, Citrix, Code Reading, Common Mistakes, Computational Ghosts and Bug Hauntings, Computer Science, Countefactual Debugging, Crash Dump Analysis, Crash Dump Patterns, Crash Dumps for Dummies, DebugWare Patterns, Debugging, Debugging Slang, Deep Down C++, Education and Research, Escalation Engineering, Fun with Crash Dumps, Futuristic Memory Dump Analysis, Games for Debugging, Hardware, Horrors of Computation, Hyper-V, Intelligent Memory Movement, Kernel Development, Mathematics of Debugging, Memiotics (Memory Semiotics), Memoidealism, Memoretics, Memory Analysis Culture, Memory Analysis Forensics and Intelligence, Memory Dreams, Memory Dump Analysis Jobs, Memory Space Music, Memory Visualization, Memuonics, Minidump Analysis, Multithreading, Music for Debugging, New Acronyms, New Words, Occult Debugging, Philosophy, Poetry, Psi-computation, Publishing, Science of Memory Dump Analysis, Science of Software Tracing, Security, Software Architecture, Software Defect Construction, Software Engineering, Software Generalist, Software Narratology, Software Technical Support, Software Trace Analysis, Software Tracing for Dummies, Testing, Tools, Trace Analysis Patterns, Training and Seminars, Troubleshooting Methodology, Virtualization, Vista, Visual Dump Analysis, WinDbg Scripts, WinDbg Tips and Tricks, WinDbg for GDB Users, Windows 7, Windows Server 2008, Windows System Administration | No Comments »
Thursday, September 24th, 2009
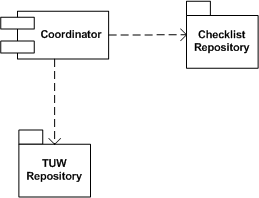
Real troubleshooting is usually done by combining several units of work chosen from a manual. Checklist pattern summarizes this recurrent practice. Checklist Coordinator orchestrates troubleshooting units of work (TUWs) components from TUW Repository according to checklists from Checklist Repository (in the simple case it can be just one checklist). This is illustrated on the following UML component diagram:
- Dmitry Vostokov @ DumpAnalysis.org -
Posted in DebugWare Patterns, Debugging, Software Architecture, Software Technical Support, Tools, Troubleshooting Methodology | 2 Comments »
Monday, September 21st, 2009
Troubleshooting Unit of Work is another pattern frequently used in manual troubleshooting and debugging. This is usually some independent and self-sufficient list of steps to perform to check something from a troubleshooting checklist or a manual and can be implemented as a separate loadable module, a class to reuse or a function to call. Output from such units of work can be stored in a blackboard system or processed by tools implementing Checklist DebugWare pattern. Typical example is an implementation of the following document:
Required Permissions and Rights for the Ctx_CpsvcUser Account
as a tool:
CTX_CpsvcUser Re-creation Tool for 32-Bit and 64-Bit Versions of Presentation Server 4.5
- Dmitry Vostokov @ DumpAnalysis.org -
Posted in DebugWare Patterns, Debugging, Software Architecture, Software Technical Support, Tools, Troubleshooting Methodology | 3 Comments »
Thursday, September 10th, 2009
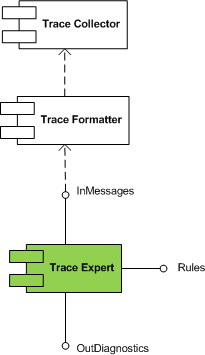
Trace Expert pattern came to my mind when I was writing about software trace patterns. It is a very lightweight expert system relying on trace collector and trace formatter (patterns to be written about soon). It is a module that takes a preformatted software trace message file or a buffer and a set of built in rules and uses simple search (peharps involving regular expressions) to dig out diagnostic information and provide troubleshooting and debugging directions.
This module is schematically depicted on the following UML component diagram:
- Dmitry Vostokov @ DumpAnalysis.org -
Posted in DebugWare Patterns, Debugging, Software Architecture, Software Technical Support, Software Trace Analysis, Tools, Trace Analysis Patterns, Troubleshooting Methodology | No Comments »
Wednesday, August 12th, 2009
Previously introduced RADII software development process acquires definite shape as a product supportability driven software support tools development process. In summary, supportability of a product gives rise to Requirements, they expand into Architecture segments, then into Design segments, then into Implementation segments, and finally, into several Improvement phases. In short, RADII:
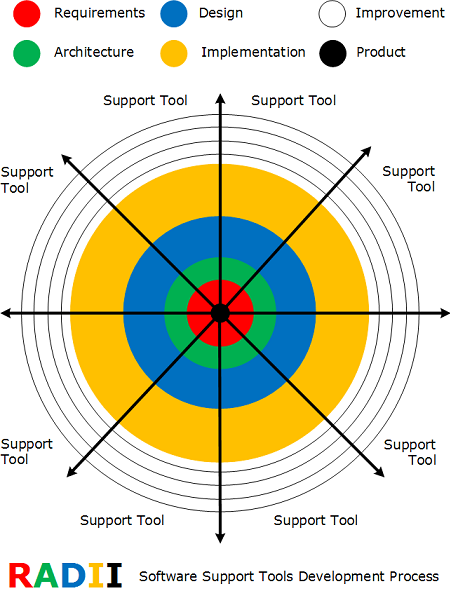
Every segment is a separate troubleshooting or debugging tool. All segments share elements of RADII via DebugWare patterns and can be further refined via iterative and incremental SDLC if needed.
- Dmitry Vostokov @ DumpAnalysis.org -
Posted in Announcements, DebugWare Patterns, Software Architecture, Software Engineering, Tools | 1 Comment »
Friday, July 17th, 2009
I resumed this week my reading notebook on Software Generalist blog with a top priority book to read every working day: Windows Internals, 5th edition. In reading notes I put what I find interesting for me (at this time) or related to Windows memory dump analysis or debugging and troubleshooting in general. For the latter case, sometimes I put additional references or even WinDbg examples from user, kernel and complete memory dumps in full color. Hope you find these notes useful too.
- Dmitry Vostokov @ DumpAnalysis.org -
Posted in Announcements, Books, Crash Dump Analysis, Debugging, Kernel Development, Reading Notebook, Software Architecture, Software Technical Support, Tools, Vista, Windows Server 2008 | No Comments »
Saturday, July 4th, 2009
Got it in the post yesterday shipped via courier from Amazon:
Windows® Internals: Including Windows Server 2008 and Windows Vista, Fifth Edition (PRO-Developer)

I originally expected it to be a paperback book but as a publisher myself I welcome the final MS Press decision to make it a hardcover. It is more solid. I plan to read it from cover to cover again, starting from tomorrow. I would like to thank authors for including the reference to www.dumpanalysis.org in the conclusion part of the last chapter 14 dedicated to crash dump analysis. This came as a nice surprise for me and I’m going to install a special plaque in the office and put its picture later on my blog.
- Dmitry Vostokov @ DumpAnalysis.org -
Posted in Announcements, Books, Certification, Crash Dump Analysis, Debugging, Software Architecture, Software Technical Support, Tools, Vista, Windows Server 2008, Windows System Administration | 4 Comments »
Saturday, July 4th, 2009
Supportability is similar to serviceability and while working on DebugWare book I realized that writing support tools needs its own buzz word like model-driven software design. Hence SDSD acronym was born a few days ago:
SDSD
Supportability-Driven Software Design
or
Support-Driven Software Design
or
Serviceability-Driven Software Design
Thinking about where to insert requirements, architecture and design led me to another acronym:
RADII
Requirements, Architecture, Design, Implementation and Improvement
The plural form of radius signifies the fact that there is a plurality of ways how SDLC can be implemented. Improvement is similar to Maintenance.
- Dmitry Vostokov @ DumpAnalysis.org -
Posted in DebugWare Patterns, New Acronyms, Software Architecture, Software Engineering, Software Technical Support, Tools | 1 Comment »
Saturday, June 20th, 2009
Following the success of Windows Debugging: Practical Foundations the following title will be published this summer:
Windows Device Drivers: Practical Foundations (ISBN: 978-0955832840)
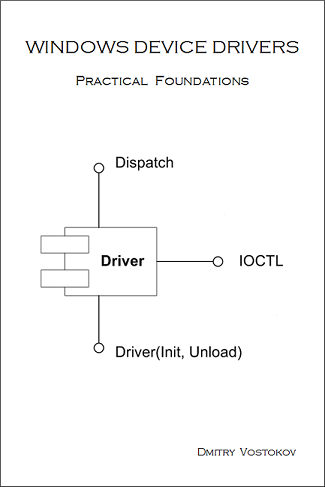
Table of contents will be posted later.
Other planned titles:
X64 Windows Debugging: Practical Foundations (ISBN: 978-1906717568)
Windows Multithreading: Practical Foundations (ISBN: 978-1906717742)
Like Windows Debugging book, these forthcoming titles are based on my seminars.
- Dmitry Vostokov @ DumpAnalysis.org -
Posted in Announcements, Books, Crash Dump Analysis, Debugging, Education and Research, Kernel Development, Multithreading, Publishing, Security, Software Architecture, Software Technical Support, Training and Seminars | No Comments »
Thursday, June 4th, 2009
Sometimes I’m asked about a broad software engineering book to recommend for general memory dump analysis that covers software architecture, design methods and diagramming languages like UML, programming languages, concurrency, real-time issues and many other topics you need to know to have systems understanding that helps in problem identification and debugging. Here’s the book that I was fortunate to buy 4-5 years ago in a book shop and is a sheer pleasure to read:
Software Engineering for Real-Time Systems

Today I found that there even exists an OMG certification based on it:
http://www.omg.org/ocres/exam-info.htm
I might try later this summer.
- Dmitry Vostokov @ DumpAnalysis.org -
Posted in Books, Certification, Crash Dump Analysis, Debugging, Memory Dump Analysis Jobs, Reviewed on Amazon, Software Architecture, Software Engineering, Software Generalist | No Comments »
Monday, May 25th, 2009
Found today this book while browsing Amazon:
The Rootkit Arsenal: Escape and Evasion in the Dark Corners of the System

Intrigued, I searched for its table of contents and found the author’s site:
Book TOC
Looks enough comprehensive so I pre-ordered the book and plan to write a review later from windows internals and memory dump analysis perspective.
- Dmitry Vostokov @ DumpAnalysis.org -
Posted in Assembly Language, Books, Crash Dump Analysis, Memory Analysis Forensics and Intelligence, Security, Software Architecture | No Comments »
Saturday, May 23rd, 2009
This is a stack trace (backtrace) where all finctions are removed and only modules are left. Useful for depicting component dependencies. Here is an example:
0: kd> kc 100

nt!KiSwapContext

nt!KiSwapThread

nt!KeDelayExecutionThread

3rdPartyAVDriver

3rdPartyAVDriver

3rdPartyAVDriver

3rdPartyAVDriver

nt!IofCallDriver

DriverA!Dispatch

DriverA!KUI_dispatch

nt!IofCallDriver

DriverB!PassThrough

DriverB!Dispatch

nt!IofCallDriver

DriverC!LowerPassThrough

DriverC

DriverC

DriverC

DriverC!DispatchPassThrough

nt!IofCallDriver

nt!IopParseDevice

nt!ObpLookupObjectName

nt!ObOpenObjectByName

nt!IopCreateFile

nt!IoCreateFile

nt!NtOpenFile

nt!KiFastCallEntry

ntdll!KiFastSystemCallRet

ntdll!NtOpenFile

ntdll!LdrpCreateDllSection

ntdll!LdrpMapDll

ntdll!LdrpLoadDll

ntdll!LdrLoadDll

kernel32!LoadLibraryExW

kernel32!LoadLibraryW

ntdll!LdrpCallInitRoutine

ntdll!LdrpRunInitializeRoutines

ntdll!LdrpLoadDll

ntdll!LdrLoadDll

kernel32!LoadLibraryExW

kernel32!LoadLibraryW

USER32!LoadAppDlls

USER32!ClientThreadSetup

USER32!__ClientThreadSetup

ntdll!KiUserCallbackDispatcher

nt!KiCallUserMode

nt!KeUserModeCallback

win32k!xxxClientThreadSetup

win32k!xxxCreateThreadInfo

win32k!UserThreadCallout

win32k!W32pThreadCallout

nt!PsConvertToGuiThread

nt!KiBBTUnexpectedRange
Collapsed stack trace is much simpler to grasp:
nt

3rdPartyAVDriver

nt

DriverA

nt

DriverB

nt

DriverC

nt

ntdll

kernel32

ntdll

kernel32

USER32

ntdll

nt

win32k

nt
- Dmitry Vostokov @ DumpAnalysis.org -
Posted in Crash Dump Analysis, Debugging, Software Architecture | 1 Comment »
Monday, May 18th, 2009
This is a forthcoming book to be released next year after we finally publish DebugWare book by the end of this summer:
Software Tracing and Logging: Architecture, Design, Implementation and Analysis Patterns (ISBN: 978-1906717728)
I have already begun working on it in the background. The scope of DebugWare book is too wide to cover tracing and logging in great detail not to mention the very important subject of software trace analysis.
- Dmitry Vostokov @ TraceAnalysis.org -
Posted in Announcements, Books, Debugging, Publishing, Science of Software Tracing, Software Architecture, Software Technical Support, Tools, Trace Analysis Patterns, Troubleshooting Methodology, Windows System Administration | No Comments »
Tuesday, April 28th, 2009
On the great divide in modern software factories:
“We have in fact, two kinds of” engineers, “side by side: one that” design, “but do not” code, “and another that” code, “but seldom” design.
Bertrand Russell, Sceptical Essays
- Dmitry Vostokov @ DumpAnalysis.org -
Posted in Bugtations, Code Reading, Debugging, Software Architecture | No Comments »
Wednesday, February 25th, 2009
Named after Georg Cantor CAN.TOR.OS∞ brings computation from the distant future into today. The transfinite worldview and universe of tomorrow into the finite worldview and universe of today. Cantor OS drives transfinite computing and saves transfinite memory dumps. More on this in subsequent parts as I have to come back to finite memory dumps… One cautious note though: transfinite doesn’t mean absolute infinity, or God-like computation, the latter is the realm of Memory Religion.
(∞) TOR is a new transfinite operation in addition to finite OR, AND or XOR
- Dmitry Vostokov @ DumpAnalysis.org -
Posted in Fun with Crash Dumps, Futuristic Memory Dump Analysis, Memory Religion (Memorianity), Philosophy, Science Fiction, Science of Memory Dump Analysis, Software Architecture | No Comments »
Monday, February 23rd, 2009
The main problem of memory dump analysis is the lack of consistent kernel virtual memory dumps saved on demand without system halt. LiveKd and Win32DD tools are physical memory dumpers only and do not save kernel memory dump files. These dumps are known to be inconsistent and I elaborated on different schemes to save memory consistently, for example, 1) to partition physical memory into 2 parts from OS boot time, 2) when memory snapshot is needed raise IRQL on all processors, 3) pump memory contents from one part to another (with compression if necessary, in such partition the reserved part of physical memory could be smaller), 4) lower IRQL on all processors to resume normal OS functions and 5) save consistent memory snapshot from reserved part of physical memory to a dump file in the background. The crucial feature of osmosis is its bipartite division and membrane. Hence the name of the project:
OSMOSIS
Optimally Saved Memory of System Internal State
Optimally Saved Memory (of) Operating System Internal State
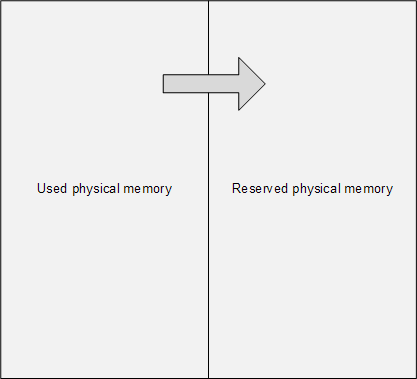
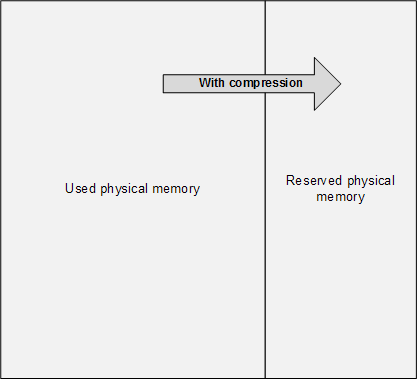
This is, of course, for OS running on physical machines, virtual machine case is much simpler in theory because we can freeze the whole VM or save its snapshot and later run an external tool or file converter on it.
- Dmitry Vostokov @ DumpAnalysis.org -
Posted in Announcements, Crash Dump Analysis, Debugging, Software Architecture, Software Technical Support, Tools | 1 Comment »
Wednesday, November 19th, 2008
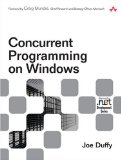
Got this book yesterday in the post and started reading. Table of contents is amazing for its practical depth and breadth. If you want me to provide a review in a language of concurrency (I’m reading many books in parallel) I would simply say one word:
Priority!
It simply means priority reading for any Windows software developer and maintainer. Invaluable for any engineer debugging complex software problems and analyzing Windows crash dumps. Simply because Microsoft OS and CLR developers use all this concurrent stuff and best practices described in the book so it is vital to be able recognize them in memory dumps. After reading this book you also get priority boost in your understanding of process and thread dynamics and your ability to plan, architect, design and implement concurrent applications and services.
Concurrent Programming on Windows (Microsoft .NET Development Series)
- Dmitry Vostokov @ DumpAnalysis.org -
Posted in Books, Code Reading, Crash Dump Analysis, Debugging, Software Architecture, Vista, Windows Server 2008 | 3 Comments »
Wednesday, November 19th, 2008
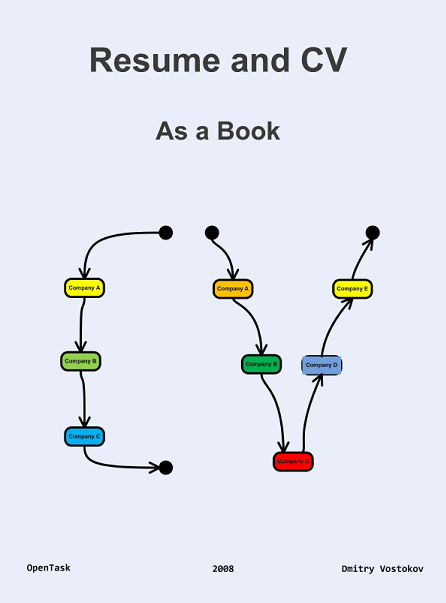
Previously announced my old Resume and CV as a book was submitted to print and distribution worldwide this morning.
It features UML statechart diagrams on the following front cover I designed myself:
- Dmitry Vostokov @ DumpAnalysis.org -
Posted in Announcements, Books, History, Publishing, Resume and CV, Software Architecture | No Comments »