Archive for the ‘Mathematics of Debugging’ Category
Sunday, June 14th, 2020
When interpreting a value as a pointer to a memory address we are usually interested in adjacent values pointed to:

0:000> ? rdx

Evaluate expression: 982485297288 = 000000e4`c0afe888
0:000> ? poi(000000e4`c0afe888)

Evaluate expression: 180 = 00000000`000000b4
0:000> ? poi(rdx)

Evaluate expression: 180 = 00000000`000000b4
0:000> dps rdx-10 rdx+10

000000e4`c0afe878  000000e4`c0afeac0

000000e4`c0afe880  000000e4`c0971000

000000e4`c0afe888  00000000`000000b4

000000e4`c0afe890  00000000`0000008c

000000e4`c0afe898  00000000`00000088
0:000> r $t0 = 0
0:000> dps rdx-@$t0 rdx+@$t0

000000e4`c0afe888  00000000`000000b4
0:000> r $t0 = 20
0:000> dps rdx-@$t0 rdx+@$t0

000000e4`c0afe868  00000000`00000001

000000e4`c0afe870  00001a38`00000001

000000e4`c0afe878  000000e4`c0afeac0

000000e4`c0afe880  000000e4`c0971000

000000e4`c0afe888  00000000`000000b4

000000e4`c0afe890  00000000`0000008c

000000e4`c0afe898  00000000`00000088

000000e4`c0afe8a0  00000000`00000088

000000e4`c0afe8a8  00000000`0000008c
We call this analysis pattern Pointer Cone by analogy with cones in category theory and our earlier attempts to use it. The reason for this pattern appearance is that it has been used in many times in other analysis pattern descriptions. We also intend to use this pattern language building block in our next analysis pattern.
- Dmitry Vostokov @ DumpAnalysis.org + TraceAnalysis.org -
Posted in Categorical Debugging, Crash Dump Analysis, Crash Dump Patterns, Mathematics of Debugging, x64 Windows | No Comments »
Tuesday, July 30th, 2019
Trace Similarity analysis pattern uses various similarity measures to assess the closeness of one trace or log to another. Here we provide an illustrative example using Jaccard index. Consider three simple logs where sample sets consist from Activity Regions:
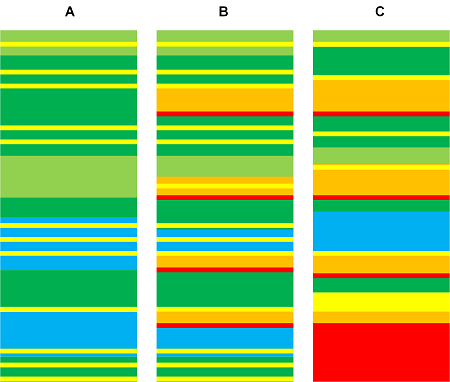
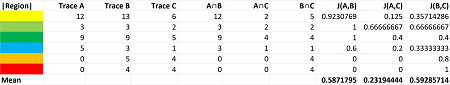
The following table shows calculation of similarity between A and B, A and C, and B and C:
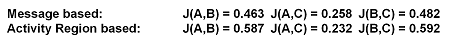
It’s possible to use sample sets consisting of messages instead. For our toy example we get similar index numbers:
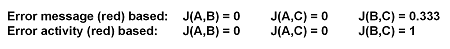
We get different indexes though for individual regions and messages, for example:
- Dmitry Vostokov @ DumpAnalysis.org + TraceAnalysis.org -
Posted in Anomaly Detection, Log Analysis, Mathematics of Debugging, Software Trace Analysis, Trace Analysis Patterns, Trace Analysis and Topology | No Comments »
Saturday, July 27th, 2019
In addition to Declarative Trace we have code statements that may be intercepted by external API tracing tools (CreateFile, CloseHandle):
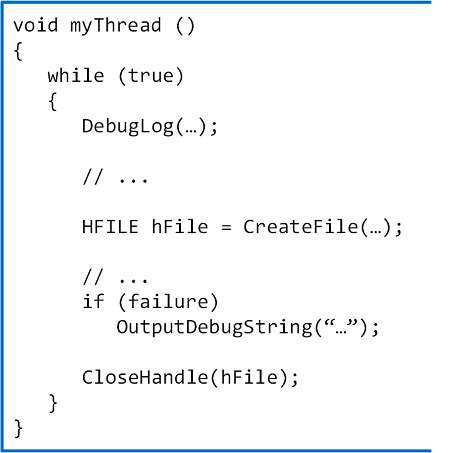
In the sample code above we have different logs resulted from Declarative Trace (DebugLog, OutputDebugString):
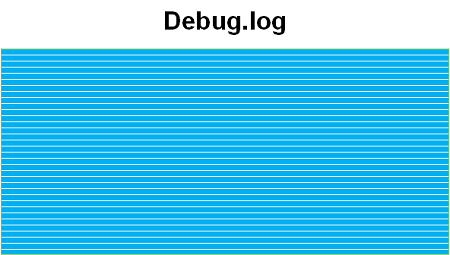
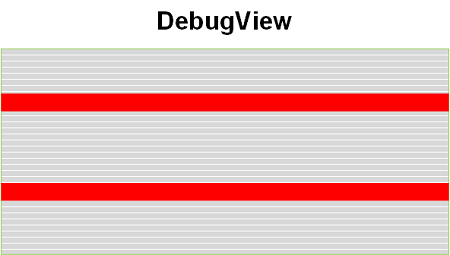
In addition, we have a log saved by an external tracing tool (for example, Process Monitor) that includes our API calls:
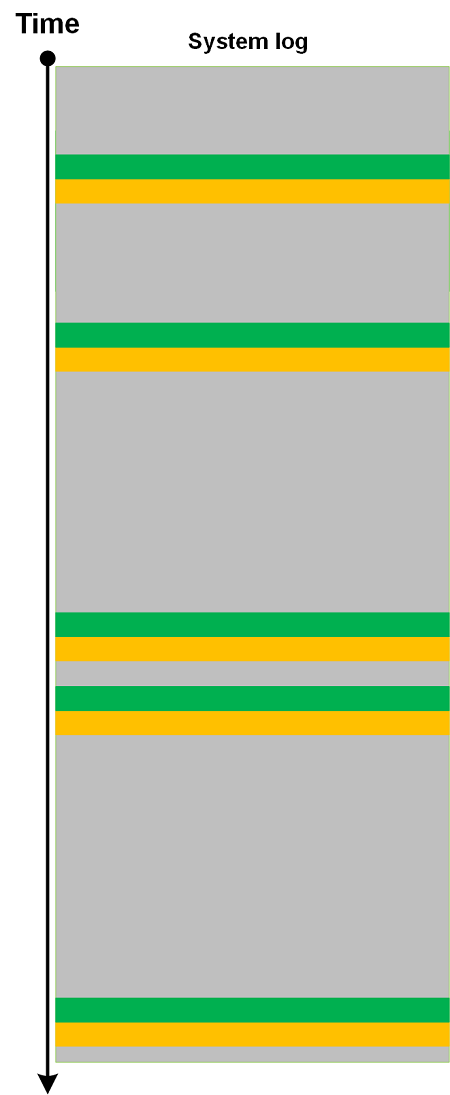
All such trace-generating source code statements form Moduli Trace as soon as they are executed:

Such a trace can also be analyzed using trace and log analysis patterns like other trace types. We took the idea of this analysis pattern from moduli spaces in mathematics that parametrize other spaces.
- Dmitry Vostokov @ DumpAnalysis.org + TraceAnalysis.org -
Posted in Log Analysis, Mathematics of Debugging, Software Trace Analysis, Trace Analysis Patterns, Trace Analysis and Topology | No Comments »
Tuesday, July 16th, 2019
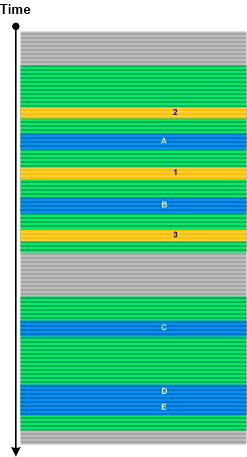
Cartesian Trace analysis pattern has its analogical roots in Cartesian product. It covers a case where we have a long trace and a few Small DA+TA configuration traces (files). The former trace messages are associated with the latter messages (content or content changes) as depicted in the following diagram:
Think about a rectangle as a product of two line fragments or a cylinder as a product of a circle and a line fragment. Both traces are completely independent in comparison to Fiber Bundle, Trace Presheaf, or Trace Extension.
- Dmitry Vostokov @ DumpAnalysis.org + TraceAnalysis.org -
Posted in Log Analysis, Mathematics of Debugging, Software Trace Analysis, Trace Analysis Patterns | No Comments »
Sunday, July 14th, 2019
Some trace and log messages may have different grammatical structure and content but similar semantics. Therefore, we can create a table listing equivalent messages (using some equivalence relation) and use it to construct simpler traces and logs as depicted in this picture:

One trivial example of Equivalent Messages analysis pattern is Quotient Trace. Another example is Inter-Correlational analysis of logs that have different structure and format. In such a case Equivalent Messages simplify the analysis of higher Trace Dimensions.
- Dmitry Vostokov @ DumpAnalysis.org + TraceAnalysis.org -
Posted in Log Analysis, Mathematics of Debugging, Software Trace Analysis, Trace Analysis Patterns, Trace Analysis and Topology | No Comments »
Sunday, April 7th, 2019
If we run software with its default configuration and no interaction (input data) we get its Minimal Trace:
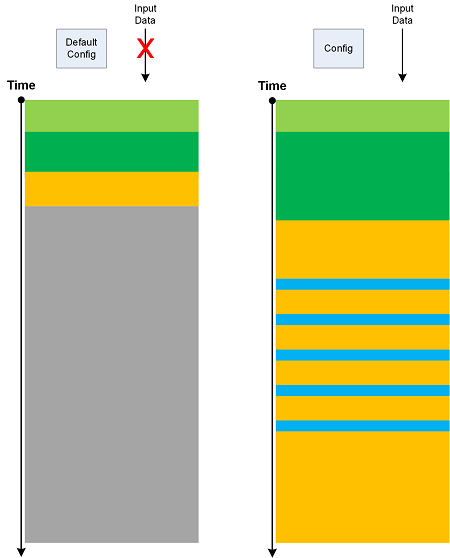
Such traces may have their own Master Trace. Also, Minimal Trace is a specific Use Case Trail. Metaphorically, they can be considered as minimal surfaces.
- Dmitry Vostokov @ DumpAnalysis.org + TraceAnalysis.org -
Posted in Log Analysis, Mathematics of Debugging, Software Trace Analysis, Trace Analysis Patterns, Trace Analysis and Geometry | No Comments »
Tuesday, March 26th, 2019
Based on a mathematical analogy with critical points in topology (Morse theory) we introduce Critical Points in trace and log analysis where they signify the change of trace or log “shape” (topological or “geometric” properties) as illustrated in the following diagram:
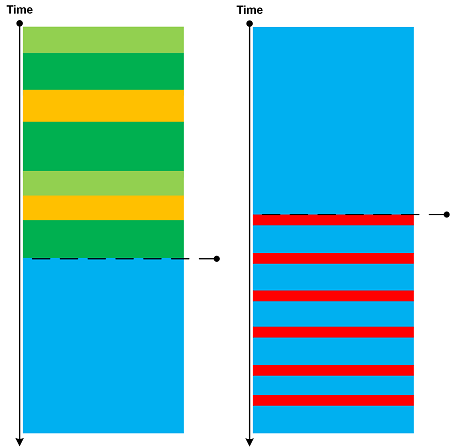
Such a point may be an individual message, its Message Context, or Activity Region.
Critical Points are examples of Intra-Correlation whereas Bifurcation Points are examples of Inter-Correlation.
- Dmitry Vostokov @ DumpAnalysis.org + TraceAnalysis.org -
Posted in Log Analysis, Mathematics of Debugging, Software Trace Analysis, Trace Analysis Patterns, Trace Analysis and Topology | No Comments »
Saturday, September 22nd, 2018
Sometimes, we ask for a log file to see State and Event pattern, and see it there, only to find that we cannot do Back Trace of State Dumps from some Significant Event for Inter-Correlation analysis because our Data Interval is truncated (Truncated Trace). This highlights the importance of proper tracing intervals that we call Significant Interval analysis pattern by analogy with significant digits in scientific measurements. The following diagram illustrate the pattern:
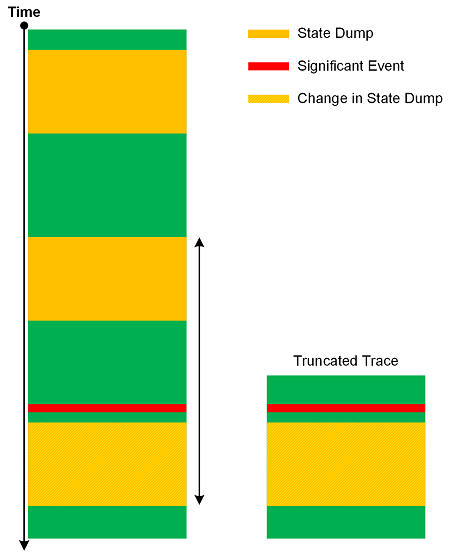
If you find out you get truncated traces and logs often you may want to increase Statement Current for state logging.
- Dmitry Vostokov @ DumpAnalysis.org + TraceAnalysis.org -
Posted in Log Analysis, Mathematics of Debugging, Software Trace Analysis, Software Trace Analysis Tips and Tricks, Software Tracing Design, Software Tracing Implementation Patterns, Trace Analysis Patterns | No Comments »
Saturday, September 8th, 2018
We can “integrate” trace message stream into another, smaller trace. By analogy with motivic integration in contemporary mathematics we call this analysis pattern Motivic Trace. There can be border cases where the whole trace is reduced to one message or every message is associated with a different message (perhaps shorter or a number). Message Sets that are integrated into Motivic Trace can be completely different (for example, based on Motives) in comparison with Quotient Trace where we reduce Message Sets that have the same common attribute.
- Dmitry Vostokov @ DumpAnalysis.org + TraceAnalysis.org -
Posted in Log Analysis, Mathematics of Debugging, Software Trace Analysis, Trace Analysis Patterns | 1 Comment »
Thursday, July 20th, 2017
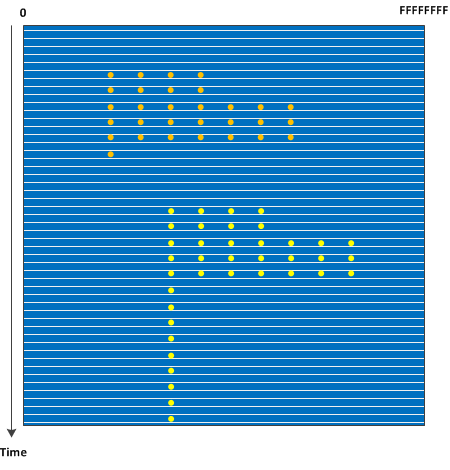
Certain types of blind SQL injection attacks may leave log messages with just one byte difference. We call with analysis pattern Ultrasimilar Messages by analogy with an ultrametric space in mathematics and the interpretation of messages as p-adic numbers. Since, such messages may be scattered in a log we can choose Message Pattern based on some Message Invariant (for example, parts of SQL request) and then analyze its Fiber of Activity (for example, Data Flow of its variable part). A log with two different types of Ultrasimilar Messages is shown in the following diagram:
- Dmitry Vostokov @ DumpAnalysis.org + TraceAnalysis.org -
Posted in Log Analysis, Mathematics of Debugging, Security, Software Trace Analysis, Trace Analysis Patterns | No Comments »
Sunday, September 13th, 2015
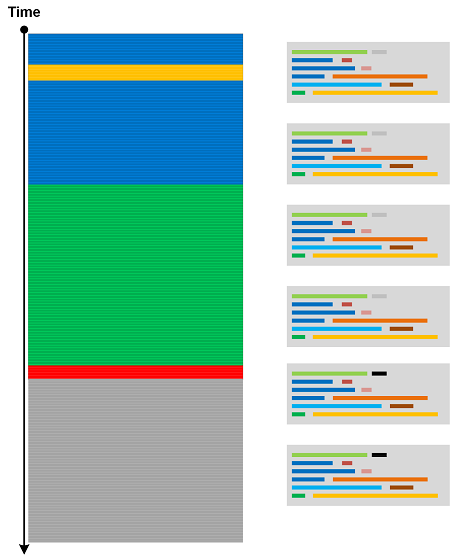
The advent of virtual machines, the possibility of saving complete memory snapshots without interruption, and the ability to quickly convert such snapshots into a debugger readable memory dump format such as in the case of VMware allows to study how Stack Trace Collections and Wait Chains change over time in complex problem scenarios. Such Stack Trace Surface may also show service restarts if PID changes for processes of interest. We call this pattern by analogy with a memory dump surface where each line corresponds to an individual memory snapshot with coordinates from 0 to the highest address:
In case of orbifold memory space we have a case of a 3D volume (we may call 3D orbifold).
- Dmitry Vostokov @ DumpAnalysis.org + TraceAnalysis.org -
Posted in Complete Memory Dump Analysis, Crash Dump Analysis, Crash Dump Patterns, Mathematics of Debugging, Memory Visualization, Software Trace Analysis | No Comments »
Friday, September 28th, 2012
The previous mathematical definition of memory dump is for raw memory dumps. They are not really useful because they require symbol files. Each symbol file entry conceptually is a correspondence between a memory address and a direct sum or product of letters from some alphabet:
00000000`76e82c40: kernel32!WaitForMultipleObjectsExImplementation
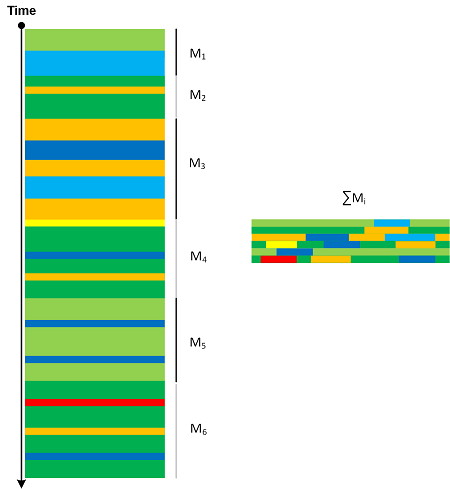
So we propose an analytical definition of a memory dump as a direct sum of disjoint memory areas Mt taken during some time interval (t0, …, tn) where we replace stk having values from Z2 with Stq having values from Zp and cardinality of Zp depending on a platform (32, 64, etc) plus a symbolic description ∏Di for each Stq with cardinality of ”i” set sufficient enough to accommodate the largest symbolic name:
M = ∑Mt where Mt = ∑(Stq+∏Di)
or simply
M = ∑∑(Stq+∏Di)
This can be visualized as a linear memory space such as a virtual memory space when symbol files are applied to modules one after another. However, all this is not necessary, as a symbol from a virtual address can also be mapped to a physical address if necessary. ∏Di, in fact, refers to any symbolic description.
- Dmitry Vostokov @ DumpAnalysis.org + TraceAnalysis.org -
Posted in Computer Science, Crash Dump Analysis, Crash Dump Patterns, General Memory Analysis, Mathematics, Mathematics of Debugging, Science of Memory Dump Analysis, Systems Theory | No Comments »
Sunday, April 15th, 2012
After 4 years in print this bestselling title needs an update to address minor changes, include extra examples and reference additional research published in Volumes 2, 3, 4, 5 and 6.
- Title: Memory Dump Analysis Anthology, Volume 1
- Author: Dmitry Vostokov
- Publisher: OpenTask (Summer 2012)
- Language: English
- Product Dimensions: 22.86 x 15.24
- Paperback: 800 pages
- ISBN-13: 978-1-908043-35-1
- Hardcover: 800 pages
- ISBN-13: 978-1-908043-36-8
The cover for both paperback and hardcover titles will also have a matte finish. We used A Memory Window artwork for the back cover.

- Dmitry Vostokov @ DumpAnalysis.org + TraceAnalysis.org -
Posted in Aesthetics of Memory Dumps, Announcements, AntiPatterns, Art, Assembly Language, Best Practices, Books, Bugchecks Depicted, C and C++, Complete Memory Dump Analysis, Computer Science, Crash Dump Analysis, Crash Dump Patterns, Crash Dumps for Dummies, Debugging, Debugging Methodology, Dr. Watson, Escalation Engineering, Fun with Crash Dumps, GDB for WinDbg Users, Hardware, Images of Computer Memory, Kernel Development, Mathematics of Debugging, Memiotics (Memory Semiotics), Memoretics, Memory Dump Analysis Methodology, Memory Space Art, Memory Space Music, Memory Visualization, Minidump Analysis, Multithreading, Pattern-Driven Debugging, Pattern-Driven Software Support, Publishing, Reference, Root Cause Analysis, Science of Memory Dump Analysis, Software Architecture, Software Behavior DNA, Software Behavior Patterns, Software Behavioral Genome, Software Diagnostics, Software Engineering, Software Technical Support, Stack Trace Collection, Testing, Tools, Troubleshooting Methodology, Vista, WinDbg Scripts, WinDbg Tips and Tricks, WinDbg for GDB Users, Windows 7, Windows Data Structures, Windows Server 2008, Windows System Administration, x64 Windows | No Comments »
Wednesday, September 21st, 2011
Memoretics as a science of memory snapshots borrows many ideas from the following disciplines (the list is not exhaustive):
- Troubleshooting and Debugging
- Intelligence Analysis
- Critical Thinking
- Forensics
- Linguistics
- Archaeology
- Psychoanalysis
- History
- Mathematics: Sets and Categories
- Literary Criticism and Narratology
It also contributes many ideas back. The following diagram depicts such an interaction:

- Dmitry Vostokov @ DumpAnalysis.org + TraceAnalysis.org -
Posted in Archaeology of Computer Memory, Categorical Debugging, Computer Forensics, Computer Science, Countefactual Debugging, Crash Dump Analysis, Crash Dump De-analysis, Crash Dump Patterns, Debugging, Debugging Methodology, Dublin School of Security, Education and Research, Escalation Engineering, General Memory Analysis, Generative Debugging, Hermeneutics of Memory Dumps and Traces, History, Intelligence Analysis Patterns, M->analysis, Malware Analysis, Malware Patterns, Mathematics of Debugging, Memiotics (Memory Semiotics), Memoretics, Memory Analysis Forensics and Intelligence, Memory Dump Analysis and History, Memory Systems Language, Memory Visualization, Metadefect Template Library, Metamalware, New Debugging School, Paleo-debugging, Pattern Models, Pattern Prediction, Psychoanalysis of Software Maintenance and Support, Psychology, Reverse Engineering, Root Cause Analysis, Science of Memory Dump Analysis, Science of Software Tracing, Security, Software Architecture, Software Behavior DNA, Software Behavior Patterns, Software Behavioral Genome, Software Chorography, Software Chorology, Software Defect Construction, Software Engineering, Software Narratology, Software Technical Support, Software Trace Analysis, Software Trace Analysis and History, Software Trace Deconstruction, Software Trace Linguistics, Software Trace Reading, Software Trace Visualization, Software Tracing Implementation Patterns, Software Troubleshooting Patterns, Software Victimology, Software and History, Structural Memory Analysis and Social Sciences, Structural Memory Patterns, Structural Trace Patterns, Systems Thinking, Testing, Tools, Trace Analysis Patterns, Troubleshooting Methodology, UI Problem Analysis Patterns, Unified Debugging Patterns, Victimware, Virtualization, Visual Dump Analysis, Workaround Patterns | No Comments »
Sunday, April 17th, 2011
I’m pleased to announce that MDAA, Volume 5 is available in PDF format:
www.dumpanalysis.org/Memory+Dump+Analysis+Anthology+Volume+5
It features:
- 25 new crash dump analysis patterns
- 11 new pattern interaction case studies (including software tracing)
- 16 new trace analysis patterns
- 7 structural memory patterns
- 4 modeling case studies for memory dump analysis patterns
- Discussion of 3 common analysis mistakes
- Malware analysis case study
- Computer independent architecture of crash analysis report service
- Expanded coverage of software narratology
- Metaphysical and theological implications of memory dump worldview
- More pictures of memory space and physicalist art
- Classification of memory visualization tools
- Memory visualization case studies
- Close reading of the stories of Sherlock Holmes: Dr. Watson’s observational patterns
- Fully cross-referenced with Volume 1, Volume 2, Volume 3, and Volume 4
Its table of contents is available here:
www.dumpanalysis.org/MDAA/MDA-Anthology-V5-TOC.pdf
Paperback and hardcover versions should be available in a week or two. I also started working on Volume 6 that should be available in November-December.
- Dmitry Vostokov @ DumpAnalysis.org + TraceAnalysis.org -
Posted in Aesthetics of Memory Dumps, Analysis Notation, Announcements, AntiPatterns, Archaeology of Computer Memory, Art, Assembly Language, Best Practices, Books, C and C++, CDF Analysis Tips and Tricks, Categorical Debugging, Citrix, Common Mistakes, Common Questions, Complete Memory Dump Analysis, Computer Forensics, Computer Science, Crash Analysis Report Environment (CARE), Crash Dump Analysis, Crash Dump De-analysis, Crash Dump Patterns, Crash Dumps for Dummies, Cyber Warfare, Debugging, Debugging Bureau, Debugging Industry, Debugging Methodology, Debugging Slang, Debugging Trends, Deep Down C++, Dr. Watson, Dublin School of Security, Education and Research, Escalation Engineering, Fun with Crash Dumps, Fun with Debugging, Fun with Software Traces, General Memory Analysis, Hermeneutics of Memory Dumps and Traces, Images of Computer Memory, Kernel Development, Malware Analysis, Mathematics of Debugging, Memiotics (Memory Semiotics), Memory Analysis Forensics and Intelligence, Memory Diagrams, Memory Dump Analysis Services, Memory Dumps in Myths, Memory Space Art, Memory Systems Language, Memory Visualization, Memory and Glitches, Metaphysics of Memory Worldview, Multithreading, Music for Debugging, New Acronyms, New Debugging School, New Words, Pattern Models, Philosophy, Physicalist Art, Publishing, Reverse Engineering, Science of Memory Dump Analysis, Science of Software Tracing, Security, Software Architecture, Software Behavior Patterns, Software Chorography, Software Chorology, Software Defect Construction, Software Engineering, Software Generalist, Software Maintenance Institute, Software Narratology, Software Technical Support, Software Trace Analysis, Software Trace Reading, Software Trace Visualization, Software Tracing for Dummies, Software Troubleshooting Patterns, Software Victimology, Structural Memory Patterns, Structural Trace Patterns, Systems Thinking, Testing, The Way of Philip Marlowe, Tools, Trace Analysis Patterns, Training and Seminars, Troubleshooting Methodology, Victimware, Vista, Webinars, WinDbg Scripting Extensions, WinDbg Scripts, WinDbg Tips and Tricks, WinDbg for GDB Users, Windows 7, Windows Server 2008, Windows System Administration, Workaround Patterns, x64 Windows | No Comments »
Wednesday, February 16th, 2011
Orbifold Memory Space
A multiple virtual/physical memory space view taking into account multiple computers:
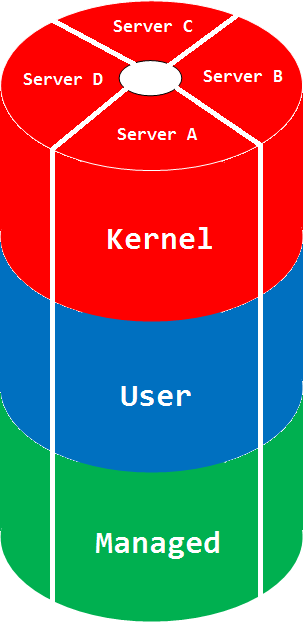
The picture can be much more complex if we glue different manifold memory spaces. The space name comes from a mathematical orbifold, a generalization of manifold.
Synonyms: cloud memory space
Antonyms:
Also: memory space, memory region, physical memory, virtual memory, manifold memory space, memory mapping.
- Dmitry Vostokov @ DumpAnalysis.org + TraceAnalysis.org -
Posted in Cloud Memory Dump Analysis, Complete Memory Dump Analysis, Crash Dump Analysis, Debugging, Dictionary of Debugging, Mathematics, Mathematics of Debugging, Memoretics, O, Science of Memory Dump Analysis | No Comments »
Saturday, January 1st, 2011
With the new year starts the new initiative to integrate traditional multidisciplinary debugging approaches and methodologies with multiplatform pattern-driven software problem solving, unified debugging patterns, best practices in memory dump analysis and software tracing, computer security, economics, and the new emerging trends I’m going to write about during this year.
- Dmitry Vostokov @ DumpAnalysis.org + TraceAnalysis.org -
Posted in Announcements, Best Practices, Computer Forensics, Computer Science, Countefactual Debugging, Crash Analysis Report Environment (CARE), Crash Dump Analysis, Crash Dump Patterns, DebugWare Patterns, Debugging, Debugging Industry, Debugging Methodology, Debugging Trends, Dublin School of Security, Economics, Education and Research, Escalation Engineering, First Fault Problem Solving, Malware Analysis, Malware Patterns, Mathematics of Debugging, Memiotics (Memory Semiotics), Memoretics, Memory Analysis Forensics and Intelligence, Memory Analysis Report System, Memory Dump Analysis Services, Memory Systems Language, Memory Visualization, New Debugging School, Science of Memory Dump Analysis, Science of Software Tracing, Security, Software Behavior Patterns, Software Defect Construction, Software Engineering, Software Generalist, Software Maintenance Institute, Software Narratology, Software Trace Analysis, Software Trace Visualization, Software Tracing Implementation Patterns, Software Troubleshooting Patterns, Structural Memory Patterns, Structural Trace Patterns, Systems Thinking, Testing, Tool Objects, Tools, Trace Analysis Patterns, Training and Seminars, Troubleshooting Methodology, Unified Debugging Patterns, Victimware, Visual Dump Analysis, Webinars, Workaround Patterns | No Comments »
Friday, December 17th, 2010
As the new decade is approaching (2011-2020) we would like to make a few previews and predictions:
- Increased complexity of software will bring more methods from biological, social sciences and humanities in addition to existing methods of automated debugging and computer science techniques
- Focus on first fault software problem solving (when aspect)
- Focus on pattern-driven software problem solving (how aspect)
- Fusion of debugging and malware analysis into a unified structural and behavioral pattern framework
- Visual debugging, memory and software trace visualization techniques
- Software maintenance certification
- Focus on domain-driven troubleshooting and debugging tools as a service (debugware TaaS)
- Focus on security issues related to memory dumps and software traces
- New scripting languages and programming language extensions for debugging
- The maturation of the science of memory snapshots and software traces (memoretics)
Imagining is not not limited to the above and more to come and explain in the forthcoming parts.
- Dmitry Vostokov @ DumpAnalysis.org + TraceAnalysis.org -
Posted in Announcements, Anthropology, Archaeology of Computer Memory, Biology, Certification, Computer Science, Countefactual Debugging, Crash Analysis Report Environment (CARE), Crash Dump Analysis, Crash Dump Patterns, DebugWare Patterns, Debugging, Debugging Industry, Debugging Methodology, Debugging Trends, Dublin School of Security, EasyDbg, Economics, Escalation Engineering, Evolution, First Fault Problem Solving, Futuristic Memory Dump Analysis, General Memory Analysis, General Science, Geography, Hardware, Hermeneutics of Memory Dumps and Traces, History, Humanities, Language, Laws of Troubleshooting and Debugging, Logic, Malware Analysis, Malware Patterns, Mathematics of Debugging, Memiotics (Memory Semiotics), Memoretics, Memory Analysis Forensics and Intelligence, Memory Analysis Report System, Memory Dump Analysis and History, Memory Systems Language, Memory Visualization, Paleo-debugging, Pattern Models, Pattern Prediction, Physics, Psychology, Publishing, Science of Memory Dump Analysis, Science of Software Tracing, Security, Social Media, Social Sciences, Software Architecture, Software Behavior Patterns, Software Chorography, Software Chorology, Software Defect Construction, Software Engineering, Software Generalist, Software Maintenance Institute, Software Narrative Fiction, Software Narratology, Software Technical Support, Software Trace Analysis, Software Trace Analysis and History, Software Trace Deconstruction, Software Trace Linguistics, Software Trace Visualization, Software Troubleshooting Patterns, Software Victimology, Statistics, Structural Memory Analysis and Social Sciences, Structural Memory Patterns, Structural Trace Patterns, Systems Thinking, Testing, Tools, Trace Analysis Patterns, Troubleshooting Methodology, Unified Debugging Patterns, Uses of UML, Victimware, Virtualization, Visual Dump Analysis, Windows System Administration, Workaround Patterns | No Comments »
Friday, November 12th, 2010
Five volumes of cross-disciplinary Anthology (dubbed by the author “The Summa Memorianica”) lay the foundation of the scientific discipline of Memoretics (study of computer memory snapshots and their evolution in time) that is also called Memory Dump and Software Trace Analysis.ca
The 5th volume contains revised, edited, cross-referenced, and thematically organized selected DumpAnalysis.org blog posts about crash dump, software trace analysis and debugging written in February 2010 - October 2010 for software engineers developing and maintaining products on Windows platforms, quality assurance engineers testing software on Windows platforms, technical support and escalation engineers dealing with complex software issues, and security researchers, malware analysts and reverse engineers. The fifth volume features:
- 25 new crash dump analysis patterns
- 11 new pattern interaction case studies (including software tracing)
- 16 new trace analysis patterns
- 7 structural memory patterns
- 4 modeling case studies for memory dump analysis patterns
- Discussion of 3 common analysis mistakes
- Malware analysis case study
- Computer independent architecture of crash analysis report service
- Expanded coverage of software narratology
- Metaphysical and theological implications of memory dump worldview
- More pictures of memory space and physicalist art
- Classification of memory visualization tools
- Memory visualization case studies
- Close reading of the stories of Sherlock Holmes: Dr. Watson’s observational patterns
- Fully cross-referenced with Volume 1, Volume 2, Volume 3, and Volume 4
Product information:
- Title: Memory Dump Analysis Anthology, Volume 5
- Author: Dmitry Vostokov
- Language: English
- Product Dimensions: 22.86 x 15.24
- Paperback: 400 pages
- Publisher: Opentask (10 December 2010)
- ISBN-13: 978-1-906717-96-4
- Hardcover: 400 pages
- Publisher: Opentask (10 December 2010)
- ISBN-13: 978-1-906717-97-1

Back cover features memory space art image Hot Computation: Memory on Fire.
- Dmitry Vostokov @ DumpAnalysis.org + TraceAnalysis.org -
Posted in Aesthetics of Memory Dumps, Announcements, Archaeology of Computer Memory, Art, Assembly Language, Books, C and C++, CDF Analysis Tips and Tricks, Categorical Debugging, Common Mistakes, Complete Memory Dump Analysis, Computer Science, Crash Analysis Report Environment (CARE), Crash Dump Analysis, Crash Dump De-analysis, Crash Dump Patterns, Debugging, Debugging Methodology, Debugging Slang, Deep Down C++, Dr. Watson, Dublin School of Security, Education and Research, Escalation Engineering, Fun with Crash Dumps, Fun with Debugging, Fun with Software Traces, General Memory Analysis, Hermeneutics of Memory Dumps and Traces, Images of Computer Memory, Kernel Development, Malware Analysis, Malware Patterns, Mathematics of Debugging, Memiotics (Memory Semiotics), Memoidealism, Memoretics, Memory Analysis Culture, Memory Analysis Forensics and Intelligence, Memory Analysis Report System, Memory Diagrams, Memory Dreams, Memory Dump Analysis Jobs, Memory Dump Analysis Services, Memory Dump Analysis and History, Memory Dumps in Movies, Memory Dumps in Myths, Memory Religion (Memorianity), Memory Space Art, Memory Systems Language, Memory Visualization, Memory and Glitches, Memuonics, Metaphysical Society of Ireland, Minidump Analysis, Movies and Debugging, Multithreading, Museum of Debugging, Music for Debugging, Music of Computation, New Acronyms, New Words, Paleo-debugging, Pattern Models, Pattern Prediction, Philosophy, Physicalist Art, Psychoanalysis of Software Maintenance and Support, Publishing, Science of Memory Dump Analysis, Science of Software Tracing, Security, Software Architecture, Software Behavior Patterns, Software Chorography, Software Chorology, Software Defect Construction, Software Engineering, Software Generalist, Software Maintenance Institute, Software Narratology, Software Technical Support, Software Trace Analysis, Software Trace Analysis and History, Software Trace Deconstruction, Software Trace Reading, Software Trace Visualization, Software Tracing for Dummies, Software Troubleshooting Patterns, Software Victimology, Stack Trace Collection, Structural Memory Analysis and Social Sciences, Structural Memory Patterns, Structural Trace Patterns, Systems Thinking, Testing, Theology, Tool Objects, Tools, Trace Analysis Patterns, Training and Seminars, Troubleshooting Methodology, Uses of UML, Victimware, Virtualization, Vista, Visual Dump Analysis, Webinars, WinDbg Scripts, WinDbg Tips and Tricks, WinDbg for GDB Users, Windows 7, Windows Server 2008, Windows System Administration, Workaround Patterns, x64 Windows | No Comments »
Monday, October 11th, 2010
Tool Objects name was motivated by the title of the book Tool and Object: A History and Philosophy of Category Theory that I’m reading:

I realized that troubleshooting can be represented as a category of memory states (or collections of proximate states) as objects and troubleshooting tools as arrows.
We can also consider tools as categories with arrows as troubleshooting actions. In the latter case we can model a collection of tools and transformations (morphisms) between them as a functor.
- Dmitry Vostokov @ DumpAnalysis.org + TraceAnalysis.org -
Posted in Books, Categorical Debugging, History, Mathematics of Debugging, Tool Objects, Tools | No Comments »