Bugtation No.109
Tuesday, January 26th, 2010Symmetrical bugtation:
Delusion of “difference and repetition” in debugging.
- Dmitry Vostokov @ DumpAnalysis.org + TraceAnalysis.org -
Symmetrical bugtation:
Delusion of “difference and repetition” in debugging.
- Dmitry Vostokov @ DumpAnalysis.org + TraceAnalysis.org -
What happens when Hidden Output and Frozen Process patterns don’t help with annoying popup windows? The former can’t prevent windows from reappearing afresh and the latter could block other coupled processes that might exchange window messages with our suspended process or simply use any IPC mechanism. Here Axed Code pattern can help as demonstrated below. One process was frequently and briefly showing network disconnection message box or dialog. The problem is that it was also bringing its main window into foreground disrupting work in other windows because they were loosing focus. Next time the dialog appeared we found its process ID in Task Manager and attached WinDbg to it. We wasn’t sure what dialog function to intercept so we put a general breakpoint on all “Dialog” functions for all threads:
0:000:x86> bm *Dialog*

[...]

  6: 73a8ba81 @!"MFC80!CDialog::~CDialog"

  7: 73ac25e2 @!"MFC80!CPageSetupDialog::~CPageSetupDialog"

  8: 73a94b6b @!"MFC80!CDHtmlDialog::_AfxSimpleScanf"

  9: 73a8fbe9 @!"MFC80!CFileDialog::OnTypeChange"

 10: 73a90b17 @!"MFC80!CColorDialog::GetRuntimeClass"

 11: 73a8bb4a @!"MFC80!CDialog::CreateIndirect"

[...]

360: 73a93750 @!"MFC80!CDHtmlDialog::OnNavigateComplete"

361: 73a8f1f3 @!"MFC80!CCommonDialog::OnOK"

362: 73a95d9f @!"MFC80!CDHtmlDialog::GetDropTarget"

363: 73a90266 @!"MFC80!CPrintDialog::GetDevMode"

364: 73ac1514 @!"MFC80!COleInsertDialog::COleInsertDialog"

365: 73ac27c7 @!"MFC80!COlePropertiesDialog::COlePropertiesDialog"

366: 73a75282 @!"MFC80!CWnd::UpdateDialogControls"

367: 73a7fd86 @!"MFC80!CDialogBar::SetOccDialogInfo"
0:000:x86> g

Breakpoint 314 hit

MFC80!_AfxPostInitDialog:

73a7134e 55              push    ebp
0:000:x86> kL 100

ChildEBP RetAddr  Args to Child

0027ed2c 73a7180a MFC80!_AfxPostInitDialog

0027ed90 75628817 MFC80!_AfxActivationWndProc+0x90

0027edbc 7562898e USER32!InternalCallWinProc+0x23

0027ee34 7562c306 USER32!UserCallWinProcCheckWow+0x109

0027ee78 756375a2 USER32!SendMessageWorker+0x55b

0027ef4c 7563787a USER32!InternalCreateDialog+0xb64

0027ef70 75649b65 USER32!CreateDialogIndirectParamAorW+0x33

0027ef9c 75225192 USER32!CreateDialogParamA+0x4a

WARNING: Stack unwind information not available. Following frames may be wrong.

0027efc8 010c3bf1 DllA!WarningPopup+0×152

0027effc 73a71812 ProcessA+0×9fa1

00000000 00000000 MFC80!_AfxActivationWndProc+0×98
Now we cleared all breakpoints and put the new breakpoint on WarningPopup function:
0:000:x86> bc *
0:000:x86> bp DllA!WarningPopup
0:000:x86> g

Breakpoint 0 hit

DllA!WarningPopup:

75225040 51              push    ecx
Then we assumed that the calling convention was the default one used by C or C++ code like _cdecl and took the bold step to replace push ecx with ret instruction:
0:000:x86> a 75225040

75225040 ret

ret

75225041
0:000:x86> g

Breakpoint 0 hit

DllA!WarningPopup:

75225040 c3 ret
0:000:x86> bc *
0:000:x86> g
Result: no warning popups anymore.
I originally intended to name the pattern Patched Code but then realized that code axing can also be done at the source code level as a quick temporal fix.
- Dmitry Vostokov @ DumpAnalysis.org + TraceAnalysis.org -
Another workaround pattern for some problems is to freeze a process responsible for an annoying or excessive activity like in the case study: Debugger as a Shut Up Application. We can also use other tools for this purpose like Mark Russinovich’s PsSuspend. The suitable name for this pattern is Frozen Process.
- Dmitry Vostokov @ DumpAnalysis.org + TraceAnalysis.org -
After fighting HTML comments in Safari and Chrome (see the case study below) I came to an idea to name and catalog workaround patterns in troubleshooting and debugging. The first one is called Hidden Output. Sometimes we can just remove message boxes reporting minor problems and generating unnecessary support calls by hiding their windows, for example, by using CtxHideEx32. A different example is what I did today when troubleshooting Amazon aStore widget HTML code. It worked well in IE8:
However, in Apple Safari and Google Chrome the widget code was visible at the top of the page:
After a few unsuccessful attempts to debug the problem and faced with other pressing tasks I got a flash in my mind to hide the visible code by changing its color to be the same as its background:
<font color=”D3E7F4″><script type=”text/javascript”><!–

amazon_ad_tag=”crasdumpanala-20″;

amazon_ad_width=”728″;

amazon_ad_height=”90″;

amazon_color_background=”D3E7F4″;

amazon_color_border=”0000FF”;

amazon_color_logo=”FFFFFF”;

amazon_color_link=”0000FF”;

amazon_ad_logo=”hide”;

amazon_ad_link_target=”new”;

amazon_ad_border=”hide”;

amazon_ad_title=”OpenTask Books, Magazines and Notebooks”; //–></script>

<script type=”text/javascript” src=”http://www.assoc-amazon.com/s/asw.js”></script></font>
After that the picture became nicer:
- Dmitry Vostokov @ DumpAnalysis.org + TraceAnalysis.org -
After exciting results of the previous year of debugging it is time to announce modest plans for this year, 0×7DA:
Release the first beta version of EasyDbg
Release the first beta version of CARE (Crash Analysis Report Environment) for a pattern-driven debugger log analyzer with standards for structured audience-driven reports
Release the first beta version of STARE (Software Trace Analysis Report Environment) for a pattern-driven software trace analyzer with corresponding standards for structured audience-driven reports
Publish the following books on dump analysis that address different audiences (general users, system administrators, support and escalation engineers, testers, software engineers, security and software defect researchers):
- Windows Debugging Notebook
- Crash Dump Analysis for System Administrators and Support Engineers
- Memory Dump Analysis Anthology, Volume 4
- Memory Dump Analysis Anthology, Volume 5
- Memory Dump Analysis Anthology Color Supplement
- Principles of Memory Dump Analysis
- My Computer Crashes and Freezes: A Non-technical Guide to Software and Hardware Errors
- Linux, FreeBSD and Mac OS X Debugging: Practical Foundations
- Encyclopedia of Crash Dump Analysis Patterns
- WinDbg In Use: Debugging Exercises
Publish articles related to memory dump analysis in Debugged! magazine
Update WinDbg Poster and Cards
- Dmitry Vostokov @ DumpAnalysis.org + TraceAnalysis.org -
Having considered computational threads as braided strings and after discerning several software trace analysis patterns (just the beginning) we can see formatted and tabulated software trace output in a new light and employ the “fabric of traces” and braid metaphors for an Adjoint Thread concept. This new concept was motivated by reading about Extended Phenotype (*) and extensive analysis of Citrix ETW-based CDF traces using CDFAnalyzer. The term Adjoint was borrowed from mathematics because the concept we discuss below resembles this metaphorical formula: (Thread A, B) = [A, Thread B]. Let me first illustrate adjoint threading using simplified trace tables. Consider this generalized software trace example (date and time column is omitted for visual clarity):
|
# |
Source Dir |
PID |
TID |
File Name |
Function |
Message |
|
1 |
\src\subsystemA |
2792 |
5676 |
file1.cpp |
fooA |
Message text… |
|
2 |
\src\subsystemA |
2792 |
5676 |
file1.cpp |
fooA |
Message text… |
|
3 |
\src\subsystemA |
2792 |
5676 |
file1.cpp |
fooA |
Message text… |
|
4 |
\src\lib |
2792 |
5680 |
file2.cpp |
barA |
Message text… |
|
5 |
\src\subsystemA |
2792 |
5680 |
file1.cpp |
fooA |
Message text… |
|
6 |
\src\subsystemA |
2792 |
5676 |
file1.cpp |
fooA |
Message text… |
|
7 |
\src\lib |
2792 |
5680 |
file2.cpp |
fooA |
Message text… |
|
8 |
\src\lib |
2792 |
5680 |
file2.cpp |
fooA |
Message text… |
|
9 |
\src\subsystemB |
2792 |
3912 |
file3.cpp |
barB |
Message text… |
|
10 |
\src\subsystemB |
2792 |
3912 |
file3.cpp |
barB |
Message text… |
|
11 |
\src\subsystemB |
2792 |
3912 |
file3.cpp |
barB |
Message text… |
|
12 |
\src\subsystemB |
2792 |
3912 |
file3.cpp |
barB |
Message text… |
|
13 |
\src\subsystemB |
2792 |
3912 |
file3.cpp |
barB |
Message text… |
|
14 |
\src\subsystemB |
2792 |
3912 |
file3.cpp |
barB |
Message text… |
|
15 |
\src\subsystemB |
2792 |
2992 |
file4.cpp |
fooB |
Message text… |
|
16 |
\src\subsystemB |
2792 |
3008 |
file4.cpp |
fooB |
Message text… |
|
… |
… |
… |
… |
… |
… |
… |
We see several threads in a process PID 2792. In CDFAnalyzer we can filter trace messages that belong to any column and if we filter by TID we get a view of any Thread of Activity. However, each thread can “run” through any source directory, file name or function. If a function belongs to a library multiple threads would access it. This source location (can be considered as a subsystem), file or function view of activity is called an Adjoint Thread. For example, if we filter only subsystemA column in the trace above we get this table:
|
# |
Source Dir |
PID |
TID |
File Name |
Function |
Message |
|
1 |
\src\subsystemA |
2792 |
5676 |
file1.cpp |
fooA |
Message … |
|
2 |
\src\subsystemA |
2792 |
5676 |
file1.cpp |
fooA |
Message … |
|
3 |
\src\subsystemA |
2792 |
5676 |
file1.cpp |
fooA |
Message … |
|
5 |
\src\subsystemA |
2792 |
5680 |
file1.cpp |
fooA |
Message … |
|
6 |
\src\subsystemA |
2792 |
5676 |
file1.cpp |
fooA |
Message … |
|
7005 |
\src\subsystemA |
2792 |
5664 |
file1.cpp |
fooA |
Message … |
|
10198 |
\src\subsystemA |
2792 |
5664 |
file1.cpp |
fooA |
Message … |
|
10364 |
\src\subsystemA |
2792 |
5664 |
file1.cpp |
fooA |
Message … |
|
10417 |
\src\subsystemA |
2792 |
5664 |
file1.cpp |
fooA |
Message … |
|
10420 |
\src\subsystemA |
2792 |
5676 |
file1.cpp |
fooA |
Message … |
|
10422 |
\src\subsystemA |
2792 |
5680 |
file1.cpp |
fooA |
Message … |
|
10587 |
\src\subsystemA |
2792 |
5664 |
file1.cpp |
fooA |
Message … |
|
10767 |
\src\subsystemA |
2792 |
5680 |
file1.cpp |
fooA |
Message … |
|
11126 |
\src\subsystemA |
2792 |
5668 |
file1.cpp |
fooA |
Message … |
|
11131 |
\src\subsystemA |
2792 |
5680 |
file1.cpp |
fooA |
Message … |
|
11398 |
\src\subsystemA |
2792 |
5676 |
file1.cpp |
fooA |
Message … |
|
11501 |
\src\subsystemA |
2792 |
5668 |
file1.cpp |
fooA |
Message … |
|
11507 |
\src\subsystemA |
2792 |
5668 |
file1.cpp |
fooA |
Message … |
|
11509 |
\src\subsystemA |
2792 |
5664 |
file1.cpp |
fooA |
Message … |
|
11513 |
\src\subsystemA |
2792 |
5680 |
file1.cpp |
fooA |
Message … |
|
11524 |
\src\subsystemA |
2792 |
5668 |
file1.cpp |
fooA |
Message … |
|
… |
… |
… |
… |
… |
… |
… |
We can graphically view subsystemA as a braid string that “permeates the fabric of threads”:
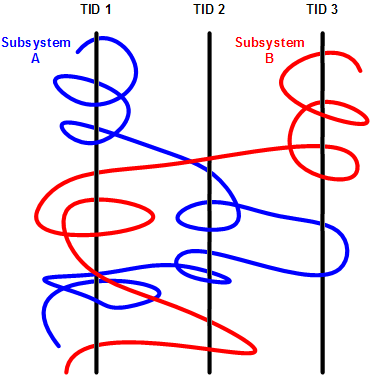
We can get many different braids by changing filters, hence multibraiding. Here is another example of a driver source file view initially permeating 2 process contexts and 4 threads:
|
# |
Source Dir |
PID |
TID |
File Name |
Function |
Message |
|
41 |
\src\sys\driver |
3636 |
3848 |
entry.c |
DriverEntry |
IOCTL … |
|
80 |
\src\sys\driver |
3636 |
3896 |
entry.c |
DriverEntry |
IOCTL … |
|
99 |
\src\sys\driver |
3636 |
3896 |
entry.c |
DriverEntry |
IOCTL … |
|
102 |
\src\sys\driver |
3636 |
3896 |
entry.c |
DriverEntry |
IOCTL … |
|
179 |
\src\sys\driver |
3636 |
3896 |
entry.c |
DriverEntry |
IOCTL … |
|
180 |
\src\sys\driver |
3636 |
3896 |
entry.c |
DriverEntry |
IOCTL … |
|
311 |
\src\sys\driver |
3636 |
3896 |
entry.c |
DriverEntry |
IOCTL … |
|
447 |
\src\sys\driver |
3636 |
3896 |
entry.c |
DriverEntry |
IOCTL … |
|
448 |
\src\sys\driver |
3636 |
3896 |
entry.c |
DriverEntry |
IOCTL … |
|
457 |
\src\sys\driver |
2792 |
5108 |
entry.c |
DriverEntry |
IOCTL … |
|
608 |
\src\sys\driver |
3636 |
3896 |
entry.c |
DriverEntry |
IOCTL … |
|
614 |
\src\sys\driver |
3636 |
3896 |
entry.c |
DriverEntry |
IOCTL … |
|
655 |
\src\sys\driver |
3636 |
3896 |
entry.c |
DriverEntry |
IOCTL … |
|
675 |
\src\sys\driver |
3636 |
3896 |
entry.c |
DriverEntry |
IOCTL … |
|
678 |
\src\sys\driver |
3636 |
3896 |
entry.c |
DriverEntry |
IOCTL … |
|
680 |
\src\sys\driver |
3636 |
3896 |
entry.c |
DriverEntry |
IOCTL … |
|
681 |
\src\sys\driver |
3636 |
3896 |
entry.c |
DriverEntry |
IOCTL … |
|
1145 |
\src\sys\driver |
3636 |
4960 |
entry.c |
DriverEntry |
IOCTL … |
|
1153 |
\src\sys\driver |
3636 |
4960 |
entry.c |
DriverEntry |
IOCTL … |
|
1154 |
\src\sys\driver |
3636 |
4960 |
entry.c |
DriverEntry |
IOCTL … |
|
… |
… |
… |
… |
… |
… |
… |
(*) A bit of digression. Looks like biology keeps giving insights into software, there is even a software phenotype metaphor albeit a bit restricted to code, I just thought that we need also an Extended Software Phenotype.
- Dmitry Vostokov @ DumpAnalysis.org + TraceAnalysis.org -
Just noticed on Amazon tabs:

What is so special today? I come back to check again on 14th of February :-)
- Dmitry Vostokov @ DumpAnalysis.org + TraceAnalysis.org -
The Year of Debugging, 0×7D9, was a remarkable year for DumpAnalysis.org. Here is the list of achievements to report:
- Software Trace Analysis as a new discipline with its own set of patterns
- Unification of Memory Dump Analysis with Software Trace Analysis (DA+TA)
- New computer memory dump-based art movements: Opcodism and Physicalist Art
- Discovery of 3D computer memory visualization techniques
- Establishing Software Maintenance Institute
- Broadening software fault injection as Software Defect Construction discipline
- Establishing a new profession of a Software Defect Researcher
- Starting ambitious Dictionary of Debugging
- Publishing Windows Debugging: Practical Foundations book
- Publishing the first x86-free Windows debugging book: x64 Windows Debugging: Practical Foundations
- Establishing the new debugging magazine: Debugged! MZ/PE
- Publishing Memory Dump Analysis Anthology, Volume 3
- Cooperation with OpenTask to promote First Fault Software Problem Solving book
- Establishing Debugging Expert(s) Magazine Online
- Creating the first development process for debugging and software troubleshooting tools: RADII
- Publishing the first pattern-driven memory dump analysis troubleshooting methodology as a foundation for software debugging
- Proposal for an International Memory Analysts and Debuggers Day
- Almost completed Windows Debugging Notebook to be published soon
Now DumpAnalysis.org focuses on The Year of Dump Analysis, 0×7DA, as a foundation for the forthcoming debugging decade and reveals future plans this weekend.
I’m sure that many other organizations and individuals have no less remarkable accomplishments to report for 2009. I promise to track down and write about some of them in the forthcoming book:
The Science of Dr. Watson: An Illustrated History of Debugging (ISBN: 978-1906717070)
- Dmitry Vostokov @ DumpAnalysis.org + TraceAnalysis.org -
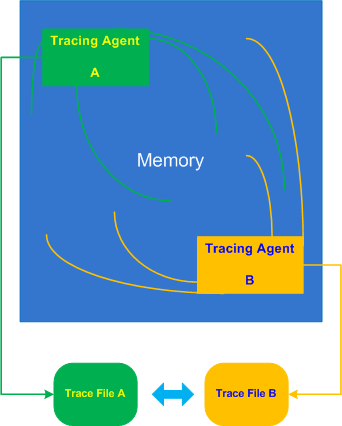
Inter-Correlation pattern is analogous to the previously described Intra-Correlation pattern but involves several traces from possibly different trace agents recorded (most commonly) at the same time or during an overlapping time interval:
Let’s look at a typical example of an application subclassing windows to add additional look and feel element to its GUI or thjat hooks into window messaging. Suppose this application also records important trace points like window parameters before and after subclassing using ETW technology (Event Tracing for Windows). When we run the application in terminal services environment all windows (including other processes) are shown with an incorrect dimension. We therefore request the application trace and in addition WindowHistory trace to see how coordinates of all windows are changed over time. We easily find some Basic Facts in both traces such as window class name or time but it looks like window handle is different. In another set of traces recorded for comparison we have same window handle values, class name is absent from the ETW trace but a process and thread ID for the same window handle are different. We, therefore, don’t see a correlation between these traces and suspect that both traces in 2 sets were recorded in different terminal sessions, for example:
ETW trace:
#      PID   TID   Time          Message

[…]

46750  5890  6960  10:17:18.825  Subclassing, handle=0×100B8, class=MyWindowClass, […]

[…]
WindowHistory trace:
Handle: 0001006E Class: “MyWindowClass” Title: “”

Captured at: 10:17:19:637

   Process ID: 19e0

Thread ID: 16e4

Parent: 0

Screen position (l,t,r,b): (-2,896,1282,1026)

Client rectangle (l,t,r,b): (0,0,1276,122)

Visible: true

Window placement command: SW_SHOWNORMAL

Foreground: false

HungApp: false

Minimized: false

Maximized: false

[…]
- Dmitry Vostokov @ TraceAnalysis.org -
Being an aspiring SF delayed-writer I was curious about the usage of memory dump concept in science fiction. Here’s a selection of sentence fragments that give some picture (a few are from fiction not SF) and I plan to analyze it further in another part. Some phrases are funny for me but you decide which of them for yourself (I even ordered one fiction and two SF books from the list below):
A Fire Upon The Deep (Zones of Thought) by Vernor Vinge
“the environment programs will likely have a bizarre crash-atmosphere dump, thermal runaway, anything.”
A Nepenthean Solution by Rod Rogers
“Their computers started misbehaving very badly. Random data dumps, crashes, disk wipes, that type of thing.”
Sex, Drugs, & Rock & Roll! by Charles A Brobst
“it’s possible to dump bios and crash the systems.”
Down and Out in the Magic Kingdom by Cory Doctorow
“Just switch on guest access and I’ll core-dump it to you. It’s wild.”
Interface by Neal Stephenson and J. Frederick George
“We’re going to do a core dump on this whole night. Zeldo said ‘Analyze it’”
Champions of the Force (Star Wars: The Jedi Academy Trilogy, Volume 3) by Kevin J. Anderson
“Complete core dump of all the Maw’s backup computer files.”
The Mandalorian Armor (Star Wars: The Bounty Hunter Wars, Book 1) by K.W. Jeter
“he could do a core dump and take everything back to his own ship”
More Than Honor (Honor Harrington) by David Weber
“Rerouting, cross-connections, garbled text, crossed order-response loops, spontaneous memory core dumps … Nothing working the way it should.”
Futures from Nature by Henry Gee
“My toaster had a core dump and wouldn’t boot up”
Endgame: A Novel (Doom #4) by Dafydd ab Hugh and Brad Linaweaver
“The Data Pastiche did not give us sufficient information. We must study the core-dump.”
Newton’s Wake: A Space Opera by Ken MacLeod
“a big clue, but not definitive. So we took a core dump.”
Mindstar Rising by Peter F. Hamilton
“O’Donal fed the Trojan an activation code keyed to the core’s dump order.”
Worlds in Collision: Star Trek (Star Trek: the Original Series) and Memory Prime (Star Trek, No 42) by Judith Reeves-Stevens and Garfield Reeves-Stevens
“the interface team will commence an unscheduled emergency core dump as an essential test of the system’s backup integrity.”
Spinward Fringe Resurrection And Awakening by Randolph Lalonde
“I’m going to find one of the computer cores and dump you inside.”
Nothing Sacred: A Novel by Tom Flynn
“‘Ship’s thought engines are in core dump,’ Hinsin cried. ‘The Onesie’s probing them aggressively. They’re spewing information’”
X-Universe Volume One by Darren Astles and Steve Miller
“a core-dump and re-write of the Al algorithms”
Nshalain Troubles: The Return (Volume 3) by Bob Horton
“If necessary we could even do a core dump through a transposer link”
Second Chances by Susan Shwartz
“He could do a core dump in his sleep, but never had.”
Soul of the Algorithm by Norbert Weissinger
“By the way, we had a core dump on PIDs Two thirty- eight and Two thirty-nine.”
God Behind the Firewall by Anirban Ray
“The operating system kernel had crashed - it was a core dump. I wondered what kind of an operating system it was”
A Real Boy by Heather Breo
“unit was connected to a large processor so that a core dump could be performed. This would include all accrued memory.”
A Chip Called Wanda by J. L. Kerry
“the system computer until lie could crash it, initiating a core dump, in which the horrified system processor would frantically write important data to several files during its death throes.”
The Enemy Papers by Barry B Longyear
“began setting up the sequence to dump the memory cores.”
Chaos and Rage by Frank Tinsman
“I’m doing a core dump and it won’t even give me a status bar”
Alien Parable by Khezla Durr
“When the information came through it was like the core dump on a computer. It came through so fast”
ANIMA: a novel about Second Life by Dalian Hansen
“You have to go in for another complete core dump.”
Hammerjack by Marc D. Giller
“memory dump was in progress. The core was wiping itself clean”
HeadSpace by Paul Barrows
“eyes staring into the virtual gateway of the RAM dump core, head lolling involuntarily as his fingers worked the mechanism.”
Blood and Fire by David Gerrold
“We’ll dump a copy of the core into one of our transmitters and let them decode it”
Dragon Drive: A Comedia Mundana: Volume 1: The Finger of God by Wayne Richards
“by telephone lines, not yet, but we can send him core dumps via radio, over the comsat links, can’t we?”
The Armies of Memory (Thousand Cultures) by John Barnes
“Shan was dumping my short-term memory into his”
The Ghost Brigades by John Scalzi
“his sudden memory dump”
The Ultimate Hitchhiker’s Guide to the Galaxy by Douglas Adams
“He pulled out a small memory dump module”
Pandora’s Star by Peter F. Hamilton
“You left with him four days after your last memory dump in the Kirova Clinic’s secure store.”
Marque and Reprisal (Vatta’s War) by Elizabeth Moon
“It was bad they had to do a memory dump off my implant”
Star Strike (The Inheritance Trilogy, Book 1) by Ian Douglas
“They wouldn’t need to ask her questions or elicit her cooperation; all they’d need to do was pull a full memory dump.”
“‘Sarha, how’s the memory dump coming on?’ ‘No problems, Joshua. The bitek array is accepting’”
Spin State by Chris Moriarty
“a mere memory dump an interactive tutorial triggered by her entry into the memory palace”
Foundation and Chaos: The Second Foundation Trilogy (Foundation Trilogy Series) by Greg Bear
“With Daneel’s frequent memory dumps and adjustments,”
Sphere by Michael Crichton
“It’s got to be a memory dump from somewhere inside our own computer system.”
A Time to Be Born (Star Trek The Next Generation) by John Vornholt
“His memory dump was almost at the present day”
Undertow by Elizabeth Bear
“memory to dump yet and Security will download whatever’s in there”
Kiln People (The Kiln Books) by David Brin
“Irene here has been duplicating so heavily, taking full memory dumps from every ditto she makes, that she’s reached a limit”
Quarantine by Greg Egan
“it isn’t present in any of my stolen memory dumps.”
The Ship Who Searched (The Ship Series) by Anne McCaffrey and Mercedes Lackey
“She triggered memory-dump, and everything came over in compressed mode”
The Callahan Chronicals by Spider Robinson
“file memory dump, sending information in a block rather than bit by bit”
The Wellstone by Wil McCarthy
“And with the Palace Guard’s memory dump you’re the most famous of all”
Whole Wide World by Paul McAuley
“I can reboot and rebuild him from the last memory dump, but it’ll take a little while.”
Pashazade by Jon Courtenay Grimwood
“digiLux so old it had a separate flash unit and came minus a removable memory dump which was where Dr Dee came in”
The Great Book of Amber: The Complete Amber Chronicles, 1-10 (Chronicles of Amber) by Roger Zelazny
“You can’t dump its memory or kill its power from a remote terminal.”
The Best of All Possible Wars by Larry Niven
“they’ll follow it come core-collapse or memory dump;”
The Worthing Saga by Orson Scott Card
“We dump the memories back into your head as soon as you come out”
Playgrounds of the Mind by Larry Niven
“Signal for a memory dump, see what can be retrieved.”
Alien Taste (Ukiah Oregon, Book 1) by Wen Spencer
“To grow that much, the mouse would have to dump its memory storage.”
Firedance by Steven Barnes
“My last memory dump was before the raid”
Worldmakers: SF Adventures in Terraforming by Gardner Dozois
“I’d search memory dumps to find where souls might be kept”
Glasshouse by Charles Stross
“I emigrated to Zemlya right after my previous memory dump.”
Two to the Fifth (Xanth) by Piers Anthony
“It’s a real memory dump.”
Dreaming Down-Under by Jack Dann and Janeen Webb
“That’s what’s inhibiting the near-memory dump.”
Before the Storm (Star Wars: The Black Fleet Crisis, Book 1) by Michael P. Kube-Mcdowell
“Droids will dump their memory data under sensor-torture.”
WebMage (Ravirn, Book 1) by Kelly McCullough
“That’s probably the upload cycle, when it dumps its memory back to the server.”
Midnight at the Well of Souls by Jack L. Chalker
“You forgot to dump the computer memory when you closed up.”
Redrobe by Jon Courtenay Grimwood
“the one who purchased some kid to use as a memory dump”
X-Men - The Last Stand by Chris Claremont
“No sign whatsoever that been wounded If only he could dump the sense memories of those hurts as”
Metaplanetary: A Novel of Interplanetary Civil War by Tony Daniel
“Every day, to dump her memories in the form of a sentence or two”
The Purple Spacebunny (Volume 02) by Clarence E. Shellito II
“In computer terms, he was doing a memory dump and compressing the math in his mind to lock it”
This Place Only by Walter G. Klimczak
“The first stage included a memory splice. The second a partial data purge. A memory dump.”
The Worldwrights by Max Grant
“I was able to pick up some of their history while the memory dump went through me on its way to the manekine.”
Alien Revelation by Tony Ruggiero
“He thought of it as a memory dump and as a form of therapy.”
Genetic Suicide by James Cooper
“Yes, think of it as a selective memory dump.”
A Great Circle: The Mayfield Trilogy by Reynolds Price
“again as if to gouge one more memorial in this memory dump.”
Cross Purposes by Gary C. Gibson
“facsimile clones built in hurry up growth tanks. Electron-scripted memory dumps gave them something to think, A list personality and entertainment”
Shanghai Dream by Sahr Johnny
“The memory dump cuts to the front of the school.”
Elysian Fields by Drew Dale Daniel Bryenton
“which led to a biolab full of clone tanks and memory-dump modules.”
Cubicle Farm Fantasy: An Indian IT worker’s dream about escaping the rat race by Ranjit Sankar
“reading memory dumps and providing technical leadership to a bunch of bozos”
Infinity Plus by Keith Brooke and Nick Gevers
“A simula plus full memory dump will tie up most of my processing power.”
Sin’s Doorway and Other Ominous Entrances: The Selected Stories of Manly Wade Wellman (Volume 4) by Manly Wade Wellman
“consciously used me as a dump for his memories.”
ReBody by Clive Warner
“No other solution. EMP damages my network too. I can dump memory into magnetic stores, isolate all processors”
The Light by J Powers
“On the monitor screen flashed dumps of memory, neural net models, machine code, the innermost workings of the supercomputer operating system”
Fools’ Experiments by Edward M. Lerner
“I’m ready to stop reading these damn memory dumps. Let the little imps go back to it.”
Echoes of Earth by Sean Williams and Shane Dix
“to accept her final memory dump if she did.”
Fallen Host by Lyda Morehouse
“I had all my memories ready to dump, and I still couldn’t do it. Then the idea hit me”
LifeQuest: Dozens of Stories about Cryonics, Uploading, and other Transhuman Adventures by Fred Chamberlain, Linda Chamberlain, Thomas Donaldson, and Lee Corbin
“Map their memory centers, dump the data in a neuro-simulator and use artificial intelligence to to index topics”
Redemption Ark (Revelation Space) by Alastair Reynolds
“would make it so much easier if he could just dump his memories directly-but the other Conjoiner ’s neural blockades were secure.”
An Isaac Asimov Robot Mystery: Mirage (Isaac Asimov’s Robot Mystery) by Mark W. Tiedemann
“I want a memory dump set up, too-we need to download the RI for study.”
How Precious Was That While by Piers Anthony
“you don’t want to clutter your memory with them. For example, if that person was your sibling, you can dump that memory right there.”
Tangent by Robert G. Ferrell
“figure out some way of getting at least one full memory dump from her.”
THE FLIGHT of the SOLAR ARCHANGEL by Rod Rogers
“Yeah, yeah, yeah. All right, dump memory and we’ll scan it line by line.”
Death Match by Lincoln Child
“It appears to be a successful memory dump”
Presentations Plus by David A. Peoples
“first two minutes. Then we stand up we go to memory location ‘x,’ open our mouth and do a ‘memory dump’.”
Full Circle by Danielle Steel
“Dump the memory. And move on.”
MindFlossing: 100% Pure From Concentrate by Jakob Wahlberg
“Did you ever do a memory dump and debug?”
Love’s Illusions by Ceria Mackonvitz and Alina Ardeleanu Igna
“I need a brain dump. A memory dump. To clear my head up. Clear my head away.”
Harmonescape by Rick Leinheuser
“my jittery smile masking the memory dump going on behind my probing eyes. The jig was up.”
The Micah Files by Robert Pirie
“It sounds like you’re doing a memory dump. Robert continued assuring her of its relevancy.”
Journey Out From The Mundane Shell by Anthony Doyle
“we recognize a place in time, it has become a memory dump,”
Humour the Computer by Andrew J. Davison
“A memory dump follows.”
No Outward Sign by Bill Neugent
“A memory dump, in case you hit any self-destruct routines.”
Hazard 666: A New Meaning for Terror by Paul Landry
“see if he could preoccupy the robot so it would dump memory and not remember what it did.”
Biotechnology Is Murder: A Ben Candidi Mystery (Ben Candidi Mysteries) by Dirk Wyle
“Careful, you don’t want to dump the memory.”
Omaha by Caoimhghin Ó Catháin
“Let me dump its memory then you can tell me which numbers are drug related.”
Satan’s Touch by Forrest Carlyle
“Just a dump of system memory so I can debug.”
You Have to Be Careful in the Land of the Free by James Kelman
“I had a bus and a plane to catch, and memories to dump; memories to dump.”
The Bug by Ellen Ullman
“unconditional program death, producing no core file, no dump of the program’s memory state.”
Evening Song: Òran Feasgair by Randolph Waugh
“a law that would make a memory dump mandatory, you would have access to history in its entirety”
Storm Killer by Benjamin Blue
“the technician had commanded the computer to freeze its memory and not reuse any memory that had recently been used and released back to the system. The tech had done a copy dump of the entire memory and he’s now manually reviewing the contents of each piece of frozen storage”
remember to BLINK by Jason Heim
“I print out the memory dump, which uses up four reams of paper.”
Bystander by Maksim Gorky and Bernard G. Guerney
“Come, now, Tanya, search a bit in the dump of your memory.”
- Dmitry Vostokov @ DumpAnalysis.org -
Just noticed that Amazon introduced additional daily updated tabs for book categories. MDAA volumes are in top 10 ”Most Gifted” and “Most Wished For” Debugging and Assembly Language titles (today). Volume 3 is featured as a Hot New Release:
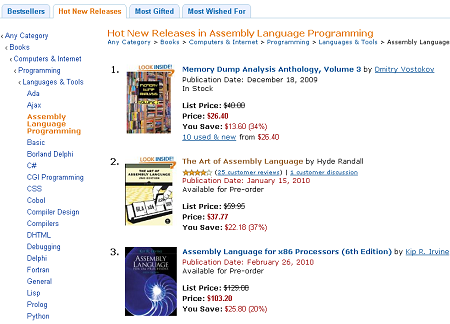
I assume ”Most Gifted” is about “gift wrapping” when you order a book ![]()
- Dmitry Vostokov @ DumpAnalysis.org -
Today found a CD in my old case (the link I give is for MP3 though):
Ancient Journeys: A Vision Of The New World

Here’s my version of track titles:
1. Discovering the Interface
2. Conquering the New Space
3. Frozen System
4. MS DOS
5. Russian OS
6. The Journeys of RIP
7. The Spiking Threads
8. Not Enough Space
9. Against Bugs
- Dmitry Vostokov @ DumpAnalysis.org -
After the installation of a DVD-ROM software coming from Longman Dictionary of Contemporary English for Advanced Learners I tried to launch it and my x64 system was totally frozen. I couldn’t even generate a complete memory dump via a keyboard (during troubleshooting I also discovered that I needed to manually set CrashDumpEnabled value under HKLM \ S \ CCS \ C \ CrashControl to 1 in order to enable complete memory dumps on my W2K8 system and on the next day the arrived 16.4 issue of NT Insider explained me why it was so). Scheduling NotMyFault tool to run 1 minute later after the freeze didn’t help either. So I dug out a dusty null-modem cable and connected it to my freezing W2K8 box (target) and x64 W2K3 box (host). The kernel debugger was already enabled on the problem computer because I used to frequently do local kernel debugging: memory inspection while reading Windows Internals book. The target computer showed satisfactory boot parameters:
C:\Users\Administrator>BCDEdit /dbgsettings

debugtype               Serial

debugport               1

baudrate                115200
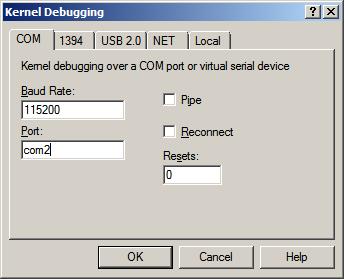
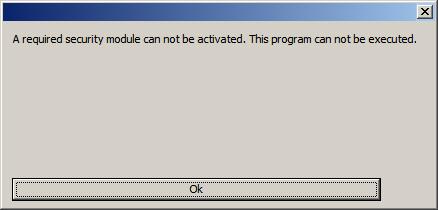
So I launched x64 WinDbg on the host and tried to connect to COM2 but got an error message:
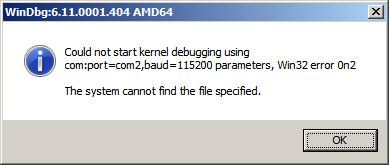
Then I tried to connect to COM1 and it was a success (attaching a cable to two COM ports is like a flip coin game):
Microsoft (R) Windows Debugger Version 6.10.0003.233 AMD64

Copyright (c) Microsoft Corporation. All rights reserved.
Opened \\.\com1

Waiting to reconnect...
When I launched the English dictionary the target system became frozen but on the host system WinDbg became connected:
Connected to Windows 7 6002 x64 target at (Wed Jan  6 20:28:57.734 2010 (GMT+0)), ptr64 TRUE

Kernel Debugger connection established.

Symbol search path is: SRV*c:\websymbols*http://msdl.microsoft.com/download/symbols

Windows 7 Kernel Version 6002 (Service Pack 2) MP (2 procs) Free x64

Product: Server, suite: Enterprise TerminalServer SingleUserTS

Built by: 6002.18082.amd64fre.vistasp2_gdr.090803-2339

Kernel base = 0xfffff800`01813000 PsLoadedModuleList = 0xfffff800`019d7dd0

Debug session time: Wed Jan  6 20:33:41.584 2010 (GMT+0)

System Uptime: 0 days 0:30:50.694

Break instruction exception - code 80000003 (first chance)
* You are seeing this message because you pressed the SysRq/PrintScreen key on your test machine's keyboard.

*

* THIS IS NOT A BUG OR A SYSTEM CRASH

*

* If you did not intend to break into the debugger, press the "g" key, then press the "Enter" key now.  This message might immediately reappear.  If it does, press "g" and "Enter" again.
nt!RtlpBreakWithStatusInstruction:

fffff800`018676f0 cc              int     3
0: kd> g

The context is partially valid. Only x86 user-mode context is available.

WOW64 single step exception - code 4000001e (first chance)

First chance exceptions are reported before any exception handling.

This exception may be expected and handled.

00000000`006661d8 812f00500000    sub     dword ptr [edi],5000h
32.1: kd:x86> !analyze -v

Connected to Windows 7 6002 x64 target at (Wed Jan  6 20:40:16.359 2010 (GMT+0)), ptr64 TRUE
FAULTING_IP:

ldoce5+2661d8

00000000`006661d8 812f00500000    sub     dword ptr [edi],5000h
EXCEPTION_RECORD:  ffffffffffffffff -- (.exr 0xffffffffffffffff)

ExceptionAddress: 00000000006661d8 (ldoce5+0x00000000002661d8)

   ExceptionCode: 4000001e (WOW64 single step exception)

  ExceptionFlags: 00000000

NumberParameters: 0
BUGCHECK_STR: 4000001e
DEFAULT_BUCKET_ID: APPLICATION_FAULT
ERROR_CODE: (NTSTATUS) 0x4000001e - Exception status code used by Win32 x86 emulation subsystem.
EXCEPTION_CODE: (Win32) 0x4000001e (1073741854) - <Unable to get error code text>
NTGLOBALFLAG: 400
FAULTING_THREAD: 0000000000000002
LAST_CONTROL_TRANSFER: from 0000000000000000 to 00000000006661d8
STACK_TEXT:

00000000 00000000 00000000 00000000 00000000 ldoce5+0x2661d8
STACK_COMMAND: kb
FOLLOWUP_IP:

ldoce5+2661d8

00000000`006661d8 812f00500000    sub     dword ptr [edi],5000h
SYMBOL_STACK_INDEX: 0
SYMBOL_NAME: ldoce5+2661d8
FOLLOWUP_NAME: MachineOwner
MODULE_NAME: ldoce5
IMAGE_NAME: ldoce5.exe
DEBUG_FLR_IMAGE_TIMESTAMP: 48b86455
BUCKET_ID: X64_4000001e_ldoce5+2661d8
PRIMARY_PROBLEM_CLASS: APPLICATION_FAULT
FAILURE_BUCKET_ID: APPLICATION_FAULT_4000001e_ldoce5.exe!Unknown
Followup: MachineOwner

---------
Unfortunately, I wasn’t able to resume the system after the first chance exception:
32.1: kd:x86> g

The context is partially valid. Only x86 user-mode context is available.

WOW64 single step exception - code 4000001e (first chance)

First chance exceptions are reported before any exception handling.

This exception may be expected and handled.

ldoce5+0x2661d8:

00000000`006661d8 812f00500000    sub     dword ptr [edi],5000h
Even the usual trick of sxd or sxi commands didn’t help either (probably because of single-step mode). The 32-bit raw stack had this fragment of exception processing residue:
00000000`0136ae8c  0136af74

00000000`0136ae90  00000001

00000000`0136ae94  0136af0c

00000000`0136ae98  77b12062 ntdll_77ad0000!RtlDispatchException+0x1b2

00000000`0136ae9c  0136af24

00000000`0136aea0  0136af74

00000000`0136aea4  00000000

00000000`0136aea8  00000000

00000000`0136aeac  00000000

00000000`0136aeb0  00000000

00000000`0136aeb4  00000000

00000000`0136aeb8  00000000

00000000`0136aebc  00000000

00000000`0136aec0  00000000

00000000`0136aec4  00000000

00000000`0136aec8  00000000

00000000`0136aecc  00000000

00000000`0136aed0  00000000

00000000`0136aed4  00000000

00000000`0136aed8  00000000

00000000`0136aedc  00000000

00000000`0136aee0  00000000

00000000`0136aee4  00000000

00000000`0136aee8  00000000

00000000`0136aeec  00000000

00000000`0136aef0  00000000

00000000`0136aef4  00000000

00000000`0136aef8  00000000

00000000`0136aefc  00000000

00000000`0136af00  01380000

00000000`0136af04  01361000

00000000`0136af08  01000000

00000000`0136af0c  0136b254

00000000`0136af10  77aee49f ntdll_77ad0000!KiUserExceptionDispatcher+0xf

00000000`0136af14  77b197ba ntdll_77ad0000!ZwContinue+0×12

00000000`0136af18  77aee4ad ntdll_77ad0000!KiUserExceptionDispatcher+0×1d

00000000`0136af1c  0136af74

00000000`0136af20  00000000

00000000`0136af24  c000001d

00000000`0136af28  00000000

00000000`0136af2c  00000000

00000000`0136af30  006661af ldoce5+0×2661af

00000000`0136af34  00000000

00000000`0136af38  00000000

00000000`0136af3c  00000000
The exception code c000001d is about illegal instruction:
32.1: kd:x86> !error c000001d

Error code: (NTSTATUS) 0xc000001d (3221225501) - {EXCEPTION}  Illegal Instruction  An attempt was made to execute an illegal instruction.
The following stack trace corresponded to the exception record:
32.1: kd:x86> .cxr 0136af74

eax=007fc400 ebx=00e1c000 ecx=00b64230 edx=00000400 esi=00000000 edi=00bc2784

eip=006661b1 esp=0136b240 ebp=0136b254 iopl=0 nv up ei pl nz na po nc

cs=0023 ss=002b ds=002b es=002b fs=0053 gs=002b efl=00010202

ldoce5+0x2661b1:

00000000`006661b1 eb07       jmp     ldoce5+0x2661ba (006661ba)
32.1: kd:x86> kv

  *** Stack trace for last set context - .thread/.cxr resets it

ChildEBP          RetAddr           Args to Child

WARNING: Stack unwind information not available. Following frames may be wrong.

0136b254 00529002 00cf43b8 00000001 00e1c000 ldoce5+0x2661b1

0136b2a8 0055d184 00000000 00000000 00000000 ldoce5+0x129002

0137f930 77b02c91 76ac4de8 00000000 77b02ae8 ldoce5+0x15d184

0137fe3c 00dbf2d0 00b52dd0 7efde000 00bb9168 ntdll_77ad0000!LdrGetDllHandleEx+0x34c

0137feac 0096eeb5 00000001 036a1498 036a14e0 ldoce5+0x9bf2d0

0137ff94 77b4d24d 7efde000 76ac4ba4 00000000 ldoce5+0x56eeb5

0137ffd4 77b4d45f 00b56c80 7efde000 ffffffff ntdll_77ad0000!__RtlUserThreadStart+0x23

0137ffec 00000000 00b56c80 7efde000 00000000 ntdll_77ad0000!_RtlUserThreadStart+0x1b
Then suddenly a lightning bolt stroke my head! Complete system freeze… May be enabled kernel debugger on the target system was activated when I was launching the English dictionary? The system was then waiting for a debugger to connect… So I rebooted the target:
32.1: kd:x86> .reboot

Shutdown occurred at (Wed Jan  6 22:26:47.828 2010 (GMT+0))...unloading all symbol tables.

Waiting to reconnect...
and quickly disabled debug mode:
C:\Users\Administrator>BCDEdit /debug OFF

The operation completed successfully.
After that I was able to launch the English dictionary! My first hypothesis was that the process somehow generated an exception in WOW64 that triggered the kernel debugger. The belief was reinforced when I attached WinDbg to a running process instance and saw the continuous stream of exceptions:
(11c0.bc4): Unknown exception - code 0eedfade (first chance)

(11c0.bc4): Unknown exception - code 0eedfade (first chance)

(11c0.bc4): Unknown exception - code 0eedfade (first chance)

(11c0.bc4): Unknown exception - code 0eedfade (first chance)

(11c0.bc4): Unknown exception - code 0eedfade (first chance)

(11c0.bc4): Unknown exception - code 0eedfade (first chance)

(11c0.bc4): Unknown exception - code 0eedfade (first chance)

(11c0.bc4): Unknown exception - code 0eedfade (first chance)

(11c0.bc4): Unknown exception - code 0eedfade (first chance)

(11c0.bc4): Unknown exception - code 0eedfade (first chance)

(11c0.bc4): Unknown exception - code 0eedfade (first chance)

(11c0.bc4): Unknown exception - code 0eedfade (first chance)

(11c0.bc4): Unknown exception - code 0eedfade (first chance)

(11c0.bc4): Unknown exception - code 0eedfade (first chance)
However, to my surprise, when I restarted the process, the following DRM dialog appeared:
CommandLine: "C:\Program Files (x86)\Longman\LDOCE5\ldoce5.exe"

Executable search path is:

ModLoad: 00000000`00400000 00000000`00e7c000   image00000000`00400000

ModLoad: 00000000`77980000 00000000`77b06000   ntdll.dll

ModLoad: 00000000`77b40000 00000000`77ca0000   ntdll32.dll

ModLoad: 00000000`75ab0000 00000000`75af5000   C:\Windows\system32\wow64.dll

ModLoad: 00000000`75a60000 00000000`75aae000   C:\Windows\system32\wow64win.dll

ModLoad: 00000000`759b0000 00000000`759b9000   C:\Windows\system32\wow64cpu.dll

(1364.da8): Break instruction exception - code 80000003 (first chance)

ntdll!DbgBreakPoint:

00000000`779c6060 cc              int     3
0:000> g

ModLoad: 00000000`77850000 00000000`7797d000   WOW64_IMAGE_SECTION

ModLoad: 00000000`77670000 00000000`77780000   WOW64_IMAGE_SECTION

ModLoad: 00000000`77850000 00000000`7797d000   NOT_AN_IMAGE

ModLoad: 00000000`77780000 00000000`7784d000   NOT_AN_IMAGE

ModLoad: 00000000`77670000 00000000`77780000   C:\Windows\syswow64\kernel32.dll

ModLoad: 00000000`30000000 00000000`30027000   C:\Program Files (x86)\Longman\LDOCE5\nspr4.dll

ModLoad: 00000000`768a0000 00000000`76966000   C:\Windows\syswow64\ADVAPI32.dll

ModLoad: 00000000`75da0000 00000000`75e90000   C:\Windows\syswow64\RPCRT4.dll

ModLoad: 00000000`75b10000 00000000`75b70000   C:\Windows\syswow64\Secur32.dll

ModLoad: 00000000`72ee0000 00000000`72ee7000   C:\Windows\SysWOW64\WSOCK32.dll

ModLoad: 00000000`75c60000 00000000`75c8d000   C:\Windows\syswow64\WS2_32.dll

ModLoad: 00000000`76140000 00000000`761ea000   C:\Windows\syswow64\msvcrt.dll

ModLoad: 00000000`767c0000 00000000`767c6000   C:\Windows\syswow64\NSI.dll

ModLoad: 00000000`75180000 00000000`751b2000   C:\Windows\SysWOW64\WINMM.dll

ModLoad: 00000000`775a0000 00000000`77670000   C:\Windows\syswow64\USER32.dll

ModLoad: 00000000`76970000 00000000`76a00000   C:\Windows\syswow64\GDI32.dll

ModLoad: 00000000`76200000 00000000`76345000   C:\Windows\syswow64\ole32.dll

ModLoad: 00000000`75d10000 00000000`75d9d000   C:\Windows\syswow64\OLEAUT32.dll

ModLoad: 00000000`74eb0000 00000000`74ee9000   C:\Windows\SysWOW64\OLEACC.dll

ModLoad: 00000000`00020000 00000000`00027000   C:\Program Files (x86)\Longman\LDOCE5\plc4.dll

ModLoad: 00000000`76a00000 00000000`77510000   C:\Windows\syswow64\SHELL32.dll

ModLoad: 00000000`76360000 00000000`763b9000   C:\Windows\syswow64\SHLWAPI.dll

ModLoad: 00000000`759a0000 00000000`759a8000   C:\Windows\SysWOW64\VERSION.dll

(1364.da8): WOW64 breakpoint - code 4000001f (first chance)

First chance exceptions are reported before any exception handling.

This exception may be expected and handled.

ntdll32!DbgBreakPoint:

77b50004 cc              int     3
0:000:x86> g

ModLoad: 766e0000 76740000   C:\Windows\SysWOW64\IMM32.DLL

ModLoad: 767d0000 76898000   C:\Windows\syswow64\MSCTF.dll

ModLoad: 76350000 76359000   C:\Windows\syswow64\LPK.DLL

ModLoad: 75c90000 75d0d000   C:\Windows\syswow64\USP10.dll

ModLoad: 755f0000 7578e000   C:\Windows\WinSxS\x86_microsoft.windows.common-controls_[ ... ]_6.0.6002.18005_none_[ ... ]\ comctl32.dll

ModLoad: 73b20000 73b39000   C:\Windows\SysWOW64\IPHLPAPI.dll

ModLoad: 73ae0000 73b15000   C:\Windows\SysWOW64\dhcpcsvc.DLL

ModLoad: 73ab0000 73adc000   C:\Windows\SysWOW64\DNSAPI.dll

ModLoad: 73aa0000 73aa7000   C:\Windows\SysWOW64\WINNSI.DLL

ModLoad: 73a70000 73a92000   C:\Windows\SysWOW64\dhcpcsvc6.DLL

ModLoad: 761f0000 761f7000   C:\Windows\syswow64\psapi.dll

ModLoad: 00000000`70860000 00000000`708d4000   C:\Windows\SysWOW64\Riched20.dll

ModLoad: 00000000`10000000 00000000`10011000   C:\Users\ADMINI~1\AppData\Local\Temp\drm_dialogs.dll

ModLoad: 00000000`73810000 00000000`73890000   C:\Windows\SysWOW64\UxTheme.dll
So I had to quit my debugger in order not to interfere with the all mighty Mr. DRM and possible anti-debugging techniques. At least the problem was found and resolved. I was able to use the English dictionary I purchased from Amazon UK (*).
Note: additional purchasing info is recommended to add to discource when discussing DRM issues.
- Dmitry Vostokov @ DumpAnalysis.org -
Some practical engineers asked me how do Debugged! MZ/PE magazine back covers look like from a birds eye view:
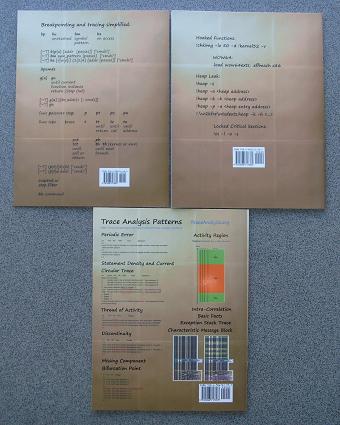
One engineer even commented that they look better and better (counterclockwise) :-)
- Dmitry Vostokov @ DumpAnalysis.org -
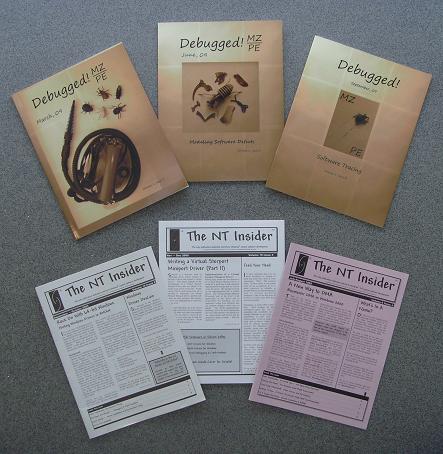
If you know any other please let us know. For example, MSDN is great too, there was also a Visual C++-oriented magazine I used to read in the past. May be it is still in print. I plan to make a wider perspective picture later on. Both pictured magazines (Debugged! MZ/PE and NT Insider) are mainly oriented towards unmanaged and native code respectively (the former with a timeless computer science slant) but Debugged! soon to cover native, virtualized, interpreted and managed code environments too and aims to become a “Complete Debugging Magazine” similar to kernel vs. user process vs. complete memory dump file differences.
- Dmitry Vostokov @ DumpAnalysis.org -
Sometimes a single memory dump analysis session requires an analysis of several memory dump files, for example, comparative analysis of a memory leak issue or several dumps saved to check the consistency of a stack trace and exception address. In the past I used to open every individual memory dump file separately: multiple dumps - multiple WinDbg process instances. Recently I discovered a WinDbg command that allows me to keep several memory dumps open in the same WinDbg instance and share the single command window: .opendump. After opening a memory dump we need to type g to finish its load. Then we can use || selector to switch between memory dumps similar to ~ command we use to switch between threads in user process memory dumps or processors in kernel and complete memory dumps. Here is an example:
Microsoft (R) Windows Debugger Version 6.11.0001.404 AMD64

Copyright (c) Microsoft Corporation. All rights reserved.

Loading Dump File [C:\MemoryDumps\1MbNop.exe.2972.dmp]

User Mini Dump File with Full Memory: Only application data is available
Windows Server 2008/Windows Vista Version 6002 (Service Pack 2) MP (2 procs) Free x64

Product: Server, suite: Enterprise TerminalServer SingleUserTS

Debug session time: Mon Sep 28 21:49:16.000 2009 (GMT+0)

System Uptime: 0 days 5:34:37.445

Process Uptime: 0 days 0:00:03.000
This dump file has a breakpoint exception stored in it.

The stored exception information can be accessed via .ecxr.

1MbNop+0x101011:

00000001`40101011 cc              int     3
0:000> .opendump c:\MemoryDumps\1MbPause.exe.3488.dmp
Loading Dump File [c:\MemoryDumps\1MbPause.exe.3488.dmp]

User Mini Dump File with Full Memory: Only application data is available
Opened 'c:\MemoryDumps\1MbPause.exe.3488.dmp'
||0:0:000> g

Windows Server 2008/Windows Vista Version 6002 (Service Pack 2) MP (2 procs) Free x64

Product: Server, suite: Enterprise TerminalServer SingleUserTS

Debug session time: Mon Sep 28 21:49:23.000 2009 (GMT+0)

System Uptime: 0 days 5:34:44.410

Process Uptime: 0 days 0:00:01.000
This dump file has a breakpoint exception stored in it.

The stored exception information can be accessed via .ecxr.

1MbPause+0x201011:

00000001`40201011 cc              int     3
||1:1:001> kL

Child-SP          RetAddr           Call Site

00000000`0012ff58 00000000`7704be3d 1MbPause+0x201011

00000000`0012ff60 00000000`77256a51 kernel32!BaseThreadInitThunk+0xd

00000000`0012ff90 00000000`00000000 ntdll!RtlUserThreadStart+0x1d
||1:1:001> ||0s

1MbNop+0x101011:

00000001`40101011 cc              int     3
||0:0:000> kL

Child-SP          RetAddr           Call Site

00000000`0012ff58 00000000`7704be3d 1MbNop+0x101011

00000000`0012ff60 00000000`77256a51 kernel32!BaseThreadInitThunk+0xd

00000000`0012ff90 00000000`00000000 ntdll!RtlUserThreadStart+0x1d
- Dmitry Vostokov @ DumpAnalysis.org -
When looking at complete memory dumps and switching between process contexts we are usually interested in loaded user space modules, their timestamps, version information, vendor and description. lmt and lmv WinDbg commands show both user space and kernel space modules and it becomes annoying to see the same kernel modules over and over again in the output. The following commands list only user and kernel space modules separately: lmu and lmk. Here is an example:
lkd> !process

PROCESS fffffa80056b0c10

SessionId: 1  Cid: 0f6c    Peb: 7fffffdf000  ParentCid: 0a10

DirBase: 34b2b000  ObjectTable: fffff88009796470  HandleCount:  80.

Image: windbg.exe

VadRoot fffffa80056000a0 Vads 82 Clone 0 Private 5884. Modified 2109. Locked 1.

DeviceMap fffff88008c7e9c0

Token                             fffff8800bb3fa70

ElapsedTime                       00:01:27.560

UserTime                          00:00:00.000

KernelTime                        00:00:00.000

QuotaPoolUsage[PagedPool]         176696

QuotaPoolUsage[NonPagedPool]      7984

Working Set Sizes (now,min,max)  (7860, 50, 345) (31440KB, 200KB, 1380KB)

PeakWorkingSetSize                7860

VirtualSize                       110 Mb

PeakVirtualSize                   110 Mb

PageFaultCount                    10117

MemoryPriority                    BACKGROUND

BasePriority                      8

CommitCharge                      6293
THREAD fffffa8005648790  Cid 0f6c.096c  Teb: 000007fffffdd000 Win32Thread: fffff900c21ef450 WAIT: (WrUserRequest) UserMode Non-Alertable

   fffffa80056692a0  SynchronizationEvent
THREAD fffffa800557c300 Cid 0f6c.0eb8 Teb: 000007fffffdb000 Win32Thread: fffff900c06402a0 RUNNING on processor 1
lkd> lmu

start             end                 module name

00000000`6d660000 00000000`6d943000   ext

00000000`6d950000 00000000`6ddac000   dbgeng

00000000`6e120000 00000000`6e191000   exts

00000000`6e1a0000 00000000`6e309000   dbghelp

00000000`6ed20000 00000000`6ed6c000   symsrv

00000000`6ed70000 00000000`6edb4000   kext

00000000`76da0000 00000000`76ecd000   kernel32

00000000`76ed0000 00000000`76f9d000   USER32

00000000`76fa0000 00000000`77126000   ntdll

00000001`3f530000 00000001`3f5de000   windbg

000007fe`f3f00000 000007fe`f40c3000   kdexts

000007fe`f4600000 000007fe`f46b8000   MSFTEDIT

000007fe`fb760000 000007fe`fb7b1000   UxTheme

000007fe`fc200000 000007fe`fc24f000   OLEACC

000007fe`fc250000 000007fe`fc289000   WINMM

000007fe`fc4e0000 000007fe`fc6d9000   COMCTL32

000007fe`fc6f0000 000007fe`fc6fb000   VERSION

000007fe`fd370000 000007fe`fd389000   MPR

000007fe`fd4f0000 000007fe`fd5c3000   OLEAUT32

000007fe`fd5d0000 000007fe`fd7a8000   ole32

000007fe`fda00000 000007fe`fda2d000   IMM32

000007fe`fda30000 000007fe`fda3d000   LPK

000007fe`fda40000 000007fe`fdb83000   RPCRT4

000007fe`fdb90000 000007fe`fdc03000   SHLWAPI

000007fe`fde10000 000007fe`fde9c000   COMDLG32

000007fe`fdea0000 000007fe`feaf3000   SHELL32

000007fe`feb00000 000007fe`feb64000   GDI32

000007fe`fecf0000 000007fe`fedf8000   ADVAPI32

000007fe`fee00000 000007fe`fee9c000   msvcrt

000007fe`fefc0000 000007fe`ff0c2000   MSCTF

000007fe`ff180000 000007fe`ff21a000   USP10
lkd> lmk

start             end                 module name

fffff800`0181c000 fffff800`01d34000   nt

fffff800`01d34000 fffff800`01d7a000   hal

fffff960`00020000 fffff960`002d4000   win32k

fffff960`00420000 fffff960`0043e000   dxg

fffff960`006e0000 fffff960`006ea000   TSDDD

fffff960`008e0000 fffff960`008e9000   framebuf

fffffa60`00602000 fffffa60`0060c000   kdcom

fffffa60`0060c000 fffffa60`00647000   mcupdate_GenuineIntel

fffffa60`00647000 fffffa60`0065b000   PSHED

fffffa60`0065b000 fffffa60`006b8000   CLFS

fffffa60`006b8000 fffffa60`0076a000   CI

fffffa60`00786000 fffffa60`007d6000   msrpc

fffffa60`007d6000 fffffa60`007fa000   ataport

fffffa60`00800000 fffffa60`009c3000   NDIS

fffffa60`009c3000 fffffa60`009d3000   PCIIDEX

fffffa60`009d3000 fffffa60`009e6000   mountmgr

fffffa60`00a0d000 fffffa60`00a66000   NETIO

fffffa60`00a66000 fffffa60`00b40000   Wdf01000

fffffa60`00b40000 fffffa60`00b4e000   WDFLDR

fffffa60`00b4e000 fffffa60`00b7e000   pci

fffffa60`00b7e000 fffffa60`00b92000   volmgr

fffffa60`00b92000 fffffa60`00bf8000   volmgrx

fffffa60`00c00000 fffffa60`00ced000   HDAudBus

fffffa60`00ced000 fffffa60`00d09000   cdrom

fffffa60`00d09000 fffffa60`00d42000   msiscsi

fffffa60`00d43000 fffffa60`00d4c000   WMILIB

fffffa60`00d4c000 fffffa60`00d7a000   SCSIPORT

fffffa60`00d7a000 fffffa60`00dd0000   acpi

fffffa60`00dd0000 fffffa60`00dda000   msisadrv

fffffa60`00dda000 fffffa60`00def000   partmgr

fffffa60`00def000 fffffa60`00df7000   intelide

fffffa60`00df7000 fffffa60`00dff000   atapi

fffffa60`00e0b000 fffffa60`00e52000   fltmgr

fffffa60`00e52000 fffffa60`00ed9000   ksecdd

fffffa60`00ed9000 fffffa60`00ee5000   tunnel

fffffa60`00ee5000 fffffa60`00ef8000   intelppm

fffffa60`00ef8000 fffffa60`00f06000   vgapnp

fffffa60`00f06000 fffffa60`00f2b000   VIDEOPRT

fffffa60`00f2b000 fffffa60`00f3b000   watchdog

fffffa60`00f3b000 fffffa60`00f47000   usbuhci

fffffa60`00f47000 fffffa60`00f8d000   USBPORT

fffffa60`00f8d000 fffffa60`00f9e000   usbehci

fffffa60`00f9e000 fffffa60`00fd7000   b57nd60a

fffffa60`00fd7000 fffffa60`00ff3000   parport

fffffa60`0100b000 fffffa60`01181000   tcpip

fffffa60`01181000 fffffa60`011ad000   fwpkclnt

fffffa60`011ad000 fffffa60`011c1000   disk

fffffa60`011c1000 fffffa60`011ed000   CLASSPNP

fffffa60`0120f000 fffffa60`0138f000   Ntfs

fffffa60`0138f000 fffffa60`013d3000   volsnap

fffffa60`013d3000 fffffa60`013db000   spldr

fffffa60`013db000 fffffa60`013ed000   mup

fffffa60`013ed000 fffffa60`013f7000   crcdisk

fffffa60`02209000 fffffa60`02266000   storport

fffffa60`02266000 fffffa60`02273000   TDI

fffffa60`02273000 fffffa60`02296000   rasl2tp

fffffa60`02296000 fffffa60`022a2000   ndistapi

fffffa60`022a2000 fffffa60`022d3000   ndiswan

fffffa60`022d3000 fffffa60`022e3000   raspppoe

fffffa60`022e3000 fffffa60`02301000   raspptp

fffffa60`02301000 fffffa60`02319000   rassstp

fffffa60`02319000 fffffa60`023b3000   rdpdr

fffffa60`023b3000 fffffa60`023c6000   termdd

fffffa60`023c6000 fffffa60`023d4000   kbdclass

fffffa60`023d4000 fffffa60`023e0000   mouclass

fffffa60`023e0000 fffffa60`023e1480   swenum

fffffa60`023e2000 fffffa60`023fd000   smb

fffffa60`0240b000 fffffa60`0243f000   ks

fffffa60`0243f000 fffffa60`0244a000   mssmbios

fffffa60`0244a000 fffffa60`0245a000   umbus

fffffa60`0245a000 fffffa60`024a2000   usbhub

fffffa60`024a2000 fffffa60`024b6000   NDProxy

fffffa60`024b6000 fffffa60`024ff000   HdAudio

fffffa60`024ff000 fffffa60`0253a000   portcls

fffffa60`0253a000 fffffa60`0255d000   drmk

fffffa60`0255d000 fffffa60`02562180   ksthunk

fffffa60`02563000 fffffa60`0256d000   Fs_Rec

fffffa60`0256d000 fffffa60`02576000   Null

fffffa60`02581000 fffffa60`02588b80   HIDPARSE

fffffa60`02589000 fffffa60`02597000   vga

fffffa60`02597000 fffffa60`025a0000   RDPCDD

fffffa60`025a0000 fffffa60`025a9000   rdpencdd

fffffa60`025a9000 fffffa60`025b4000   Msfs

fffffa60`025b4000 fffffa60`025c5000   Npfs

fffffa60`025c5000 fffffa60`025ce000   rasacd

fffffa60`025ce000 fffffa60`025eb000   tdx

fffffa60`02e0d000 fffffa60`02e78000   afd

fffffa60`02e78000 fffffa60`02ebc000   netbt

fffffa60`02ebc000 fffffa60`02eda000   pacer

fffffa60`02eda000 fffffa60`02ee9000   netbios

fffffa60`02f06000 fffffa60`02f21000   wanarp

fffffa60`02f21000 fffffa60`02f6e000   rdbss

fffffa60`02f6e000 fffffa60`02f7a000   nsiproxy

fffffa60`02f7a000 fffffa60`02f97000   dfsc

fffffa60`02f97000 fffffa60`02fa0000   hidusb

fffffa60`02fa0000 fffffa60`02fb2000   HIDCLASS

fffffa60`02fb2000 fffffa60`02fb3e00   USBD

fffffa60`02fb4000 fffffa60`02fbf000   kbdhid

fffffa60`02fbf000 fffffa60`02fca000   mouhid

fffffa60`02fca000 fffffa60`02fd8000   crashdmp

fffffa60`02fd8000 fffffa60`02fe4000   dump_dumpata

fffffa60`02fe4000 fffffa60`02fec000   dump_atapi

fffffa60`02fec000 fffffa60`02ff8000   Dxapi

fffffa60`03a00000 fffffa60`03a22000   luafv

fffffa60`03a22000 fffffa60`03a2a000   psxdrv

fffffa60`03a2a000 fffffa60`03a3e000   lltdio

fffffa60`03a3e000 fffffa60`03a56000   rspndr

fffffa60`03a56000 fffffa60`03a74000   bowser

fffffa60`03a74000 fffffa60`03a8e000   mpsdrv

fffffa60`03a8e000 fffffa60`03ab5000   mrxdav

fffffa60`03ab5000 fffffa60`03ade000   mrxsmb

fffffa60`03ade000 fffffa60`03b27000   mrxsmb10

fffffa60`03b27000 fffffa60`03b46000   mrxsmb20

fffffa60`03b46000 fffffa60`03be9000   HTTP

fffffa60`04400000 fffffa60`0449a000   spsys

fffffa60`0449a000 fffffa60`04550000   peauth

fffffa60`04550000 fffffa60`0455b000   secdrv

fffffa60`0455b000 fffffa60`04584000   srvnet

fffffa60`04584000 fffffa60`04594000   tcpipreg

fffffa60`04594000 fffffa60`045c6000   srv2

fffffa60`0480d000 fffffa60`0489e000   srv

fffffa60`0489e000 fffffa60`048a9000   asyncmac

fffffa60`048a9000 fffffa60`048c5000   cdfs

fffffa60`048c5000 fffffa60`048cd000   kldbgdrv
Unloaded modules:

fffffa60`01200000 fffffa60`0120e000   crashdmp.sys

fffffa60`011ed000 fffffa60`011f9000   dump_ataport.sys

fffffa60`013f7000 fffffa60`013ff000   dump_atapi.sys

fffffa60`02ee9000 fffffa60`02f06000   serial.sys

fffffa60`02576000 fffffa60`02581000   kbdhid.sys

fffffa60`00c0f000 fffffa60`00d43000   sptd.sys

fffffa60`0076a000 fffffa60`00786000   sacdrv.sys
Of course, verbose equivalents also work: lmuv and lmkv.
- Dmitry Vostokov @ DumpAnalysis.org -
Google Analytics shows the following crash dump analysis pattern frequencies to be fully analyzed later next week:
|
Page |
Pageviews |
|
http://www.dumpanalysis.org/blog/index.php/2006/10/30/crash-dump-analysis-patterns-part-1/ |
8086 |
|
http://www.dumpanalysis.org/blog/index.php/2006/10/31/crash-dump-analysis-patterns-part-2/ |
7709 |
|
http://www.dumpanalysis.org/blog/index.php/2007/07/20/crash-dump-analysis-patterns-part-17/ |
6131 |
|
http://www.dumpanalysis.org/blog/index.php/2007/04/03/crash-dump-analysis-patterns-part-11/ |
5000 |
|
http://www.dumpanalysis.org/blog/index.php/2008/03/13/crash-dump-analysis-patterns-part-2b/ |
4651 |
|
http://www.dumpanalysis.org/blog/index.php/2007/02/09/crash-dump-analysis-patterns-part-9a/ |
3881 |
|
http://www.dumpanalysis.org/blog/index.php/2008/01/24/crash-dump-analysis-patterns-part-43/ |
3782 |
|
http://www.dumpanalysis.org/blog/index.php/2008/06/12/crash-dump-analysis-patterns-part-59b/ |
3666 |
|
http://www.dumpanalysis.org/blog/index.php/2007/12/17/crash-dump-analysis-patterns-part-41b/ |
3446 |
|
http://www.dumpanalysis.org/blog/index.php/2007/08/06/crash-dump-analysis-patterns-part-20a/ |
3190 |
|
http://www.dumpanalysis.org/blog/index.php/2007/11/02/crash-dump-analysis-patterns-part-13c/ |
2785 |
|
http://www.dumpanalysis.org/blog/index.php/2007/02/02/crash-dump-analysis-patterns-part-8/ |
2673 |
|
http://www.dumpanalysis.org/blog/index.php/2007/06/21/crash-dump-analysis-patterns-part-16a/ |
2629 |
|
http://www.dumpanalysis.org/blog/index.php/2007/09/14/crash-dump-analysis-patterns-part-27/ |
2461 |
|
http://www.dumpanalysis.org/blog/index.php/2006/11/01/crash-dump-analysis-patterns-part-3/ |
2442 |
|
http://www.dumpanalysis.org/blog/index.php/2008/04/28/crash-dump-analysis-patterns-part-6a/ |
2377 |
|
http://www.dumpanalysis.org/blog/index.php/2008/04/03/crash-dump-analysis-patterns-part-57/ |
2376 |
|
http://www.dumpanalysis.org/blog/index.php/2008/03/18/crash-dump-analysis-patterns-part-13e/ |
2279 |
|
http://www.dumpanalysis.org/blog/index.php/2007/09/11/crash-dump-analysis-patterns-part-26/ |
2264 |
|
http://www.dumpanalysis.org/blog/index.php/2006/12/18/crash-dump-analysis-patterns-part-6/ |
2257 |
|
http://www.dumpanalysis.org/blog/index.php/2007/09/10/crash-dump-analysis-patterns-part-25/ |
2185 |
|
http://www.dumpanalysis.org/blog/index.php/2007/10/17/crash-dump-analysis-patterns-part-31/ |
2126 |
|
http://www.dumpanalysis.org/blog/index.php/2008/10/15/crash-dump-analysis-patterns-part-1b/ |
1982 |
|
http://www.dumpanalysis.org/blog/index.php/2007/07/15/crash-dump-analysis-patterns-part-13b/ |
1891 |
|
http://www.dumpanalysis.org/blog/index.php/2007/08/19/crash-dump-analysis-patterns-part-23a/ |
1846 |
|
http://www.dumpanalysis.org/blog/index.php/2007/08/19/crash-dump-analysis-patterns-part-20b/ |
1699 |
|
http://www.dumpanalysis.org/blog/index.php/2006/12/15/crash-dump-analysis-patterns-part-5/ |
1520 |
|
http://www.dumpanalysis.org/blog/index.php/2007/12/12/crash-dump-analysis-patterns-part-41a/ |
1511 |
|
http://www.dumpanalysis.org/blog/index.php/2007/07/28/crash-dump-analysis-patterns-part-9c/ |
1485 |
|
http://www.dumpanalysis.org/blog/index.php/2007/11/21/crash-dump-analysis-patterns-part-37/ |
1457 |
|
http://www.dumpanalysis.org/blog/index.php/2007/05/09/crash-dump-analysis-patterns-part-13a/ |
1388 |
|
http://www.dumpanalysis.org/blog/index.php/2007/05/11/crash-dump-analysis-patterns-part-14/ |
1366 |
|
http://www.dumpanalysis.org/blog/index.php/2007/07/03/crash-dump-analysis-patterns-part-9b/ |
1336 |
|
http://www.dumpanalysis.org/blog/index.php/2007/11/05/crash-dump-analysis-patterns-part-33/ |
1314 |
|
http://www.dumpanalysis.org/blog/index.php/2008/04/09/crash-dump-analysis-patterns-part-58a/ |
1293 |
|
http://www.dumpanalysis.org/blog/index.php/2007/11/29/crash-dump-analysis-patterns-part-9d/ |
1213 |
|
http://www.dumpanalysis.org/blog/index.php/2008/06/10/crash-dump-analysis-patterns-part-16b/ |
1213 |
|
http://www.dumpanalysis.org/blog/index.php/2008/07/11/crash-dump-analysis-patterns-part-71/ |
1156 |
|
http://www.dumpanalysis.org/blog/index.php/2008/05/20/crash-dump-analysis-patterns-part-61/ |
1131 |
|
http://www.dumpanalysis.org/blog/index.php/2007/12/19/crash-dump-analysis-patterns-part-42b/ |
1063 |
|
http://www.dumpanalysis.org/blog/index.php/2008/02/27/crash-dump-analysis-patterns-part-53/ |
1061 |
|
http://www.dumpanalysis.org/blog/index.php/2007/01/24/crash-dump-analysis-patterns-part-7/ |
1031 |
|
http://www.dumpanalysis.org/blog/index.php/2008/10/25/crash-dump-analysis-patterns-part-9e/ |
1016 |
|
http://www.dumpanalysis.org/blog/index.php/2007/07/22/crash-dump-analysis-patterns-part-19/ |
998 |
|
http://www.dumpanalysis.org/blog/index.php/2007/11/23/crash-dump-analysis-patterns-part-39/ |
979 |
|
http://www.dumpanalysis.org/blog/index.php/2007/08/25/crash-dump-analysis-patterns-part-23b/ |
955 |
|
http://www.dumpanalysis.org/blog/index.php/2008/02/04/crash-dump-analysis-patterns-part-13d/ |
948 |
|
http://www.dumpanalysis.org/blog/index.php/2007/10/15/crash-dump-analysis-patterns-part-30/ |
923 |
|
http://www.dumpanalysis.org/blog/index.php/2008/10/21/crash-dump-analysis-patterns-part-77/ |
905 |
|
http://www.dumpanalysis.org/blog/index.php/2006/11/03/crash-dump-analysis-patterns-part-4/ |
889 |
|
http://www.dumpanalysis.org/blog/index.php/2007/07/20/crash-dump-analysis-patterns-part-18/ |
879 |
|
http://www.dumpanalysis.org/blog/index.php/2007/04/20/crash-dump-analysis-patterns-part-5b/ |
870 |
|
http://www.dumpanalysis.org/blog/index.php/2007/04/20/crash-dump-analysis-patterns-part-12/ |
820 |
|
http://www.dumpanalysis.org/blog/index.php/2007/05/24/crash-dump-analysis-patterns-part-15/ |
798 |
|
http://www.dumpanalysis.org/blog/index.php/2007/11/20/crash-dump-analysis-patterns-part-31a/ |
769 |
|
http://www.dumpanalysis.org/blog/index.php/2008/04/29/crash-dump-analysis-patterns-part-60/ |
758 |
|
http://www.dumpanalysis.org/blog/index.php/2008/02/19/crash-dump-analysis-patterns-part-51/ |
714 |
|
http://www.dumpanalysis.org/blog/index.php/2007/11/22/crash-dump-analysis-patterns-part-38/ |
712 |
|
http://www.dumpanalysis.org/blog/index.php/2008/03/11/crash-dump-analysis-patterns-part-55/ |
702 |
|
http://www.dumpanalysis.org/blog/index.php/2007/12/14/crash-dump-analysis-patterns-part-42a/ |
693 |
|
http://www.dumpanalysis.org/blog/index.php/2008/02/13/crash-dump-analysis-patterns-part-49/ |
678 |
|
http://www.dumpanalysis.org/blog/index.php/2008/04/22/crash-dump-analysis-patterns-part-59/ |
676 |
|
http://www.dumpanalysis.org/blog/index.php/2009/01/05/crash-dump-analysis-patterns-part-13f/ |
624 |
|
http://www.dumpanalysis.org/blog/index.php/2007/08/30/crash-dump-analysis-patterns-part-24/ |
621 |
|
http://www.dumpanalysis.org/blog/index.php/2008/02/12/crash-dump-analysis-patterns-part-48/ |
619 |
|
http://www.dumpanalysis.org/blog/index.php/2008/06/24/crash-dump-analysis-patterns-part-67/ |
618 |
|
http://www.dumpanalysis.org/blog/index.php/2007/10/23/crash-dump-analysis-patterns-part-32/ |
616 |
|
http://www.dumpanalysis.org/blog/index.php/2008/02/28/crash-dump-analysis-patterns-part-54/ |
611 |
|
http://www.dumpanalysis.org/blog/index.php/2008/02/22/crash-dump-analysis-patterns-part-52/ |
610 |
|
http://www.dumpanalysis.org/blog/index.php/2008/06/06/crash-dump-analysis-patterns-part-63/ |
596 |
|
http://www.dumpanalysis.org/blog/index.php/2007/08/12/crash-dump-analysis-patterns-part-21/ |
576 |
|
http://www.dumpanalysis.org/blog/index.php/2008/06/25/crash-dump-analysis-patterns-part-67b/ |
547 |
|
http://www.dumpanalysis.org/blog/index.php/2007/12/10/crash-dump-analysis-patterns-part-40a/ |
531 |
|
http://www.dumpanalysis.org/blog/index.php/2007/11/14/crash-dump-analysis-patterns-part-36/ |
529 |
|
http://www.dumpanalysis.org/blog/index.php/2008/07/10/crash-dump-analysis-patterns-part-19b/ |
516 |
|
http://www.dumpanalysis.org/blog/index.php/2007/08/16/crash-dump-analysis-patterns-part-22/ |
511 |
|
http://www.dumpanalysis.org/blog/index.php/2007/10/08/crash-dump-analysis-patterns-part-29/ |
506 |
|
http://www.dumpanalysis.org/blog/index.php/2008/08/07/crash-dump-analysis-patterns-part-75/ |
500 |
|
http://www.dumpanalysis.org/blog/index.php/2008/01/22/crash-dump-analysis-patterns-part-42c/ |
496 |
|
http://www.dumpanalysis.org/blog/index.php/2008/06/20/crash-dump-analysis-patterns-part-66/ |
493 |
|
http://www.dumpanalysis.org/blog/index.php/2008/06/19/crash-dump-analysis-patterns-part-64/ |
492 |
|
http://www.dumpanalysis.org/blog/index.php/2007/03/19/crash-dump-analysis-patterns-part-10/ |
450 |
|
http://www.dumpanalysis.org/blog/index.php/2009/04/14/crash-dump-analysis-patterns-part-6b/ |
448 |
|
http://www.dumpanalysis.org/blog/index.php/2009/05/15/crash-dump-analysis-patterns-part-84/ |
432 |
|
http://www.dumpanalysis.org/blog/index.php/2008/07/09/crash-dump-analysis-patterns-part-69/ |
427 |
|
http://www.dumpanalysis.org/blog/index.php/2007/09/26/crash-dump-analysis-patterns-part-28/ |
426 |
|
http://www.dumpanalysis.org/blog/index.php/2008/02/15/crash-dump-analysis-patterns-part-50/ |
410 |
|
http://www.dumpanalysis.org/blog/index.php/2008/06/19/crash-dump-analysis-patterns-part-65/ |
378 |
|
http://www.dumpanalysis.org/blog/index.php/2007/11/12/crash-dump-analysis-patterns-part-35/ |
371 |
|
http://www.dumpanalysis.org/blog/index.php/2008/01/25/crash-dump-analysis-patterns-part-44/ |
371 |
|
http://www.dumpanalysis.org/blog/index.php/2008/06/27/crash-dump-analysis-patterns-part-68/ |
370 |
|
http://www.dumpanalysis.org/blog/index.php/2008/08/05/crash-dump-analysis-patterns-part-74/ |
369 |
|
http://www.dumpanalysis.org/blog/index.php/2008/12/17/crash-dump-analysis-patterns-part-42e/ |
351 |
|
http://www.dumpanalysis.org/blog/index.php/2008/07/29/crash-dump-analysis-patterns-part-73/ |
345 |
|
http://www.dumpanalysis.org/blog/index.php/2009/06/23/crash-dump-analysis-patterns-part-85/ |
340 |
|
http://www.dumpanalysis.org/blog/index.php/2008/05/28/crash-dump-analysis-patterns-part-62/ |
337 |
|
http://www.dumpanalysis.org/blog/index.php/2009/07/10/crash-dump-analysis-patterns-part-87/ |
336 |
|
http://www.dumpanalysis.org/blog/index.php/2008/12/01/crash-dump-analysis-patterns-part-78a/ |
330 |
|
http://www.dumpanalysis.org/blog/index.php/2008/07/10/crash-dump-analysis-patterns-part-70/ |
323 |
|
http://www.dumpanalysis.org/blog/index.php/2008/02/06/crash-dump-analysis-patterns-part-47/ |
322 |
|
http://www.dumpanalysis.org/blog/index.php/2008/03/27/crash-dump-analysis-patterns-part-56/ |
317 |
|
http://www.dumpanalysis.org/blog/index.php/2007/11/06/crash-dump-analysis-patterns-part-34/ |
310 |
|
http://www.dumpanalysis.org/blog/index.php/2008/07/26/crash-dump-analysis-patterns-part-72/ |
307 |
|
http://www.dumpanalysis.org/blog/index.php/2008/01/31/crash-dump-analysis-patterns-part-46/ |
299 |
|
http://www.dumpanalysis.org/blog/index.php/2008/11/07/crash-dump-analysis-patterns-part-42d/ |
293 |
|
http://www.dumpanalysis.org/blog/index.php/2008/10/06/crash-dump-analysis-patterns-part-76/ |
288 |
|
http://www.dumpanalysis.org/blog/index.php/2008/01/30/crash-dump-analysis-patterns-part-45/ |
286 |
|
http://www.dumpanalysis.org/blog/index.php/2008/09/10/crash-dump-analysis-patterns-part-29b/ |
270 |
|
http://www.dumpanalysis.org/blog/index.php/2009/02/13/crash-dump-analysis-patterns-part-80/ |
250 |
|
http://www.dumpanalysis.org/blog/index.php/2009/03/09/crash-dump-analysis-patterns-part-82/ |
246 |
|
http://www.dumpanalysis.org/blog/index.php/2009/02/09/crash-dump-analysis-patterns-part-79/ |
231 |
|
http://www.dumpanalysis.org/blog/index.php/2008/05/07/crash-dump-analysis-patterns-part-10a/ |
225 |
|
http://www.dumpanalysis.org/blog/index.php/2009/06/24/crash-dump-analysis-patterns-part-86/ |
207 |
|
http://www.dumpanalysis.org/blog/index.php/2009/02/19/crash-dump-analysis-patterns-part-81/ |
195 |
|
http://www.dumpanalysis.org/blog/index.php/2009/10/28/crash-dump-analysis-patterns-part-90/ |
151 |
|
http://www.dumpanalysis.org/blog/index.php/2009/04/14/crash-dump-analysis-patterns-part-83/ |
146 |
|
http://www.dumpanalysis.org/blog/index.php/2009/12/07/crash-dump-analysis-patterns-part-95/ |
92 |
|
http://www.dumpanalysis.org/blog/index.php/2009/11/24/crash-dump-analysis-patterns-part-93/ |
67 |
|
http://www.dumpanalysis.org/blog/index.php/2009/11/12/crash-dump-analysis-patterns-part-91/ |
46 |
|
http://www.dumpanalysis.org/blog/index.php/2009/10/23/crash-dump-analysis-patterns-part-89/ |
41 |
|
http://www.dumpanalysis.org/blog/index.php/2009/11/30/crash-dump-analysis-patterns-part-94a/ |
39 |
|
http://www.dumpanalysis.org/blog/index.php/2009/11/24/crash-dump-analysis-patterns-part-92/ |
36 |
|
http://www.dumpanalysis.org/blog/index.php/2009/10/23/crash-dump-analysis-patterns-part-88/ |
35 |
|
http://www.dumpanalysis.org/blog/index.php/2009/11/16/crash-dump-analysis-patterns-part-65b/ |
33 |
|
http://www.dumpanalysis.org/blog/index.php/2009/12/30/crash-dump-analysis-patterns-part-13g/ |
20 |
- Dmitry Vostokov @ DumpAnalysis.org -
According to Google Analytics the number of visits / year increased by 34% since 2008 with almost 150,000 unique visitors (20% increase) from 183 countries (180 in 2008) and more than 35% of them are coming back (2% increase). Here are the top 100 network locations out of 27,300 (16% increase):
|
Network Location |
Visits |
|
microsoft corp |
9183 |
|
comcast cable communications inc. |
4651 |
|
road runner holdco llc |
3601 |
|
verizon internet services inc. |
3191 |
|
japan network information center |
2580 |
|
hewlett-packard company |
2474 |
|
internet service provider |
2390 |
|
deutsche telekom ag |
2204 |
|
reliance communications ltd |
2200 |
|
comite gestor da internet no brasil |
2134 |
|
chunghwa telecom data communication business group |
1892 |
|
network of citrix systems inc |
1716 |
|
eircom |
1702 |
|
nib (national internet backbone) |
1455 |
|
symantec corporation |
1439 |
|
charter communications |
1253 |
|
intel corporation |
1253 |
|
data general corporation |
1235 |
|
ip pools |
1070 |
|
comcast cable communications holdings inc |
1040 |
|
proxad / free sas |
1036 |
|
bellsouth.net inc. |
1030 |
|
comcast cable communications |
1030 |
|
uunet non-portable customer assignment |
984 |
|
cox communications |
953 |
|
korea telecom |
891 |
|
chinanet guangdong province network |
879 |
|
unknown |
872 |
|
abts (karnataka) |
853 |
|
microsoft dublin internet data center |
847 |
|
at&t internet services |
827 |
|
qwest communications corporation |
798 |
|
xo communications |
790 |
|
optimum online (cablevision systems) |
777 |
|
tw telecom holdings inc. |
756 |
|
shaw communications inc. |
691 |
|
samtel |
674 |
|
cox communications inc. |
653 |
|
ntt communications corporation |
648 |
|
telstra internet |
632 |
|
arcor ag |
603 |
|
chinanet shanghai province network |
598 |
|
krnic |
593 |
|
comcast cable communications ip services |
588 |
|
computer associates international |
564 |
|
rcs & rds s.a. |
538 |
|
citrix systems inc. |
532 |
|
research in motion limited |
524 |
|
dell computer corporation |
522 |
|
telefonica de espana |
515 |
|
psinet inc. |
509 |
|
easynet ltd |
500 |
|
comcast business communications inc. |
494 |
|
symantec inc |
491 |
|
telus communications inc. |
481 |
|
cncgroup beijing province network |
465 |
|
microsoft corporation |
456 |
|
kla instruments corp. |
448 |
|
honeywell international inc. |
446 |
|
cisco systems inc. |
444 |
|
provider local registry |
442 |
|
global crossing |
414 |
|
sympatico hse |
408 |
|
iinet limited |
397 |
|
china unicom beijing province network |
395 |
|
starhub cable vision ltd |
392 |
|
wipro technologies |
384 |
|
alice dsl |
383 |
|
abts delhi |
358 |
|
appense |
351 |
|
telecom italia net |
347 |
|
microsoft |
346 |
|
nvidia |
344 |
|
neostrada plus |
334 |
|
provider |
332 |
|
abts tamilnadu |
325 |
|
hanaro telecom inc. |
322 |
|
level 3 communications inc. |
322 |
|
1&1 internet ag |
319 |
|
network of ign arch. and design gb |
319 |
|
telia network services |
316 |
|
credit suisse group / cana |
308 |
|
axa-tech |
306 |
|
optus internet - retail |
306 |
|
rogers cable communications inc. |
305 |
|
telecom italia s.p.a. tin easy lite |
304 |
|
telekom malaysia berhad |
303 |
|
chinanet jiangsu province network |
297 |
|
tiscali uk ltd |
284 |
|
chtd chunghwa telecom co. ltd. |
274 |
|
comcast cable communications inc |
268 |
|
tpg internet pty ltd. |
268 |
|
datastream ltd |
262 |
|
dynamic pools |
259 |
|
sun microsystems inc |
258 |
|
singnet pte ltd |
257 |
|
oracle datenbanksysteme gmbh |
252 |
|
gesti n de direccionamiento uninet |
249 |
|
embarq corporation |
243 |
|
nicstech |
243 |
Almost 75,000 Google search keywords (more than 13% increase since 2008) pointed to the portal and this blog with 100 most frequent (some are in Russian):
|
Keyword |
Visits |
|
kifastsystemcallret |
2963 |
|
crash dump analysis |
2742 |
|
crash dump |
2097 |
|
ntdll!kifastsystemcallret |
1446 |
|
dump analysis |
1091 |
|
win32 error 0n2 |
759 |
|
windbg |
685 |
|
windbg cheat sheet |
675 |
|
windbg commands |
619 |
|
crash dumps |
525 |
|
adplus |
523 |
|
dmitry vostokov |
521 |
|
memory dump analysis |
519 |
|
dec 15″” module windbg |
511 |
|
crashdump |
502 |
|
memoretics |
494 |
|
dumpanalysis.org |
439 |
|
symbol file could not be found |
434 |
|
warning: frame ip not in any known module. following frames may be wrong. |
389 |
|
the stored exception information can be accessed via .ecxr. |
373 |
|
crash dump analyzer |
355 |
|
memory dump analysis anthology |
353 |
|
windows 7 crash dump |
329 |
|
windbg crash dump analysis |
326 |
|
adplus download |
315 |
|
error: symbol file could not be found |
308 |
|
minidump analysis |
308 |
|
dumpanalysis |
289 |
|
getcontextstate failed, 0×80070026 |
287 |
|
symbol file could not be found”" |
281 |
|
bugcheck 3b |
280 |
|
core dump analysis |
278 |
|
time travel debugging |
276 |
|
vista crash dump |
272 |
|
windbg analyze |
263 |
|
fnodobfm |
258 |
|
the stored exception information can be accessed via .ecxr |
257 |
|
kernel32!pnlsuserinfo |
249 |
|
bugcheck 7e |
243 |
|
windbg crash dump |
242 |
|
frame ip not in any known module |
237 |
|
dr watson vista |
230 |
|
windows crash dump analysis |
218 |
|
windbg script |
216 |
|
dump analyzer |
206 |
|
windbg scripts |
190 |
|
system_service_exception |
185 |
|
crash dump vista |
181 |
|
pool corruption |
174 |
|
minidump |
172 |
|
error: symbol file could not be found. |
168 |
|
kernel_mode_exception_not_handled |
166 |
|
ldrphandleonenewformatimportdescriptor |
166 |
|
bios disassembly ninjutsu uncovered |
165 |
|
ntkrnlmp.exe crash dump |
164 |
|
дамп памяти |
162 |
|
trap frame |
159 |
|
windows dump analysis |
154 |
|
minidump analyzer |
153 |
|
bugcheck a |
152 |
|
анализ dump файлов |
147 |
|
ntdll kifastsystemcallret |
146 |
|
memuon”" |
145 |
|
debugging crash dumps |
145 |
|
kisystemservicecopyend |
143 |
|
анализ дампа памяти |
142 |
|
ibmsprem.exe |
141 |
|
windbg dump |
141 |
|
download adplus |
140 |
|
ntdll.dll!kifastsystemcallret |
140 |
|
analyze crash dump |
138 |
|
ntdll!dbgbreakpoint |
135 |
|
rtlpwaitoncriticalsection |
133 |
|
type referenced: kernel32!pnlsuserinfo |
133 |
|
dynamicbase aslr |
130 |
|
dump памяти |
129 |
|
mdmp file analysis |
129 |
|
warning: frame ip not in any known module. following frames may be wrong |
129 |
|
warning: stack unwind information not available. following frames may be wrong. |
129 |
|
sieextpub |
127 |
|
ntdll.kifastsystemcallret |
126 |
|
debug_flr_image_timestamp |
125 |
|
failure_bucket_id |
125 |
|
kei386eoihelper |
124 |
|
memory dump |
124 |
|
отладчик windbg |
124 |
|
dump |
122 |
|
windows debugging: practical foundations |
121 |
|
rtluserthreadstart |
119 |
|
windbg book |
119 |
|
crash dump windows 7 |
118 |
|
978-19067171568 |
115 |
|
windbg dump analysis |
115 |
|
session_has_valid_views_on_exit (ba) |
114 |
|
bugcheck 50 |
113 |
|
bugcheck system_service_exception |
113 |
|
system_thread_exception_not_handled |
112 |
|
analyzing crash dumps |
111 |
|
getcontextstate failed, 0xd0000147 |
110 |
|
childebp |
107 |
Special thanks to almost 1,100 web sites (16% increase) that mention the portal and this blog with the first top 100:
|
Source |
Visits |
|
google.com |
3090 |
|
windbg.dumpanalysis.org |
2012 |
|
images.google.com |
1375 |
|
blogs.msdn.com |
1130 |
|
stackoverflow.com |
750 |
|
kumo.com |
678 |
|
dumpanalysis.com |
664 |
|
dumpanalysis.org |
531 |
|
winvistaclub.com |
441 |
|
nynaeve.net |
386 |
|
jasonhaley.com |
385 |
|
twitter.com |
376 |
|
bytetalk.net |
351 |
|
advancedwindowsdebugging.com |
345 |
|
en.wikipedia.org |
343 |
|
gynvael.coldwind.pl |
324 |
|
msuiche.net |
272 |
|
blog.flexilis.com |
265 |
|
bing.com |
241 |
|
images.google.co.in |
222 |
|
rsdn.ru |
220 |
|
images.google.co.uk |
214 |
|
stumbleupon.com |
212 |
|
d.hatena.ne.jp |
193 |
|
blog.naver.com |
190 |
|
images.google.de |
181 |
|
blog.not-a-kernel-guy.com |
179 |
|
social.technet.microsoft.com |
179 |
|
blog.zoller.lu |
175 |
|
google.co.kr |
169 |
|
facebook.com |
167 |
|
community.citrix.com |
165 |
|
wasm.ru |
163 |
|
search.naver.com |
161 |
|
voneinem-windbg.blogspot.com |
160 |
|
insidewindows.kr |
157 |
|
managementbits.com |
154 |
|
forum.sysinternals.com |
153 |
|
support.citrix.com |
144 |
|
reconstructer.org |
132 |
|
google.co.in |
129 |
|
debuggingexpert.dumpanalysis.org |
128 |
|
blogs.microsoft.co.il |
125 |
|
delicious.com |
124 |
|
isisaka.com |
124 |
|
netfxharmonics.com |
122 |
|
caloni.com.br |
112 |
|
advdbg.org |
111 |
|
experts-exchange.com |
111 |
|
citrixblogger.org |
105 |
|
google.co.uk |
100 |
|
serious-code.net |
100 |
|
shellexecute.wordpress.com |
99 |
|
bloglines.com |
96 |
|
mail.google.com |
92 |
|
debuglab.com |
91 |
|
images.google.ca |
91 |
|
blogs.technet.com |
89 |
|
209.85.129.132 |
82 |
|
google.ca |
81 |
|
debuggingexperts.dumpanalysis.org |
80 |
|
fruitfoxlu.blogspot.com |
78 |
|
74.125.95.132 |
75 |
|
codeproject.com |
75 |
|
clausbrod.de |
70 |
|
groups.google.com |
70 |
|
literatescientist.com |
66 |
|
images.google.ru |
65 |
|
images.google.fr |
64 |
|
saygoodnight.com |
61 |
|
belowgotham.com |
60 |
|
bishop-it.ru |
59 |
|
google.es |
59 |
|
209.85.173.132 |
58 |
|
driveronline.org |
58 |
|
images.google.com.au |
58 |
|
forensicanalysis.org |
57 |
|
images.google.com.br |
57 |
|
images.google.com.ua |
57 |
|
images.google.it |
57 |
|
social.msdn.microsoft.com |
57 |
|
google.de |
56 |
|
images.google.co.id |
56 |
|
images.google.pl |
56 |
|
the-interweb.com |
56 |
|
evilcodecave.wordpress.com |
54 |
|
codemachine.com |
52 |
|
blog.gamedeff.com |
51 |
|
rfvicente.spaces.live.com |
51 |
|
209.85.229.132 |
50 |
|
images.google.nl |
50 |
|
my.live.com |
50 |
|
notes.theorbis.net |
50 |
|
advanceddotnetdebugging.com |
49 |
|
softwareastrology.com |
49 |
|
google.hu |
48 |
|
thinkdigit.com |
47 |
|
cps-symbols.qalabs.symantec.com |
46 |
|
dogpile.com |
46 |
Top 25 visiting countries:
|
Country/Territory |
Visits |
|
United States |
77312 |
|
India |
16091 |
|
United Kingdom |
15892 |
|
Germany |
9336 |
|
Russia |
9202 |
|
China |
7948 |
|
Canada |
7382 |
|
Japan |
6001 |
|
France |
4847 |
|
South Korea |
4748 |
|
Australia |
4329 |
|
Taiwan |
4076 |
|
Ireland |
3735 |
|
Singapore |
3598 |
|
Netherlands |
3073 |
|
Israel |
2933 |
|
Ukraine |
2918 |
|
Italy |
2905 |
|
Spain |
2821 |
|
Sweden |
2548 |
|
Brazil |
2309 |
|
Poland |
2134 |
|
Romania |
1848 |
|
Czech Republic |
1551 |
|
Belgium |
1454 |
More than 10,000 portal and blog pages were viewed a total of almost 450,000 times with top 100 content pages:
|
Page |
Pageviews |
|
/ |
41591 |
|
/blog/ |
40481 |
|
/blog/index.php/2008/01/10/what-is-kifastsystemcallret/ |
7226 |
|
/Crash+Dump+Analysis+for+System+Administrators |
6229 |
|
/WinDbg+reference |
4561 |
|
/blog/index.php/2006/10/30/crash-dump-analysis-patterns-part-1/ |
4538 |
|
/blog/index.php/category/windbg-tips-and-tricks/ |
4197 |
|
/blog/index.php/2007/06/20/crash-dump-analysis-checklist/ |
4175 |
|
/ru/blog/ |
4144 |
|
/blog/index.php/2006/10/31/crash-dump-analysis-patterns-part-2/ |
3941 |
|
/blog/index.php/2007/05/19/resurrecting-dr-watson-on-vista/ |
3475 |
|
/Forthcoming+Windows+Debugging%3A+Practical+Foundations |
3298 |
|
/blog/index.php/2007/07/20/crash-dump-analysis-patterns-part-17/ |
3282 |
|
/Memory+Dump+Analysis+Anthology+Volume+1 |
3109 |
|
/blog/index.php/2008/03/12/bug-check-frequencies/ |
2994 |
|
/Tools |
2981 |
|
/blog/index.php/2007/09/06/minidump-analysis-part-2/ |
2960 |
|
/blog/index.php/category/windbg-scripts/ |
2706 |
|
/blog/index.php/2008/05/09/windbg-cheat-sheet-for-crash-dump-analysis/ |
2679 |
|
/Debugged+Magazine |
2631 |
|
/blog/index.php/2008/09/12/adplus-in-21-seconds-and-13-steps/ |
2630 |
|
/blog/index.php/2007/04/03/crash-dump-analysis-patterns-part-11/ |
2521 |
|
/blog/index.php/category/bugchecks-depicted/page/2/ |
2496 |
|
/blog/index.php/about/ |
2491 |
|
/blog/index.php/2008/03/13/crash-dump-analysis-patterns-part-2b/ |
2487 |
|
/blog/index.php/category/minidump-analysis/ |
2259 |
|
/blog/index.php/2007/12/17/crash-dump-analysis-patterns-part-41b/ |
2154 |
|
/blog/index.php/2008/06/12/crash-dump-analysis-patterns-part-59b/ |
2153 |
|
/blog/index.php/basic-windows-crash-dump-analysis/ |
2060 |
|
/Forthcoming+Memory+Dump+Analysis+Anthology+Volume+2 |
2029 |
|
/blog/index.php/2007/02/09/crash-dump-analysis-patterns-part-9a/ |
2014 |
|
/Library |
1994 |
|
/blog/index.php/2008/01/24/crash-dump-analysis-patterns-part-43/ |
1969 |
|
/blog/index.php/2007/09/17/resolving-symbol-file-could-not-be-found/ |
1954 |
|
/blog/index.php/crash-dump-analysis-patterns/ |
1947 |
|
/blog/index.php/2007/10/01/windows-service-crash-dumps-on-vista/ |
1910 |
|
/blog/index.php/2007/08/29/minidump-analysis-part-1/ |
1839 |
|
/blog/index.php/2007/08/06/crash-dump-analysis-patterns-part-20a/ |
1838 |
|
/blog/index.php/2007/07/15/interrupts-and-exceptions-explained-part-4/ |
1766 |
|
/blog/index.php/2007/10/11/minidump-analysis-part-4/ |
1730 |
|
/ru/blog/index.php/category/komandy-otladchika-windbg/ |
1650 |
|
/Links |
1566 |
|
/blog/index.php/category/dump-analysis/ |
1566 |
|
/blog/index.php/2008/10/15/crash-dump-analysis-patterns-part-1b/ |
1537 |
|
/blog/index.php/category/vista/ |
1528 |
|
/blog/index.php/category/windows-7/ |
1520 |
|
/blog/index.php/2007/08/04/visualizing-memory-dumps/ |
1517 |
|
/blog/index.php/2006/12/09/clipboard-issues-explained/ |
1510 |
|
/blog/index.php/2007/02/02/crash-dump-analysis-patterns-part-8/ |
1499 |
|
/blog/index.php/2008/04/22/bugchecks-system_service_exception/ |
1468 |
|
/blog/index.php/category/windows-server-2008/ |
1467 |
|
/blog/index.php/2007/05/20/custom-postmortem-debuggers-on-vista/ |
1397 |
|
/blog/index.php/2007/06/21/crash-dump-analysis-patterns-part-16a/ |
1353 |
|
/blog/index.php/2008/04/03/crash-dump-analysis-patterns-part-57/ |
1351 |
|
/blog/index.php/2007/11/02/crash-dump-analysis-patterns-part-13c/ |
1320 |
|
/arts-photography-links |
1317 |
|
/blog/index.php/dumps-for-dummies/ |
1316 |
|
/blog/index.php/2008/04/28/crash-dump-analysis-patterns-part-6a/ |
1296 |
|
/blog/index.php/2007/03/03/windbg-tips-and-tricks-hypertext-commands/ |
1288 |
|
/blog/index.php/2007/09/14/crash-dump-analysis-patterns-part-27/ |
1274 |
|
/dll+art+book |
1260 |
|
/blog/index.php/2007/09/11/crash-dump-analysis-patterns-part-26/ |
1240 |
|
/blog/index.php/2007/10/17/crash-dump-analysis-patterns-part-31/ |
1210 |
|
/blog/index.php/2006/11/01/crash-dump-analysis-patterns-part-3/ |
1192 |
|
/blog/index.php/2007/03/04/windbg-tips-and-tricks-analyzing-hangs-faster/ |
1167 |
|
/arts-photography |
1156 |
|
/blog/index.php/2006/12/18/crash-dump-analysis-patterns-part-6/ |
1155 |
|
/Dumps%2C+Bugs+and+Debugging+Forensics |
1143 |
|
/node?page=1 |
1139 |
|
/blog/index.php/2006/10/09/dumps-for-dummies-part-1/ |
1118 |
|
/blog/index.php/2008/03/18/crash-dump-analysis-patterns-part-13e/ |
1084 |
|
/blog/index.php/foundations-of-debugging-x86/ |
1084 |
|
/blog/index.php/2007/04/25/bugchecks-system_thread_exception_not_handled/ |
1072 |
|
/blog/index.php/category/gdb-for-windbg-users/ |
1054 |
|
/blog/index.php/2007/09/10/crash-dump-analysis-patterns-part-25/ |
1046 |
|
/blog/index.php/2007/06/21/repair-clipboard-chain-201/ |
1045 |
|
/blog/index.php/automated-analysis/ |
1015 |
|
/blog/index.php/crash-dump-examples/ |
987 |
|
/blog/index.php/2007/07/15/crash-dump-analysis-patterns-part-13b/ |
961 |
|
/blog/index.php/2006/10/25/dumps-for-dummies-part-3/ |
960 |
|
/blog/index.php/2007/08/19/crash-dump-analysis-patterns-part-23a/ |
937 |
|
/blog/index.php/2007/09/ |
925 |
|
/blog/index.php/2007/07/01/gdb-for-windbg-users-part-5/ |
908 |
|
/blog/index.php/2006/10/14/dumps-for-dummies-part-2/ |
907 |
|
/Forthcoming+Windows+Debugging+Notebook |
888 |
|
/blog/index.php/memory-dump-analysis-interview-questions/ |
886 |
|
/blog/index.php/2007/05/19/inside-vista-error-reporting-part-1/ |
884 |
|
/blog/index.php/2007/08/07/basic-windows-crash-dump-analysis-part-1/ |
879 |
|
/blog/index.php/2006/11/19/dumps-for-dummies-part-4/ |
873 |
|
/blog/index.php/2007/08/19/crash-dump-analysis-patterns-part-20b/ |
871 |
|
/aggregator |
856 |
|
/blog/index.php/page/2/ |
834 |
|
/blog/index.php/2008/06/26/heuristic-stack-trace-in-windbg-693113/ |
833 |
|
/blog/index.php/2008/10/25/crash-dump-analysis-patterns-part-9e/ |
817 |
|
/blog/index.php/2009/04/01/new-memory-dump-type-in-windows-7/ |
815 |
|
/blog/index.php/2006/12/06/new-testdefaultdebugger-tool/ |
804 |
|
/x64+Windows+Debugging%3A+Practical+Foundations |
789 |
|
/blog/index.php/2007/04/28/interrupts-and-exceptions-explained-part-1/ |
775 |
|
/blog/index.php/2007/07/28/crash-dump-analysis-patterns-part-9c/ |
771 |
|
/BabyTuringBook |
764 |
- Dmitry Vostokov @ DumpAnalysis.org -
What will you do confronted with a one million trace messages recorded between 10:44:15 and 10:46:55 with an average trace statement current of 7,000 msg/s from dozens of modules and having a one sentence problem description? One solution is to try to search for a specific vocabulary relevant to the problem description, for example, if a problem is an intermittent re-authentication then we might try to search for a word “password” or a similar one drawn from a troubleshooting domain vocabulary. So it is useful to have a Vocabulary Index to search for. Hence, the same name of this pattern. In our trace example, the search for “password” jumps straight to a small activity region of authorization modules starting from the message number #180,010 and the last “password” occurrence is in the message #180,490 that narrows initial analysis region to just 500 messages. Note the similarity here between a book and its index and a trace as a software narrative and its vocabulary index.
- Dmitry Vostokov @ TraceAnalysis.org -