Archive for the ‘Debugging’ Category
Wednesday, March 3rd, 2010


While reading Software Studies: A Lexicon (Leonardo Books) I came upon an article about Concurrent Versions System written by Simon Yuill. It features a patched quotation from Proudhon:
“The highest perfection of society is found in the union of order and anarchy.” ->
-> “The highest perfection of software is found in the union of order and anarchy.”
Therefore, a bugtation as paradigmatic substitution can be seen as specialised topical patching. It is also augmented with topical coloring:
“The highest perfection of” debugging “is found in the union of order and anarchy.”
Pierre-Joseph Proudhon, What is Property?
Double patching now?
- Dmitry Vostokov @ DumpAnalysis.org + TraceAnalysis.org -
Posted in Books, Bugtations, Debugging | No Comments »
Monday, February 22nd, 2010
As soon as I dug out the 3rd edition of this book to download samples for my internal projects I found that the new edition was published this month! I read all of them and now ordering the 4th edition:
Windows System Programming (4th Edition)
Actually I re-read the 2nd edition of Johnson M. Hart’s book when looking for a job in 2003 and coupled with timely reading of John Robbings’ book Debugging Applications (1st 2000 edition) secured my landing in Dublin East Point Business Park.
This book is an essential reading for Windows memory dump analysts, software maintenance and escalation engineers, software defect researchers and software tool developers. It lucidly describes and succinctly illustrates user-land Windows API with practical console mode samples in plain C. This book is especially valuable for software engineers coming from UNIX background because the author draws various parallels and provides maps between UNIX / Pthreads and Win32 / 64 APIs. Highly recommended! Plan to post an Amazon review when I get the copy of the 4th edition.
- Dmitry Vostokov @ DumpAnalysis.org + TraceAnalysis.org -
Posted in Books, C and C++, Citrix, Code Reading, Debugging, History, Tools, Vista, Windows 7, Windows Server 2008 | No Comments »
Friday, February 19th, 2010
This post is not about debugging a computer bus. It is about debugging on a bus. More correctly, it is about debugging software running on a bus, not on a computer bus but on a real bus. A few days ago I was on a bus leaving Dublin bus station to Dublin airport. Looking around inside the bus I noticed one monitor had a characteristic Windows XP-style message box of an access violation. It was just before disembarking the bus so I made a mental effort to memorize the referenced memory address: 0×4000 and the instruction address: x73f18a09. The application name was bb.exe. Google search for 73f10000 module load address points to this one:
ModLoad: 73f10000 73f6c000 C:\WINDOWS\system32\DSOUND.dll
Not really a debugging (there’s no fix from me) so it can be named as a bus analysis exercise.
- Dmitry Vostokov @ DumpAnalysis.org + TraceAnalysis.org -
Posted in Crash Dump Analysis, Debugging, Dr. Watson, Fun with Crash Dumps, Memory Analysis Culture | No Comments »
Sunday, February 14th, 2010
Thanks to everyone who submitted their debugger logs. Now VBScript and WinDbg script files are available for download from the CARE page:
http://www.dumpanalysis.org/care
VBScript file scans all hard drives for .DMP files and launches WinDbg to run a mode-independent WinDbg script. Each instance of WinDbg appends the output to dbgeng.log file that you can submit to CARE (please zip it if exceeds 2Mb).
- Dmitry Vostokov @ DumpAnalysis.org + TraceAnalysis.org -
Posted in Announcements, Crash Analysis Report Environment (CARE), Crash Dump Analysis, Crash Dump Patterns, Debugging | No Comments »
Saturday, February 13th, 2010
Another useful pattern is called Time Delta. This is a time interval between significant events. For example,
#     Module PID  TID  Time         File    Function Message

1                      10:06:18.994                  (Start)

[...]

6060  dllA   1604 7108 10:06:21.746 fileA.c DllMain  DLL_PROCESS_ATTACH

[…]

24480 dllA   1604 7108 10:06:32.262 fileA.c Exec     Path: C:\Program Files\CompanyA\appB.exe

[…]

24550 dllB   1604 9588 10:06:32.362 fileB.c PostMsg  Event Q

[…]

28230                  10:07:05.170                  (End)
Such deltas are useful in examining delays. In the trace fragment above we are interested in dllA activity from its load until it launches appB.exe. We see that the time delta was only 10 seconds. The message #24550 was the last message from the process ID 1604 and after that we didn’t “hear” from that PID for more than 30 seconds until the tracing was stopped.
- Dmitry Vostokov @ DumpAnalysis.org + TraceAnalysis.org -
Posted in CDF Analysis Tips and Tricks, Debugging, Software Trace Analysis, Trace Analysis Patterns | 1 Comment »
Saturday, February 13th, 2010
When looking at software traces and doing either a search for or just scrolling certain messages have our attention immediately. We call them Significant Events and hence the name of this pattern, Significant Event. It could be a recorded exception or an error, a basic fact, a trace message from vocabulary index, or just any trace statement that marks the start of some activity we want to explore in depth, for example, a certain DLL is attached to the process, a coupled process is started or a function is called. The start of a trace and the end of it are trivial significant events and are used in deciding whether the trace is circular, in determining the trace recording interval or its average statement current.
- Dmitry Vostokov @ DumpAnalysis.org + TraceAnalysis.org -
Posted in CDF Analysis Tips and Tricks, Debugging, Software Trace Analysis, Trace Analysis Patterns | 1 Comment »
Friday, February 12th, 2010
Memory interpretation of the last words of Socrates:
“Crito, I own a” handle “to Æsculapius. Will you remember to” close it?
Socrates
- Dmitry Vostokov @ DumpAnalysis.org + TraceAnalysis.org -
Posted in Bugtations, Common Mistakes, Debugging, Memoidealism, Memory Religion (Memorianity), Philosophy | No Comments »
Thursday, February 11th, 2010
This is a revised, edited, cross-referenced and thematically organized volume of selected DumpAnalysis.org blog posts about crash dump analysis and debugging written in July 2009 - January 2010 for software engineers developing and maintaining products on Windows platforms, quality assurance engineers testing software on Windows platforms and technical support and escalation engineers dealing with complex software issues. The fourth volume features:
- 13 new crash dump analysis patterns
- 13 new pattern interaction case studies
- 10 new trace analysis patterns
- 6 new Debugware patterns and case study
- Workaround patterns
- Updated checklist
- Fully cross-referenced with Volume 1, Volume 2 and Volume 3
- New appendixes
Product information:
- Title: Memory Dump Analysis Anthology, Volume 4
- Author: Dmitry Vostokov
- Language: English
- Product Dimensions: 22.86 x 15.24
- Paperback: 410 pages
- Publisher: Opentask (30 March 2010)
- ISBN-13: 978-1-906717-86-5
- Hardcover: 410 pages
- Publisher: Opentask (30 April 2010)
- ISBN-13: 978-1-906717-87-2

Back cover features memory space art image: Internal Process Combustion.
- Dmitry Vostokov @ DumpAnalysis.org + TraceAnalysis.org -
Posted in .NET Debugging, Aesthetics of Memory Dumps, Announcements, AntiPatterns, Art, Assembly Language, Books, C and C++, CDA Pattern Classification, CDF Analysis Tips and Tricks, Categorical Debugging, Certification, Citrix, Code Reading, Common Mistakes, Computer Science, Countefactual Debugging, Crash Analysis Report Environment (CARE), Crash Dump Analysis, Crash Dump Patterns, Crash Dumps for Dummies, DebugWare Patterns, Debugging, Debugging Slang, Education and Research, Escalation Engineering, Fun with Crash Dumps, Games for Debugging, Hardware, Horrors of Computation, Hyper-V, Kernel Development, Laws of Troubleshooting and Debugging, Mathematics of Debugging, Memiotics (Memory Semiotics), Memoidealism, Memoretics, Memory Analysis Culture, Memory Analysis Forensics and Intelligence, Memory Dreams, Memory Dump Analysis Jobs, Memory Dumps in Movies, Memory Space Art, Memory Visualization, Memuonics, Minidump Analysis, Multithreading, Music for Debugging, New Acronyms, New Words, Opcodism, Philosophy, Physicalist Art, Publishing, Science Fiction, Science of Memory Dump Analysis, Science of Software Tracing, Security, Software Architecture, Software Defect Construction, Software Engineering, Software Generalist, Software Maintenance Institute, Software Narratology, Software Technical Support, Software Trace Analysis, Software Trace Visualization, Software Tracing for Dummies, Software Victimology, Stack Trace Collection, Testing, Tools, Trace Analysis Patterns, Training and Seminars, Troubleshooting Methodology, Victimware, Virtualization, Vista, Visual Dump Analysis, WinDbg Scripts, WinDbg Tips and Tricks, WinDbg for GDB Users, Windows 7, Windows Server 2008, Windows System Administration, Workaround Patterns | No Comments »
Tuesday, February 9th, 2010
Previously I wrote on how to get a 32-bit stack trace from a 32-bit process thread on an x64 system. There are situations when we are interested in all such stack traces, for example, from a complete memory dump. I wrote a script that extracts both 64-bit and WOW64 32-bit stack traces:
.load wow64exts

!for_each_thread "!thread @#Thread 1f;.thread /w @#Thread; .reload; kb 256; .effmach AMD64"
Example output fragment for a thread fffffa801f3a3bb0 from a very long debugger log file:
[...]
Setting context for owner process...

.process /p /r fffffa8013177c10
THREAD fffffa801f3a3bb0  Cid 4b4c.5fec  Teb: 000000007efaa000 Win32Thread: fffff900c1efad50 WAIT: (UserRequest) UserMode Non-Alertable

    fffffa8021ce4590  NotificationEvent

    fffffa801f3a3c68  NotificationTimer

Not impersonating

DeviceMap                 fffff8801b551720

Owning Process            fffffa8013177c10       Image:         application.exe

Attached Process          N/A            Image:         N/A

Wait Start TickCount      14066428       Ticks: 301 (0:00:00:04.695)

Context Switch Count      248                 LargeStack

UserTime                  00:00:00.000

KernelTime                00:00:00.000

Win32 Start Address mscorwks!Thread::intermediateThreadProc (0x00000000733853b3)

Stack Init fffffa60190e5db0 Current fffffa60190e5940

Base fffffa60190e6000 Limit fffffa60190df000 Call 0

Priority 11 BasePriority 10 PriorityDecrement 0 IoPriority 2 PagePriority 5

Child-SP          RetAddr           Call Site

fffffa60`190e5980 fffff800`01cba0fa nt!KiSwapContext+0x7f

fffffa60`190e5ac0 fffff800`01caedab nt!KiSwapThread+0x13a

fffffa60`190e5b30 fffff800`01f1d608 nt!KeWaitForSingleObject+0x2cb

fffffa60`190e5bc0 fffff800`01cb7973 nt!NtWaitForSingleObject+0x98

fffffa60`190e5c20 00000000`75183d09 nt!KiSystemServiceCopyEnd+0x13 (TrapFrame @ fffffa60`190e5c20)

00000000`069ef118 00000000`75183b06 wow64cpu!CpupSyscallStub+0x9

00000000`069ef120 00000000`74f8ab46 wow64cpu!Thunk0ArgReloadState+0x1a

00000000`069ef190 00000000`74f8a14c wow64!RunCpuSimulation+0xa

00000000`069ef1c0 00000000`771605a8 wow64!Wow64LdrpInitialize+0x4b4

00000000`069ef720 00000000`771168de ntdll! ?? ::FNODOBFM::`string'+0x20aa1

00000000`069ef7d0 00000000`00000000 ntdll!LdrInitializeThunk+0xe
.process /p /r 0

Implicit thread is now fffffa80`1f3a3bb0

WARNING: WOW context retrieval requires

switching to the thread's process context.

Use .process /p fffffa80`1f6b2990 to switch back.

Implicit process is now fffffa80`13177c10

x86 context set

Loading Kernel Symbols

Loading User Symbols

Loading unloaded module list

Loading Wow64 Symbols

ChildEBP RetAddr

06aefc68 76921270 ntdll_772b0000!ZwWaitForSingleObject+0x15

06aefcd8 7328c639 kernel32!WaitForSingleObjectEx+0xbe

06aefd1c 7328c56f mscorwks!PEImage::LoadImage+0x1af

06aefd6c 7328c58e mscorwks!CLREvent::WaitEx+0x117

06aefd80 733770fb mscorwks!CLREvent::Wait+0x17

06aefe00 73377589 mscorwks!ThreadpoolMgr::SafeWait+0x73

06aefe64 733853f9 mscorwks!ThreadpoolMgr::WorkerThreadStart+0x11c

06aeff88 7699eccb mscorwks!Thread::intermediateThreadProc+0x49

06aeff94 7732d24d kernel32!BaseThreadInitThunk+0xe

06aeffd4 7732d45f ntdll_772b0000!__RtlUserThreadStart+0x23

06aeffec 00000000 ntdll_772b0000!_RtlUserThreadStart+0x1b

Effective machine: x64 (AMD64)
[...]
- Dmitry Vostokov @ DumpAnalysis.org + TraceAnalysis.org -
Posted in Complete Memory Dump Analysis, Crash Dump Analysis, Debugging, WinDbg Scripts, WinDbg Tips and Tricks | 1 Comment »
Monday, February 8th, 2010
Another common mistake I observe is relying on what debuggers report without double-checking. Present day debuggers, like WinDbg or GDB, are symbol-driven, they do not possess much of that semantic knowledge that a human debugger has. Also, it is better to report more than less: what is irrelevant can be skipped over by a skilled memory analyst but what looks suspicious to the problem at hand shall be double-checked to see if it is not coincidental. One example we consider here is Coincidental Symbolic Information.
An application is frequently crashing. The process memory dump file shows only one thread left inside without any exception handling frames. In order to hypothesize about the probable cause the thread raw stack data is analyzed. It shows a few C++ STL calls with a custom smart pointer class and memory allocator like this:
app!std::vector<SmartPtr<ClassA>, std::allocator<SmartPtr<ClassA> > >::operator[]+
WinDbg !analyze-v command output points to this code:
FOLLOWUP_IP:

app!std::bad_alloc::~bad_alloc <PERF> (app+0x0)+0

00400000 4d  dec     ebp
Raw stack data contains a few symbolic references to bad_alloc destructor too:
[...]

0012f9c0  00000100

0012f9c4  00400100 app!std::bad_alloc::~bad_alloc <PERF> (app+0x100)

0012f9c8  00000000

0012f9cc  0012f9b4

0012f9d0  00484488 app!_NULL_IMPORT_DESCRIPTOR+0x1984

0012f9d4  0012fa8c

0012f9d8  7c828290 ntdll!_except_handler3

0012f9dc  0012fa3c

0012f9e0  7c82b04a ntdll!RtlImageNtHeaderEx+0xee

0012f9e4  00482f08 app!_NULL_IMPORT_DESCRIPTOR+0x404

0012f9e8  00151ed0

0012f9ec  00484c1e app!_NULL_IMPORT_DESCRIPTOR+0x211a

0012f9f0  00000100

0012f9f4  00400100 app!std::bad_alloc::~bad_alloc <PERF> (app+0x100)

[...]
By linking all these three pieces together an engineer hypothesized that the cause of failure is memory allocation. However, careful analysis reveals all of them as a coincidental symbolic information and renders hypothesis much less plausible:
1. The address of app!std::bad_alloc::~bad_alloc is 00400000 which coincides with the start of the main application module:
0:000> lm a 00400000

start    end        module name

00400000 004c4000   app    (no symbols)
As a consequence, its assembly language code makes no sense:
0:000> u 00400000

app:

00400000 4d              dec     ebp

00400001 5a              pop     edx

00400002 90              nop

00400003 0003            add     byte ptr [ebx],al

00400005 0000            add     byte ptr [eax],al

00400007 000400          add     byte ptr [eax+eax],al

0040000a 0000            add     byte ptr [eax],al

0040000c ff              ???
2. All std::vector references are in fact fragments of a UNICODE string that can be dumped using du command:
[...]

0012ef14  00430056 app!std::vector<SmartPtr<ClassA>, std::allocator<SmartPtr<ClassA> > >::operator[]+0x16

0012ef18  00300038

0012ef1c  0043002e app!std::vector<SmartPtr<ClassA>, std::allocator<SmartPtr<ClassA> > >::size+0x1

[...]
0:000> du 0012ef14 l6

0012ef14  "VC80.C"
3. Raw stack data references to bad_alloc destructor are still module addresses in disguise, 00400100 or app+0×100, with nonsense assembly code:
0:000> u 00400100

app+0x100:

00400100 50              push    eax

00400101 45              inc     ebp

00400102 0000            add     byte ptr [eax],al

00400104 4c              dec     esp

00400105 010500571aac    add     dword ptr ds:[0AC1A5700h],eax

0040010b 4a              dec     edx

0040010c 0000            add     byte ptr [eax],al

0040010e 0000            add     byte ptr [eax],al
- Dmitry Vostokov @ DumpAnalysis.org + TraceAnalysis.org -
Posted in Assembly Language, Common Mistakes, Crash Dump Analysis, Crash Dump Patterns, Debugging | No Comments »
Friday, February 5th, 2010
Debugging “with a purpose.”
Unknown Debugger
- Dmitry Vostokov @ DumpAnalysis.org + TraceAnalysis.org -
Posted in Bugtations, Debugging | No Comments »
Friday, February 5th, 2010
STUPID - Software Tracing Under Pressure Is Dumb
Examples: STUPID! STUPID! I told you to enable all modules! You included all but the one I need…
- Dmitry Vostokov @ DumpAnalysis.org + TraceAnalysis.org -
Posted in Debugging, Debugging Slang, New Acronyms, Software Technical Support, Software Trace Analysis | No Comments »
Thursday, February 4th, 2010
Sometimes we are not interested in first-chance exceptions as in the previous part but are interested in only second-chance exceptions to be sure that they were not handled as a part of an implementation design. Some tools like ADPlus can save dump files for both debugger events but I was asked to explain the difference between the first- and second-chance exceptions on W2K3 system where NTSD debugger was used to attach to a service process and save a dump. Initially the following command was used:
C:\> ntsd -psn ServiceA -noio -g -c ".dump /ma /u C:\UserDumps\ServiceA; q"
The dump was saved and analyzed. An engineer then decided that a second-chance exception dump file was needed for confirmation of an unhandled exception (because it was perceived that a postmortem debugger wasn’t saving any crash dumps) and requested to use the same command but with an -x switch that disables first-chance exception break in a debugger:
C:\> ntsd -psn ServiceA -noio -g -x -c “.dump /ma /u C:\UserDumps\ServiceA; q”
Note that q command terminates the debuggee so it was also advised to use qd to detach NTSD and let the service die naturally.
Two different possible exception memory dumps and the third possibility of a postmortem memory dump already complicates the picture not counting possible process-dumper-in-the-middle memory dumps that can be saved by userdump.exe if there is any exception dialog between the first- and second-chance exception processing. So I created two “Time Arrow” diagrams aiming to depict two exception scenarios using TestDefaultDebugger tool and the following simplified commands on x64 W2K3 system:
C:\> ntsd -pn TestDefaultDebugger64.exe -g -c ".dump /ma /u C:\UserDumps\TDD; qd"
and
C:\> ntsd -pn TestDefaultDebugger64.exe -g -x -c “.dump /ma /u C:\UserDumps\TDD; qd”
Also drwtsn32.exe was set as a default postmortem debugger (but we could also use CDB, WinDbg or any other process dumper as shown in Vista example).
The first diagram shows that an attached debugger (a screenshot of WinDbg is used in place of NTSD for both diagrams) receives a first-chance debugger event and saves a process memory dump, then detaches and the previous debuggee process continues looking for exception handlers and not finding anyone launches a postmortem debugger and, as a result, another dump is saved too:
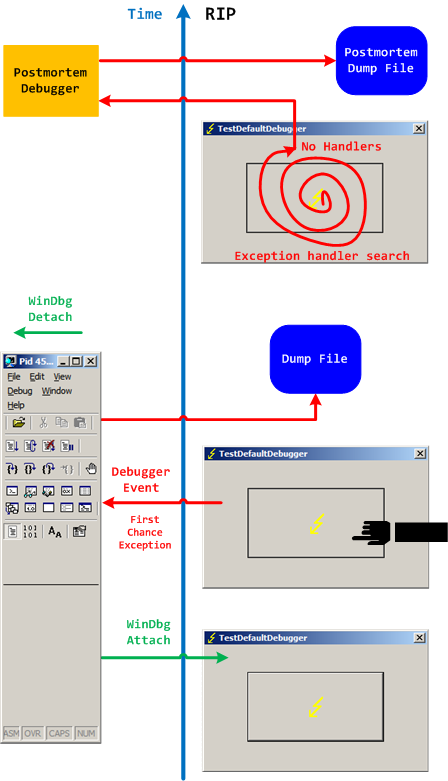
We can double check the first-chance exception dump file to see if it is the right one. Indeed, there are no signs of exception processing on thread raw stack:
This dump file has an exception of interest stored in it.

The stored exception information can be accessed via .ecxr.

(e50.e54): Access violation - code c0000005 (first/second chance not available)

*** ERROR: Module load completed but symbols could not be loaded for TestDefaultDebugger64.exe

TestDefaultDebugger64+0×1570:

00000000`00401570 c704250000000000000000 mov dword ptr [0],0 ds:00000000`00000000=????????
0:000> !teb

TEB at 000007fffffde000

    ExceptionList:        0000000000000000

    StackBase:            0000000000130000

    StackLimit:           000000000012c000

    SubSystemTib:         0000000000000000

    FiberData:            0000000000001e00

    ArbitraryUserPointer: 0000000000000000

    Self:                 000007fffffde000

    EnvironmentPointer:   0000000000000000

    ClientId:             0000000000000e50 . 0000000000000e54

    RpcHandle:            0000000000000000

    Tls Storage:          0000000000000000

    PEB Address:          000007fffffda000

    LastErrorValue:       0

    LastStatusValue:      c0000023

    Count Owned Locks:    0

    HardErrorMode:        0
0:000> dqs 000000000012c000 0000000000130000

00000000`0012c000  00000000`00000000

00000000`0012c008  00000000`00000000

00000000`0012c010  00000000`00000000

00000000`0012c018  00000000`00000000
[... no c0000005 ...]
00000000`0012ff60  00000000`00000000

00000000`0012ff68  00000000`00000000

00000000`0012ff70  00000000`00000000

00000000`0012ff78  00000000`77d596ac kernel32!BaseProcessStart+0x29

00000000`0012ff80  00000000`00000000

00000000`0012ff88  00000000`00000000

00000000`0012ff90  00000000`00000000

00000000`0012ff98  00000000`00000000

00000000`0012ffa0  00000000`00000000

00000000`0012ffa8  00000000`00000000

00000000`0012ffb0  00000000`004148d0 TestDefaultDebugger64+0x148d0

00000000`0012ffb8  00000000`00000000

00000000`0012ffc0  00000000`00000000

00000000`0012ffc8  00000000`00000000

00000000`0012ffd0  00000000`00000000

00000000`0012ffd8  00000000`00000000

00000000`0012ffe0  00000000`00000000

00000000`0012ffe8  00000000`00000000

00000000`0012fff0  00000000`00000000

00000000`0012fff8  00000000`00000000

00000000`00130000  00000020`78746341
The second diagram shows that an attached debugger ignores a first-chance debugger event but saves a process memory dump upon a second-chance exception event after the debugee can’t find any handlers, then detaches and the previous debuggee process launches a postmortem debugger to save another postmortem memory dump:
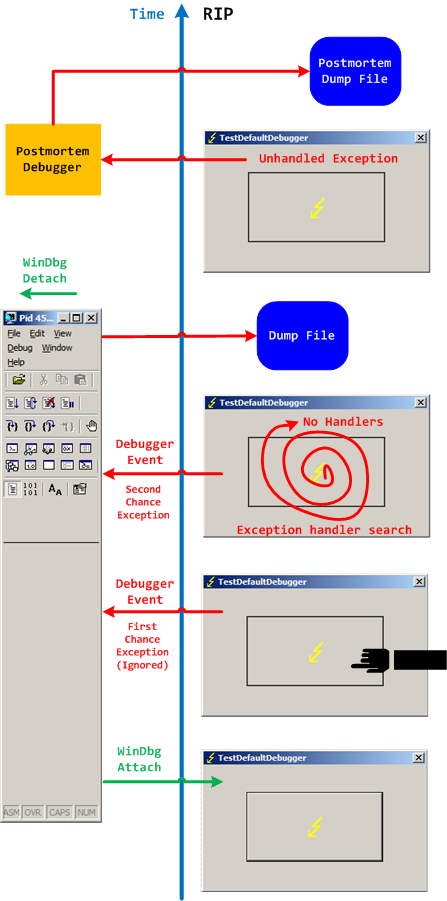
In both second-chance and postmortem process memory dump files we can find c0000005 exception code on thread raw stack.
- Dmitry Vostokov @ DumpAnalysis.org + TraceAnalysis.org -
Posted in Crash Dump Analysis, Debugging | No Comments »
Monday, February 1st, 2010
While testing a WinDbg script for the CARE system (the script enumerates files on a Windows PC and processes memory dumps to generate a log file with the output of debugger commands) I found that after successful processing of many files the next launched WinDbg instance suddenly showed this message box:
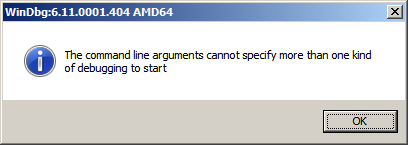
To find out, I attached another WinDbg instance to its process in order to examine the real command line. In this small case study instead of using kb WinDbg command to show a stack trace and its arguments I employ kn, .frame and kb <lines> commands for visual clarity and to illustrate strack trace frame navigation. In the failed WinDbg instance that had just started we see only one thread showing Message Box pattern:
0:000> ~*kn
.  0  Id: dc8.fb4 Suspend: 1 Teb: 000007ff`fffdc000 Unfrozen

 # Child-SP          RetAddr           Call Site

00 00000000`0025d4b8 00000000`76fc5118 USER32!NtUserWaitMessage+0xa

01 00000000`0025d4c0 00000000`76fc5770 USER32!DialogBox2+0x261

02 00000000`0025d540 00000000`7701000d USER32!InternalDialogBox+0x134

03 00000000`0025d5a0 00000000`7700f2b8 USER32!SoftModalMessageBox+0x9fb

04 00000000`0025d6d0 00000000`7700eb17 USER32!MessageBoxWorker+0x314

05 00000000`0025d890 00000000`7700ea10 USER32!MessageBoxTimeoutW+0xb3

06 00000000`0025d950 00000001`3f9016a6 USER32!MessageBoxW+0x4c

07 00000000`0025d990 00000001`3f90175c WinDbg!TextMsgBox+0x96

08 00000000`0025d9d0 00000001`3f9017d7 WinDbg!FormatMsgBoxV+0x9c

09 00000000`0025dbe0 00000001`3f9075c7 WinDbg!InfoBox+0x37

0a 00000000`0025dc20 00000001`3f9084f7 WinDbg!ParseCommandLine+0x1a57

0b 00000000`0025dcc0 00000001`3f913739 WinDbg!wmain+0×287

0c 00000000`0025fd80 00000000`7708be3d WinDbg!_CxxFrameHandler3+0×291

0d 00000000`0025fdc0 00000000`771c6a51 kernel32!BaseThreadInitThunk+0xd

0e 00000000`0025fdf0 00000000`00000000 ntdll!RtlUserThreadStart+0×1d
We see the frame # 0b contains the return address of wmain function (starting point of execution of UNICODE C/C++ programs) that has this prototype:
int wmain(int argc, wchar_t *argv[], wchar_t *envp[]);
We switch to that frame to examine its first 3 parameters and use kb command that shows stack traces starting from the current frame (we are interested in the top stack trace line only):
0:000> .frame b

0b 00000000`0025dcc0 00000001`3f913739 WinDbg!wmain+0×287
0:000> kb 1

RetAddr           : Args to Child                                                           : Call Site

00000001`3f913739 : 00000000`0000000c 00000000`00278b60 00000000`00279e10 000007de`a4ecc920 : WinDbg!wmain+0×287
Because the function prototype shows the second function parameter as an array of wide character null-terminated strings we use dpu command to dump them. We also note that we have only 0xc array members and use this as the length argument for dpu:
0:000> dpu 00000000`00278b60 Lc

00000000`00278b60  00000000`00278bc8 “C:\Program Files\Debugging Tools for Windows (x64)\WinD”

00000000`00278b68  00000000`00278c44 “-y”

00000000`00278b70  00000000`00278c4a “srv*c:\ms*http://msdl.microsoft.com/download/symbols;sr”

00000000`00278b78  00000000`00278d0c “-z”

00000000`00278b80  00000000`00278d12 “C:\MemoryDumps\CST\ColorimetricTracing”

00000000`00278b88  00000000`00278d60 “(4).DMP”

00000000`00278b90  00000000`00278d70 “-c”

00000000`00278b98  00000000`00278d76 “$$>a<DebuggerLogs.txt;q”

00000000`00278ba0  00000000`00278da6 “-Q”

00000000`00278ba8  00000000`00278dac “-QS”

00000000`00278bb0  00000000`00278db4 “-QY”

00000000`00278bb8  00000000`00278dbc “-QSY”
We see in the output above that “C:\MemoryDumps\CST\ColorimetricTracing” and “(4).DMP” strings were probably split from one file name “C:\MemoryDumps\CST\ColorimetricTracing (4).DMP” and this means that we forgot to enclose the file name parameter in double quotation marks when passing it from VB script to WinDbg.
- Dmitry Vostokov @ DumpAnalysis.org + TraceAnalysis.org -
Posted in Crash Analysis Report Environment (CARE), Crash Dump Analysis, Crash Dump Patterns, Debugging, WinDbg Scripts | No Comments »
Sunday, January 31st, 2010
If those bugs had been around for hundreds of millions of years before evolution climbed mount improbable to design human species does it mean that software bugs came before intelligent software? 
- Dmitry Vostokov @ DumpAnalysis.org + TraceAnalysis.org -
Posted in Debugging, Fun with Crash Dumps | No Comments »
Sunday, January 31st, 2010
Software “bugs have been around for” decades.
A bugtated quotation from one website dedicated to bed bugs
- Dmitry Vostokov @ DumpAnalysis.org + TraceAnalysis.org -
Posted in Bugtations, Debugging | No Comments »
Sunday, January 31st, 2010
Debugging at large. Remember those bugs from The Day Earth Stood Still movie that were nicely deactivated at once? Remember Nobel Laureate Professor Barnhardt was threading with Klaatu over the correct version of General Relativity on a blackboard and then at once realized that he was talking to an alien? His next phrase was the one that I repeat every day (and I also listen to Bach every day):
“I have so many questions to ask” this memory dump.
The Day the Earth Stood Still (2008 film)
- Dmitry Vostokov @ DumpAnalysis.org + TraceAnalysis.org -
Posted in Bugtations, Crash Dump Analysis, Debugging, Fun with Crash Dumps, Movies and Debugging | No Comments »
Friday, January 29th, 2010
These are scripts that can be run without modification in both user and kernel modes to collect information from user and kernel spaces. For example, we want to collect thread stack traces for CARE system and we have different kinds of memory dumps stored on our computer. There is no a single command that can show stack traces for all threads in a process and kernel / complete memory dumps. However, we can combine separate mode-sensitive commands in one script:
.kframes 1000

!for_each_thread !thread @#Thread 1f

~*kv
The first command eliminates the common mistake of truncated traces. The second command fails for process user memory dumps but shows full 3-parameter stack trace for every thread in a system including user space thread stack counterpart for complete memory dumps after switching to the appropriate process context if any. The third command fails for kernel and complete memory dumps but lists stack traces for each thread in a process user memory dump. Therefore, we have just one script that we can run against all memory dumps.
- Dmitry Vostokov @ DumpAnalysis.org + TraceAnalysis.org -
Posted in Crash Analysis Report Environment (CARE), Crash Dump Analysis, Crash Dump Patterns, Debugging, WinDbg Scripts, WinDbg Tips and Tricks | 1 Comment »
Wednesday, January 27th, 2010
What screen resolutions do debuggers use? Google analytics provides statistics for 2009. 1,071 different screen resolutions were used (I guess this diversity comes from multi-monitor configurations and PDA) with top 10:
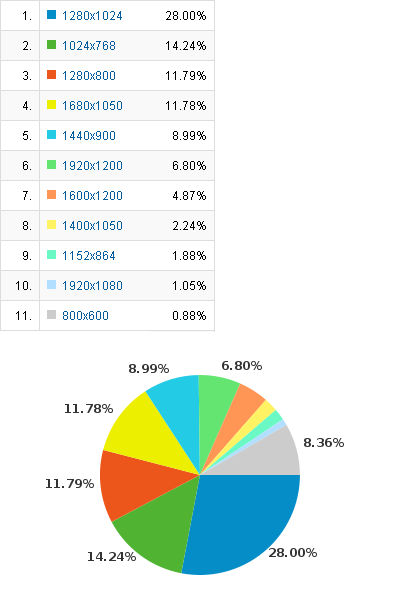
Clearly old 800×600 is in minority today. There were lucky debuggers with 5120×1024 (128-bit ready for wider stack traces?) and 3840×2100 (I need more book sales for that) and even someone with screen resolution 0×0 viewed the content 12 times.
- Dmitry Vostokov @ DumpAnalysis.org + TraceAnalysis.org -
Posted in Announcements, Crash Dump Analysis, Debugging, DumpAnalysis.org Statistics | No Comments »
Tuesday, January 26th, 2010
Bug-sistential - pertaining to existing bugs
Bug-sistentialism - a pessimistic outlook about the existence of bugs
Examples: What a bug-sistential problem we have to solve here! Pure bug-sistentialism!
- Dmitry Vostokov @ DumpAnalysis.org + TraceAnalysis.org -
Posted in Crash Dump Analysis, Debugging, Debugging Slang, Fun with Crash Dumps, New Words | No Comments »