Archive for the ‘Debugging’ Category
Wednesday, December 30th, 2009
Thanks to Sonny Mir who pointed to !filecache WinDbg command to diagnose low VACB (Virtual Address Control Block or View Address Control Block) conditions I was able to discern another Insufficient Memory pattern for control blocks in general. Certain system and subsystem architectures and designs may put a hard limit on the amount of data structures created to manage resources. If there is a dependency on such resources from other subsystems there could be starvation and blockage conditions resulting in a sluggish system behaviour, absence of a functional response and even in some cases a perceived system, service or application freeze.
7: kd> !filecache

***** Dump file cache******

  Reading and sorting VACBs ...

  Removed 0 nonactive VACBs, processing 1907 active VACBs …

File Cache Information

  Current size 408276 kb

  Peak size    468992 kb

  1907 Control Areas

[…]
I plan to add more insufficient control block case studies including user space.
- Dmitry Vostokov @ DumpAnalysis.org -
Posted in Crash Dump Analysis, Crash Dump Patterns, Debugging, Software Architecture, WinDbg Tips and Tricks | 1 Comment »
Sunday, December 27th, 2009
Main topics of Debugged! MZ/PE magazine issues for June and September 2010:
Debugged! MZ/PE: Multiplatform Software Defects, June, 2010 (Paperback, ISBN: 978-1906717902)
Debugged! MZ/PE: Software Defect Visualization and Annotation, September, 2010 (Paperback, ISBN: 978-1906717919)
Here are draft front covers designed today:
- Dmitry Vostokov @ DumpAnalysis.org -
Posted in Announcements, Books, Computer Science, Crash Dump Analysis, Debugged! MZ/PE, Debugging, Memory Visualization, Publishing, Software Engineering, Software Technical Support, Software Trace Analysis, Software Trace Visualization | No Comments »
Wednesday, December 23rd, 2009
See the greeting card on the portal together with New Year’s Eve code analysis puzzle:
DumpAnalysis.org Wishes Happy New Year 7DA!
- Dmitry Vostokov @ DumpAnalysis.org -
Posted in Announcements, Assembly Language, Code Reading, Crash Dump Analysis, Debugging, Fun with Crash Dumps, Games for Debugging, Software Engineering, Software Technical Support | No Comments »
Sunday, December 20th, 2009
a mad day - a day spent doing memory (dump) analysis and/or debugging
Examples: What a mad day! We had several blokes at a bobo address. Those events were rather sad.
- Dmitry Vostokov @ DumpAnalysis.org -
Posted in Crash Dump Analysis, Debugging, Debugging Slang, Fun with Crash Dumps, New Acronyms | No Comments »
Sunday, December 20th, 2009
“Memory dumps are facts.”
I’m very excited to announce that Volume 3 is available in paperback, hardcover and digital editions:
Memory Dump Analysis Anthology, Volume 3
Table of Contents
In two weeks paperback edition should also appear on Amazon and other bookstores. Amazon hardcover edition is planned to be available in January 2010.
The amount of information was so voluminous that I had to split the originally planned volume into two. Volume 4 should appear by the middle of February together with Color Supplement for Volumes 1-4.
- Dmitry Vostokov @ DumpAnalysis.org -
Posted in .NET Debugging, Aesthetics of Memory Dumps, Announcements, AntiPatterns, Art, Assembly Language, Books, Bugtations, C and C++, CDA Pattern Classification, CDF Analysis Tips and Tricks, Certification, Citrix, Code Reading, Common Mistakes, Computer Science, Crash Dump Analysis, Crash Dump Patterns, Crash Dumps for Dummies, DebugWare Patterns, Debugging, Debugging Slang, Deep Down C++, Education and Research, Escalation Engineering, Fun with Crash Dumps, Hardware, Horrors of Computation, Kernel Development, Mathematics of Debugging, Memiotics (Memory Semiotics), Memoidealism, Memoretics, Memory Analysis Culture, Memory Analysis Forensics and Intelligence, Memory Space Art, Memory Visualization, Minidump Analysis, Multithreading, Philosophy, Poetry, Publishing, Science of Memory Dump Analysis, Science of Software Tracing, Security, Software Architecture, Software Defect Construction, Software Engineering, Software Narratology, Software Technical Support, Software Trace Analysis, Software Trace Visualization, Software Tracing for Dummies, Software Victimology, Stack Trace Collection, Testing, Tools, Trace Analysis Patterns, Training and Seminars, Troubleshooting Methodology, Victimware, Virtualization, Vista, Visual Dump Analysis, WinDbg Scripts, WinDbg Tips and Tricks, WinDbg for GDB Users, Windows 7, Windows Server 2008, Windows System Administration | 1 Comment »
Friday, December 18th, 2009
I propose to celebrate it on 08.08 every year starting from The Year of Dump Analysis, 2010, 7DA at 8:00 (I prefer 8pm for MAD Day, moderation is important in debugging too).
What do you think? If you count things from 0 or favour user space there is an alternative date: 07.07
- Dmitry Vostokov @ DumpAnalysis.org -
Posted in Announcements, Crash Dump Analysis, Debugging, Software Engineering, Software Technical Support | 1 Comment »
Thursday, December 17th, 2009
Previously announced Software Maintenance Institute was finally registered in Ireland (Reg. No. 400906) and its certificate was received yesterday.
Here is the current component structure of various institutions (depicted in UML):
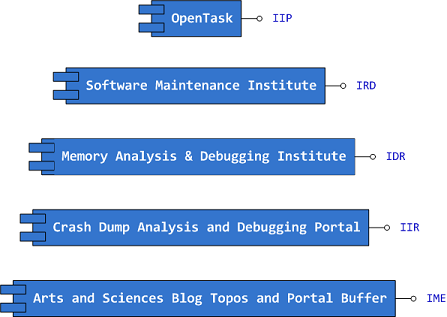
Interface Tags:
IIP Interface of Iterative Publishing

IRD Interface of Research and Development

IDR Interface of Defect Research

IIR Interface of Information Repository

IME Interface of Memetic Engineering
- Dmitry Vostokov @ DumpAnalysis.org -
Posted in Announcements, Art, Certification, Computer Science, Crash Dump Analysis, Debugging, Education and Research, Escalation Engineering, History, Memiotics (Memory Semiotics), Memoidealism, Memoretics, Memory Analysis Culture, Memory Analysis Forensics and Intelligence, Memory Auralization, Memory Visualization, Philosophy, Publishing, Science of Memory Dump Analysis, Science of Software Tracing, Security, Software Architecture, Software Engineering, Software Maintenance Institute, Software Technical Support, Software Trace Analysis, Software Victimology, Testing, Training and Seminars | No Comments »
Wednesday, December 16th, 2009
Finally, after the long delay, the issue is available in print on Amazon and through other sellers:
Debugged! MZ/PE: Software Tracing
- Dmitry Vostokov @ DumpAnalysis.org -
Posted in Announcements, Books, CDF Analysis Tips and Tricks, Computer Science, Crash Dump Analysis, Crash Dump Patterns, Debugged! MZ/PE, Debugging, Education and Research, Fun with Crash Dumps, Memoretics, Memory Visualization, Publishing, Science of Memory Dump Analysis, Science of Software Tracing, Software Technical Support, Software Trace Analysis, Software Trace Visualization, Testing, Tools, Trace Analysis Patterns, Training and Seminars, Troubleshooting Methodology, Visual Dump Analysis | 1 Comment »
Wednesday, December 9th, 2009
In its simplest form the first law of troubleshooting and debugging states that:
The more frequent a problem is, the simpler tool is needed to resolve and fix it.
- Dmitry Vostokov @ DumpAnalysis.org -
Posted in Announcements, Bugtations, DebugWare Patterns, Debugging, Laws of Troubleshooting and Debugging, Software Technical Support, Tools, Troubleshooting Methodology | No Comments »
Tuesday, December 8th, 2009
Advanced .NET Debugging (Addison-Wesley Microsoft Technology Series)
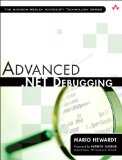
I’ve just started reading this book (see my notes on Software Generalist blog) and this review is written from the perspective of an unmanaged and native software engineer (the last phrase sounds funny). Being a member of a software support of a large software company I analyze crash dumps that have mscorwks.dll on their stack traces. So if you see them too this book helps you to understand what this DLL is all about and how to dig inside the hidden world of .NET it manages. I’m on page 26 and will update this review as soon as I finish the book in a few months. Please also see my review of the previous Mario’s (co-authored with Daniel Pravat) book: Advanced Windows Debugging. It is of great importance to know .NET world for Windows maintenance engineers and I originally planned a similar book Unmanaged Code: Escaping the Matrix of .NET but didn’t have time to finish it yet 
- Dmitry Vostokov @ DumpAnalysis.org -
Posted in .NET Debugging, Books, Crash Dump Analysis, Debugging, Reading Notebook, Reviewed on Amazon, Software Engineering | 3 Comments »
Tuesday, December 8th, 2009
Some debugger commands or commands they invoke can be context-sensitive and their diagnostic output can depend on a current thread or a process set in a debugger, not to mention loaded debugger extensions and even their load order. Therefore, it is advisable to be context-conscious about or at least to know about context sensitivity. For example, in one mmc.exe process memory dump a default analysis command in x64 WinDbg doesn’t show any managed stack trace reported by a user who had seen it in a failure dialog box:
0:000> !analyze -v
[...]
MANAGED_BITNESS_MISMATCH:

Managed code needs matching platform of sos.dll for proper analysis. Use 'x86' debugger.
PRIMARY_PROBLEM_CLASS: STATUS_BREAKPOINT
BUGCHECK_STR: APPLICATION_FAULT_STATUS_BREAKPOINT
STACK_TEXT:

0007fc98 7c827d19 77e6202c 00000002 0007fce8 ntdll!KiFastSystemCallRet

0007fc9c 77e6202c 00000002 0007fce8 00000001 ntdll!NtWaitForMultipleObjects+0xc

0007fd44 7739bbd1 00000002 0007fd6c 00000000 kernel32!WaitForMultipleObjectsEx+0x11a

0007fda0 6c296601 00000001 0007fdd4 ffffffff user32!RealMsgWaitForMultipleObjectsEx+0x141

0007fdc0 6c29684b 000004ff ffffffff 00000001 duser!CoreSC::Wait+0x3a

0007fdf4 6c29693d 0007fe34 00000000 00000000 duser!CoreSC::xwProcessNL+0xab

0007fe14 773b0c02 0007fe34 00000000 00000000 duser!MphProcessMessage+0x2e

0007fe5c 7c828556 0007fe74 00000014 0007ffb0 user32!__ClientGetMessageMPH+0x30

0007fe84 7739c811 7739c844 01116894 00000000 ntdll!KiUserCallbackDispatcher+0x2e

0007fea4 7f072fd6 01116894 00000000 00000000 user32!NtUserGetMessage+0xc

0007fec0 010080ef 01116894 01116860 00000002 mfc42u!CWinThread::PumpMessage+0x16

0007fef0 7f072dda 01116860 01116860 ffffffff mmc!CAMCApp::PumpMessage+0x37

0007ff08 7f044d5b ffffffff 00000002 7ffd9000 mfc42u!CWinThread::Run+0x4a

0007ff1c 01034e19 01000000 00000000 00020710 mfc42u!AfxWinMain+0x7b

0007ffc0 77e6f23b 00000000 00000000 7ffd9000 mmc!wWinMainCRTStartup+0x19d

0007fff0 00000000 01034cb0 00000000 78746341 kernel32!BaseProcessStart+0x23
Instead of concluding that the dump file wasn’t saved at the time of the failure we pay attention to all aspects of the default analysis and see that we need a platform-specific debugger. We load the same dump file into x86 WinDbg:
0:000> !analyze -v
[...]
MANAGED_STACK: !dumpstack -EE

No export dumpstack found
Now we see that we need to load SOS extension explicitly and retry:
0:000> .load C:\WINDOWS\Microsoft.NET\Framework\v2.0.50727\sos.dll
0:000> !analyze -v
[...]
MANAGED_STACK: !dumpstack -EE

OS Thread Id: 0x4ec (0)

Current frame:

ChildEBP RetAddr  Caller,Callee
Managed stack trace is empty here but look at all threads (we list full traces in order not to miss any module) we find one that shows a dialog box reporting a failure:
0:000> ~*kL 100
[...]
  17  Id: 658.7e4 Suspend: 1 Teb: 7ff48000 Unfrozen

ChildEBP RetAddr

06b4f498 7739bf53 ntdll!KiFastSystemCallRet

06b4f4d0 7738965e user32!NtUserWaitMessage+0xc

06b4f4f8 773896a0 user32!InternalDialogBox+0xd0

06b4f518 773896e8 user32!DialogBoxIndirectParamAorW+0x37

06b4f53c 4afde2e1 user32!DialogBoxParamW+0×3f

06b4f584 4b05c4bc mmcndmgr!IsolationAwareDialogBoxParamW+0×4e

06b4f5a4 4b05c6eb mmcndmgr!ATL::CDialogImpl<CSnapInFailureReportDialog, ATL::CWindow>::DoModal+0×4f

06b4f68c 77c80193 mmcndmgr!CSnapInFailureReporter::ReportSnapInFailure+0×195

06b4f6b8 77ce33e1 rpcrt4!Invoke+0×30

06b4fab8 77ce2ed5 rpcrt4!NdrStubCall2+0×299

06b4fb10 7778d01b rpcrt4!CStdStubBuffer_Invoke+0xc6

06b4fb54 7778cfc8 ole32!SyncStubInvoke+0×37

06b4fb9c 776c120b ole32!StubInvoke+0xa7

06b4fc78 776c0bf5 ole32!CCtxComChnl::ContextInvoke+0xec

06b4fc94 776bc455 ole32!MTAInvoke+0×1a

06b4fcc0 7778ced5 ole32!STAInvoke+0×48

06b4fcf4 7778cd66 ole32!AppInvoke+0xa3

06b4fdc8 7778c24d ole32!ComInvokeWithLockAndIPID+0×2c5

06b4fdf0 776bc344 ole32!ComInvoke+0xca

06b4fe04 776bc30f ole32!ThreadDispatch+0×23

06b4fe1c 7739b6e3 ole32!ThreadWndProc+0xfe

06b4fe48 7739b874 user32!InternalCallWinProc+0×28

06b4fec0 7739ba92 user32!UserCallWinProcCheckWow+0×151

06b4ff28 7739bad0 user32!DispatchMessageWorker+0×327

06b4ff38 7768ffdc user32!DispatchMessageW+0xf

06b4ff6c 7768f366 ole32!CDllHost::STAWorkerLoop+0×5c

06b4ff88 7768f2a2 ole32!CDllHost::WorkerThread+0xc8

06b4ff90 776bbab4 ole32!DLLHostThreadEntry+0xd

06b4ffac 776b1704 ole32!CRpcThread::WorkerLoop+0×26

06b4ffb8 77e6482f ole32!CRpcThreadCache::RpcWorkerThreadEntry+0×20

06b4ffec 00000000 kernel32!BaseThreadStart+0×34
The previous thread #16 is a CLR thread loading an assembly:
  16  Id: 658.28c Suspend: 1 Teb: 7ffd4000 Unfrozen

ChildEBP RetAddr

0714d024 7c827d29 ntdll!KiFastSystemCallRet

0714d028 77e61d1e ntdll!ZwWaitForSingleObject+0xc

0714d098 73ca790b kernel32!WaitForSingleObjectEx+0xac

0714d0c4 73ca485a cryptnet!CryptRetrieveObjectByUrlWithTimeout+0x12f

0714d0f0 73ca37ce cryptnet!CryptRetrieveObjectByUrlW+0x9b

0714d168 73ca4a60 cryptnet!RetrieveObjectByUrlValidForSubject+0x5b

0714d1b8 73ca3525 cryptnet!RetrieveTimeValidObjectByUrl+0xbc

0714d220 73ca3473 cryptnet!CTVOAgent::GetTimeValidObjectByUrl+0xc2

0714d2d0 73ca3314 cryptnet!CTVOAgent::GetTimeValidObject+0x2f1

0714d300 73ca2c00 cryptnet!FreshestCrlFromCrlGetTimeValidObject+0x2d

0714d344 73ca43a4 cryptnet!CryptGetTimeValidObject+0x58

0714d3a0 73ca3122 cryptnet!GetTimeValidCrl+0x1e0

0714d3e4 73ca3080 cryptnet!GetBaseCrl+0x34

0714d484 761d9033 cryptnet!MicrosoftCertDllVerifyRevocation+0x128

0714d514 761d8eef crypt32!I_CryptRemainingMilliseconds+0x21b

0714d584 761cf39f crypt32!CertVerifyRevocation+0xb7

0714d604 761c6966 crypt32!CChainPathObject::CalculateRevocationStatus+0x1f2

0714d64c 761c6771 crypt32!CChainPathObject::CalculateAdditionalStatus+0x147

0714d708 761c78bc crypt32!CCertChainEngine::CreateChainContextFromPathGraph+0x227

0714d738 761c783f crypt32!CCertChainEngine::GetChainContext+0x44

0714d760 76bb6d8f crypt32!CertGetCertificateChain+0x60

0714d7c4 76bb6bbc wintrust!_WalkChain+0x1a8

0714d800 76bb39ef wintrust!WintrustCertificateTrust+0xb7

0714d8f4 76bb31e2 wintrust!_VerifyTrust+0x144

0714d918 64025b1b wintrust!WinVerifyTrust+0x4e

0714d9bc 7a117c85 mscorsec!GetPublisher+0xe4

0714da14 79ebeccb mscorwks!PEFile::CheckSecurity+0xcb

0714da3c 79ebec14 mscorwks!PEAssembly::DoLoadSignatureChecks+0x3a

0714da64 79ebf05a mscorwks!PEAssembly::PEAssembly+0x109

0714dd00 79ebf155 mscorwks!PEAssembly::DoOpen+0x103

0714dd94 79eb8ff2 mscorwks!PEAssembly::Open+0x79

0714def8 79eb6a5e mscorwks!AppDomain::BindAssemblySpec+0x247

0714df90 79eb691c mscorwks!PEFile::LoadAssembly+0×95

0714e030 79eb68c0 mscorwks!Module::LoadAssembly+0xee

0714e06c 79e92873 mscorwks!Assembly::FindModuleByTypeRef+0×113

0714e0d8 79fc3dc8 mscorwks!ClassLoader::ResolveTokenToTypeDefThrowing+0×88

0714e12c 79fc953d mscorwks!CEEInfo::AddDependencyOnClassToken+0×103

0714e158 79fc61cf mscorwks!CEEInfo::ScanForModuleDependencies+0xa3

0714e1fc 7908bce1 mscorwks!CEEInfo::getArgType+0×256

0714e214 7908bc5b mscorjit!Compiler::eeGetArgType+0×23

0714e25c 79067745 mscorjit!Compiler::impInlineInitVars+0×3c3

0714e4fc 790673d5 mscorjit!Compiler::fgInvokeInlineeCompiler+0×95

0714e518 79067400 mscorjit!Compiler::fgMorphCallInline+0×41

0714e52c 79065272 mscorjit!Compiler::fgInline+0×30

0714e534 7906513e mscorjit!Compiler::fgMorph+0×45

0714e544 79065b8e mscorjit!Compiler::compCompile+0×83

0714e590 79065d33 mscorjit!Compiler::compCompile+0×44f

0714e618 79066448 mscorjit!jitNativeCode+0xef

0714e63c 79fc7198 mscorjit!CILJit::compileMethod+0×25

0714e6a8 79fc722d mscorwks!invokeCompileMethodHelper+0×72

0714e6ec 79fc72a0 mscorwks!invokeCompileMethod+0×31

0714e740 79fc7019 mscorwks!CallCompileMethodWithSEHWrapper+0×5b

0714eae8 79fc6ddb mscorwks!UnsafeJitFunction+0×31b

0714eb8c 79e811a3 mscorwks!MethodDesc::MakeJitWorker+0×1a8

0714ebe4 79e81363 mscorwks!MethodDesc::DoPrestub+0×41b

0714ec34 01c01efe mscorwks!PreStubWorker+0xf3

WARNING: Frame IP not in any known module. Following frames may be wrong.

0714ec4c 06b08f29 0×1c01efe

0714ecb4 06b088dc 0×6b08f29

0714edf0 79e71b4c 0×6b088dc

0714edf4 79e7e45d mscorwks!CallDescrWorker+0×33

0714eeac 79e968b0 mscorwks!MethodDesc::IsSharedByGenericInstantiations+0×1c

0714ef2c 79e9eeb2 mscorwks!MetaSig::MetaSig+0×3a

0714f258 00000000 mscorwks!JIT_MonReliableEnter+0×120
If we switch to it we get a managed stack:
0:000> ~16s

eax=0714ce90 ebx=048bb528 ecx=77e63d5b edx=7ffd4000 esi=0000073c edi=00000000

eip=7c82860c esp=0714d028 ebp=0714d098 iopl=0 nv up ei ng nz ac pe cy

cs=001b ss=0023 ds=0023 es=0023 fs=003b gs=0000 efl=00000297

ntdll!KiFastSystemCallRet:

7c82860c c3              ret
0:016> !analyze -v
[...]
MANAGED_STACK: !dumpstack -EE

OS Thread Id: 0x28c (16)

Current frame:

ChildEBP RetAddr  Caller,Callee

[...]

0714f264 792e0c3a (MethodDesc 0x79104344 +0xa System.Reflection.RuntimeMethodInfo.GetParametersNoCopy())

0714f28c 792d52d8 (MethodDesc 0x790c5058 +0x48 System.RuntimeMethodHandle.InvokeMethodFast(System.Object, System.Object[], System.Signature, System.Reflection.MethodAttributes, System.RuntimeTypeHandle))

0714f2dc 792d5086 (MethodDesc 0x791043a4 +0x106 System.Reflection.RuntimeMethodInfo.Invoke(System.Object, System.Reflection.BindingFlags, System.Reflection.Binder, System.Object[], System.Globalization.CultureInfo, Boolean))

0714f314 792d4f6e (MethodDesc 0x7910439c +0x1e System.Reflection.RuntimeMethodInfo.Invoke(System.Object, System.Reflection.BindingFlags, System.Reflection.Binder, System.Object[], System.Globalization.CultureInfo))

0714f338 7928ea4b (MethodDesc 0x79108798 +0x82b System.RuntimeType.InvokeMember(System.String, System.Reflection.BindingFlags, System.Reflection.Binder, System.Object, System.Object[], System.Reflection.ParameterModifier[], System.Globalization.CultureInfo, System.String[]))

0714f478 7973ea9d (MethodDesc 0x79108264 +0x1d System.Type.InvokeMember(System.String, System.Reflection.BindingFlags, System.Reflection.Binder, System.Object, System.Object[]))

[...]

0714f588 792d6cf6 (MethodDesc 0x791939dc +0x66 System.Threading.ThreadHelper.ThreadStart_Context(System.Object))

0714f594 792e019f (MethodDesc 0x7910276c +0x6f System.Threading.ExecutionContext.Run(System.Threading.ExecutionContext, System.Threading.ContextCallback, System.Object))

0714f5a8 792d6c74 (MethodDesc 0x790fbde4 +0x44 System.Threading.ThreadHelper.ThreadStart())
- Dmitry Vostokov @ DumpAnalysis.org -
Posted in .NET Debugging, Common Mistakes, Crash Dump Analysis, Crash Dump Patterns, Debugging | 2 Comments »
Monday, December 7th, 2009
In cases where we don’t see managed code exceptions or managed stack traces by default, we need to identify CLR threads in order to try various SOS commands and start digging into a managed realm. These threads are easily distinguished by mscorwks module on their stack traces (don’t forget to list full stack traces):
0:000> ~*kL 100
.  0  Id: 658.4ec Suspend: 1 Teb: 7ffdf000 Unfrozen

ChildEBP RetAddr

0007fc98 7c827d19 ntdll!KiFastSystemCallRet

0007fc9c 77e6202c ntdll!NtWaitForMultipleObjects+0xc

0007fd44 7739bbd1 kernel32!WaitForMultipleObjectsEx+0x11a

0007fda0 6c296601 user32!RealMsgWaitForMultipleObjectsEx+0x141

0007fdc0 6c29684b duser!CoreSC::Wait+0x3a

0007fdf4 6c29693d duser!CoreSC::xwProcessNL+0xab

0007fe14 773b0c02 duser!MphProcessMessage+0x2e

0007fe5c 7c828556 user32!__ClientGetMessageMPH+0x30

0007fe84 7739c811 ntdll!KiUserCallbackDispatcher+0x2e

0007fea4 7f072fd6 user32!NtUserGetMessage+0xc

0007fec0 010080ef mfc42u!CWinThread::PumpMessage+0x16

0007fef0 7f072dda mmc!CAMCApp::PumpMessage+0x37

0007ff08 7f044d5b mfc42u!CWinThread::Run+0x4a

0007ff1c 01034e19 mfc42u!AfxWinMain+0x7b

0007ffc0 77e6f23b mmc!wWinMainCRTStartup+0x19d

0007fff0 00000000 kernel32!BaseProcessStart+0x23
   1  Id: 658.82c Suspend: 1 Teb: 7ffde000 Unfrozen

ChildEBP RetAddr

003afea0 7c827d19 ntdll!KiFastSystemCallRet

003afea4 7c80e5bb ntdll!NtWaitForMultipleObjects+0xc

003aff48 7c80e4a2 ntdll!EtwpWaitForMultipleObjectsEx+0xf7

003affb8 77e6482f ntdll!EtwpEventPump+0x27f

003affec 00000000 kernel32!BaseThreadStart+0x34
   2  Id: 658.648 Suspend: 1 Teb: 7ffdd000 Unfrozen

ChildEBP RetAddr

00f3fe18 7c827859 ntdll!KiFastSystemCallRet

00f3fe1c 77c885ac ntdll!NtReplyWaitReceivePortEx+0xc

00f3ff84 77c88792 rpcrt4!LRPC_ADDRESS::ReceiveLotsaCalls+0x198

00f3ff8c 77c8872d rpcrt4!RecvLotsaCallsWrapper+0xd

00f3ffac 77c7b110 rpcrt4!BaseCachedThreadRoutine+0x9d

00f3ffb8 77e6482f rpcrt4!ThreadStartRoutine+0x1b

00f3ffec 00000000 kernel32!BaseThreadStart+0x34
   3  Id: 658.640 Suspend: 1 Teb: 7ffdb000 Unfrozen

ChildEBP RetAddr

0156fdb4 7c827d19 ntdll!KiFastSystemCallRet

0156fdb8 77e6202c ntdll!NtWaitForMultipleObjects+0xc

0156fe60 7739bbd1 kernel32!WaitForMultipleObjectsEx+0x11a

0156febc 6c296601 user32!RealMsgWaitForMultipleObjectsEx+0x141

0156fedc 6c29684b duser!CoreSC::Wait+0x3a

0156ff10 6c28f9e6 duser!CoreSC::xwProcessNL+0xab

0156ff30 6c28bce1 duser!GetMessageExA+0x44

0156ff84 77bcb530 duser!ResourceManager::SharedThreadProc+0xb6

0156ffb8 77e6482f msvcrt!_endthreadex+0xa3

0156ffec 00000000 kernel32!BaseThreadStart+0x34
   4  Id: 658.e74 Suspend: 1 Teb: 7ffda000 Unfrozen

ChildEBP RetAddr

01d1fe30 7c827d19 ntdll!KiFastSystemCallRet

01d1fe34 77e6202c ntdll!NtWaitForMultipleObjects+0xc

01d1fedc 77e62fbe kernel32!WaitForMultipleObjectsEx+0x11a

01d1fef8 79f02541 kernel32!WaitForMultipleObjects+0x18

01d1ff58 79f0249e mscorwks!DebuggerRCThread::MainLoop+0xe9

01d1ff88 79f023c5 mscorwks!DebuggerRCThread::ThreadProc+0xe5

01d1ffb8 77e6482f mscorwks!DebuggerRCThread::ThreadProcStatic+0×9c

01d1ffec 00000000 kernel32!BaseThreadStart+0×34
   5  Id: 658.4d4 Suspend: 1 Teb: 7ffd8000 Unfrozen

ChildEBP RetAddr

03dffcc4 7c827d19 ntdll!KiFastSystemCallRet

03dffcc8 77e6202c ntdll!NtWaitForMultipleObjects+0xc

03dffd70 77e62fbe kernel32!WaitForMultipleObjectsEx+0x11a

03dffd8c 79f92bcb kernel32!WaitForMultipleObjects+0x18

03dffdac 79f97028 mscorwks!WKS::WaitForFinalizerEvent+0×77

03dffdc0 79e9845f mscorwks!WKS::GCHeap::FinalizerThreadWorker+0×49

03dffdd4 79e983fb mscorwks!Thread::DoADCallBack+0×32a

03dffe68 79e98321 mscorwks!Thread::ShouldChangeAbortToUnload+0xe3

03dffea4 79eef6cc mscorwks!Thread::ShouldChangeAbortToUnload+0×30a

03dffecc 79eef6dd mscorwks!ManagedThreadBase_NoADTransition+0×32

03dffedc 79f3c63c mscorwks!ManagedThreadBase::FinalizerBase+0xd

03dfff14 79f92015 mscorwks!WKS::GCHeap::FinalizerThreadStart+0xbb

03dfffb8 77e6482f mscorwks!Thread::intermediateThreadProc+0×49

03dfffec 00000000 kernel32!BaseThreadStart+0×34
   6  Id: 658.f54 Suspend: 1 Teb: 7ffd6000 Unfrozen

ChildEBP RetAddr

040afec4 7c826f69 ntdll!KiFastSystemCallRet

040afec8 77e41ed5 ntdll!NtDelayExecution+0xc

040aff30 79fd8a41 kernel32!SleepEx+0x68

040affac 79fd88ef mscorwks!ThreadpoolMgr::TimerThreadFire+0×6d

040affb8 77e6482f mscorwks!ThreadpoolMgr::TimerThreadStart+0×57

040affec 00000000 kernel32!BaseThreadStart+0×34
   7  Id: 658.988 Suspend: 1 Teb: 7ffd5000 Unfrozen

ChildEBP RetAddr

0410fc2c 7c827d29 ntdll!KiFastSystemCallRet

0410fc30 77e61d1e ntdll!ZwWaitForSingleObject+0xc

0410fca0 79e8c5f9 kernel32!WaitForSingleObjectEx+0xac

0410fce4 79e8c52f mscorwks!PEImage::LoadImage+0×1af

0410fd34 79e8c54e mscorwks!CLREvent::WaitEx+0×117

0410fd48 79ee3f35 mscorwks!CLREvent::Wait+0×17

0410fe14 79f92015 mscorwks!AppDomain::ADUnloadThreadStart+0×308

0410ffb8 77e6482f mscorwks!Thread::intermediateThreadProc+0×49

0410ffec 00000000 kernel32!BaseThreadStart+0×34
   8  Id: 658.e0 Suspend: 1 Teb: 7ff4f000 Unfrozen

ChildEBP RetAddr

0422fcec 7c827d19 ntdll!KiFastSystemCallRet

0422fcf0 7c83c7be ntdll!NtWaitForMultipleObjects+0xc

0422ffb8 77e6482f ntdll!RtlpWaitThread+0x161

0422ffec 00000000 kernel32!BaseThreadStart+0x34
   9  Id: 658.db4 Suspend: 1 Teb: 7ff4e000 Unfrozen

ChildEBP RetAddr

0447fec0 7c827d19 ntdll!KiFastSystemCallRet

0447fec4 77e6202c ntdll!NtWaitForMultipleObjects+0xc

0447ff6c 77e62fbe kernel32!WaitForMultipleObjectsEx+0x11a

0447ff88 76929e35 kernel32!WaitForMultipleObjects+0x18

0447ffb8 77e6482f userenv!NotificationThread+0x5f

0447ffec 00000000 kernel32!BaseThreadStart+0x34
  10  Id: 658.e7c Suspend: 1 Teb: 7ff4c000 Unfrozen

ChildEBP RetAddr

0550ff7c 7c8277f9 ntdll!KiFastSystemCallRet

0550ff80 71b25914 ntdll!NtRemoveIoCompletion+0xc

0550ffb8 77e6482f mswsock!SockAsyncThread+0x69

0550ffec 00000000 kernel32!BaseThreadStart+0x34
[...]
- Dmitry Vostokov @ DumpAnalysis.org -
Posted in .NET Debugging, Crash Dump Analysis, Crash Dump Patterns, Debugging | 5 Comments »
Tuesday, December 1st, 2009
Manifold Memory Space
A multiple virtual memory space view taking into account code and data sharing:
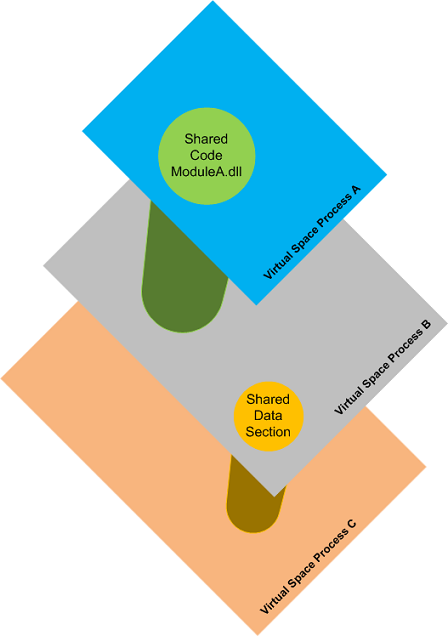
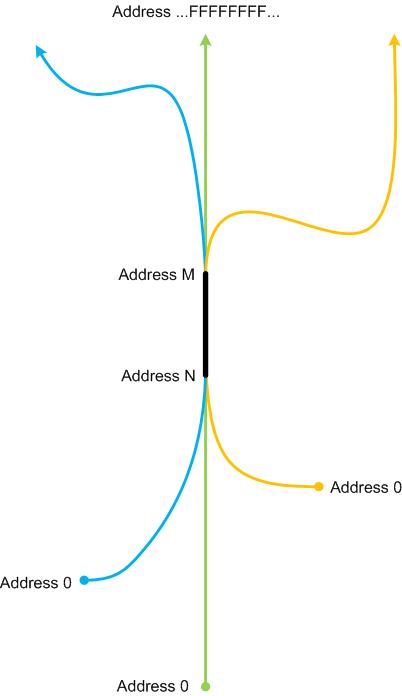
The same physical memory region can be mapped to different virtual memory regions. Here is another example of a sample manifold memory space where a physical memory region is mapped to the same virtual memory address range [N, M] of 3 OS processes:
Synonyms:
Antonyms:
Also: memory space, memory region, physical memory, virtual memory, memory mapping, orbifold memory space.
- Dmitry Vostokov @ DumpAnalysis.org -
Posted in Crash Dump Analysis, Debugging, Dictionary of Debugging, M | 1 Comment »
Wednesday, November 25th, 2009
Highly recommended to listen during analysis of a complete memory dump from an isolated dead system to build tension resulting in a problem resolution in 21 minutes:
Rachmaninov: Symphonic Dances & the Isle of the Dead

- Dmitry Vostokov @ DumpAnalysis.org -
Posted in Computational Ghosts and Bug Hauntings, Crash Dump Analysis, Debugging, Horrors of Computation, Music for Debugging, Occult Debugging | No Comments »
Tuesday, November 24th, 2009
Analysis of .NET managed code requires processor architectural platform specific SOS extension. For example, x64 WinDbg is not able to analyze the managed stack for a managed code exception in 32-bit process:
0:010> !analyze -v
[...]
FAULTING_IP:

kernel32!RaiseException+53

77e4bee7 5e              pop     esi
EXCEPTION_RECORD:  ffffffff -- (.exr 0xffffffffffffffff)

ExceptionAddress: 77e4bee7 (kernel32!RaiseException+0x00000053)

   ExceptionCode: e0434f4d (CLR exception)

  ExceptionFlags: 00000001

NumberParameters: 1

   Parameter[0]: 80131509
[...]
MANAGED_STACK: !dumpstack -EE

No export dumpstack found
MANAGED_BITNESS_MISMATCH:

Managed code needs matching platform of sos.dll for proper analysis. Use ‘x86′ debugger.
[...]
0:010> kL 100

ChildEBP RetAddr

0573f0a4 79f071ac kernel32!RaiseException+0x53

0573f104 79f0a780 mscorwks!RaiseTheExceptionInternalOnly+0x2a8

0573f1a8 058ed3b3 mscorwks!JIT_Rethrow+0xbf

WARNING: Frame IP not in any known module. Following frames may be wrong.

0573f33c 793b0d1f <Unloaded_DllA.dll>+0x58ed3b2

0573f344 79373ecd mscorlib_ni+0x2f0d1f

0573f358 793b0c68 mscorlib_ni+0x2b3ecd

0573f370 79e7c74b mscorlib_ni+0x2f0c68

0573f380 79e7c6cc mscorwks!CallDescrWorker+0x33

0573f400 79e7c8e1 mscorwks!CallDescrWorkerWithHandler+0xa3

0573f53c 79e7c783 mscorwks!MethodDesc::CallDescr+0x19c

0573f558 79e7c90d mscorwks!MethodDesc::CallTargetWorker+0x1f

0573f56c 79fc58cd mscorwks!MethodDescCallSite::Call_RetArgSlot+0x18

0573f754 79ef3207 mscorwks!ThreadNative::KickOffThread_Worker+0x190

0573f768 79ef31a3 mscorwks!Thread::DoADCallBack+0x32a

0573f7fc 79ef30c3 mscorwks!Thread::ShouldChangeAbortToUnload+0xe3

0573f838 79ef4826 mscorwks!Thread::ShouldChangeAbortToUnload+0x30a

0573f860 79fc57b1 mscorwks!Thread::ShouldChangeAbortToUnload+0x33e

0573f878 79fc56ac mscorwks!ManagedThreadBase::KickOff+0x13

0573f914 79f95a2e mscorwks!ThreadNative::KickOffThread+0x269

0573ffb8 77e64829 mscorwks!Thread::intermediateThreadProc+0x49

0573ffec 00000000 kernel32!BaseThreadStart+0x34
So we dutifully run x86 WinDbg and get the better picture of nested exceptions:
0:010> !analyze -v
[...]
MANAGED_STACK: !dumpstack -EE

OS Thread Id: 0xc68 (15)

Current frame:

ChildEBP RetAddr  Caller,Callee
EXCEPTION_OBJECT: !pe 16584f0

Exception object: 016584f0

Exception type: System.InvalidOperationException

Message: There is an error in XML document (12, 12182).

InnerException: System.IO.IOException, use !PrintException 0164f6dc to see more

[…]
StackTraceString: <none>

HResult: 80131509

There are nested exceptions on this thread. Run with -nested for details
EXCEPTION_OBJECT: !pe 164f6dc

Exception object: 0164f6dc

Exception type: System.IO.IOException

Message: Unable to read data from the transport connection: The connection was closed.

InnerException: <none>

[…]
StackTraceString: <none>

HResult: 80131620

There are nested exceptions on this thread. Run with -nested for details
MANAGED_OBJECT: !dumpobj 1655a38

Name: System.String

MethodTable: 790fd8c4

EEClass: 790fd824

Size: 270(0x10e) bytes

 (C:\WINDOWS\assembly\GAC_32\mscorlib\2.0.0.0__[...]\mscorlib.dll)

String: Unable to read data from the transport connection: The connection was closed.
[...]
EXCEPTION_MESSAGE: Unable to read data from the transport connection: The connection was closed.
MANAGED_OBJECT_NAME: System.IO.IOException
[...]
There are other pattern instances of this kind when we need a Platform-Specific Debugger, for example, to do live debugging of an x86 process on x64 machine (needed x64 debugger) or we need to load an old 32-bit DLL extension (needed x86 debugger) for a postmortem analysis.
- Dmitry Vostokov @ DumpAnalysis.org -
Posted in .NET Debugging, Crash Dump Analysis, Crash Dump Patterns, Debugging, WinDbg Tips and Tricks | 1 Comment »
Tuesday, November 24th, 2009
Sometimes the functionality of a system depends upon a specific application or service process. For example, in a database server environment it might be a database process, in printing environment it is a print spooler process or in a terminal services environment it is a terminal services process (termsvc, hosted by svchost.exe). In system failure scenarios we should check these processes for their presence (and also the presence of any coupled processes), hence the name of this pattern: Missing Process. However, if the vital process is present we should check if it is exited but references to it exist or there are any missing threads or components inside it, any suspended threads and special processes like a postmortem debugger. We shouldn’t also forget about service dependencies and their relevant process startup order. For example, we know that our service is hosted by svchost.exe and we see one such process exited but its object still referenced somewhere:
0: kd> !vm
*** Virtual Memory Usage ***

[...]

         0ed8 svchost.exe          0 (         0 Kb)

[…]
However, another command shows that it could be a different service hosted by the same image, svchost.exe, if we know that ServiceA depends on our service:
0: kd> !process 0 0

**** NT ACTIVE PROCESS DUMP ****

PROCESS 8b581818  SessionId: none  Cid: 0004    Peb: 00000000  ParentCid: 0000

    DirBase: bff4d020  ObjectTable: e1001e18  HandleCount: 1601.

    Image: System
PROCESS 8b06d778  SessionId: none  Cid: 01a8    Peb: 7ffde000  ParentCid: 0004

    DirBase: bff4d040  ObjectTable: e13eae40  HandleCount:  22.

    Image: smss.exe
[...]
PROCESS 8aabed88  SessionId: 0  Cid: 0854    Peb: 7ffd6000  ParentCid: 0220

    DirBase: bff4d4a0  ObjectTable: e1c867a8  HandleCount: 778.

    Image: ServiceA.exe
[...]
PROCESS 8aaa6510  SessionId: 0  Cid: 0ed8    Peb: 7ffd4000  ParentCid: 0220

    DirBase: bff4d580  ObjectTable: 00000000  HandleCount:   0.

    Image: svchost.exe
[...]
Another alternative is that our service was restarted but then exited. If our process is not visible it could be possible that it was either stopped or simply crashed before.
- Dmitry Vostokov @ DumpAnalysis.org -
Posted in Crash Dump Analysis, Crash Dump Patterns, Debugging, Troubleshooting Methodology | 1 Comment »
Monday, November 23rd, 2009
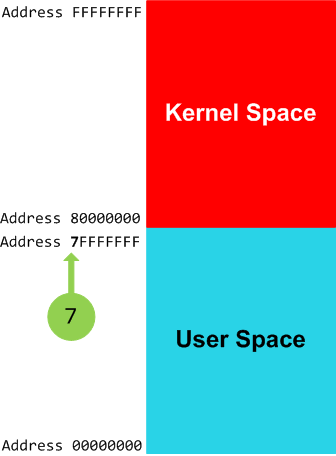
7
A separating digit of user space and kernel space in equi-bipartitional 32-bit virtual memory, for example, on x86 Windows systems:
RetAddr

80833491 nt!KiSwapContext+0×26

80828f2b nt!KiSwapThread+0×2e5

8099490a nt!KeDelayExecutionThread+0×2ab

808897cc nt!NtDelayExecution+0×84

7c82860c nt!KiFastCallEntry+0xfc

7c826f69 ntdll!KiFastSystemCallRet

7c83d454 ntdll!NtDelayExecution+0xc

77e6482f ntdll!RtlpTimerThread+0×47

00000000 kernel32!BaseThreadStart+0×34
lkd> lm

start    end        module name

[…]

77bd0000 77c19000   GDI32

77c20000 77cbf000   RPCRT4

77cd0000 77d5b000   OLEAUT32

77e20000 77eb2000   USER32

77ec0000 77f12000   SHLWAPI

77f30000 77fdc000   ADVAPI32

7c800000 7c915000   kernel32

7c920000 7c9e8000   ntdll

7c9f0000 7d1f9000   SHELL32

7e020000 7e02f000   SAMLIB

80800000 80a5d000   nt

80a5d000 80a89000   hal

bf800000 bf9d0000   win32k

[…]
This number continues to be used on x64 Windows systems, for example:
RetAddr           Call Site

fffff800`0167e082 nt!KiSwapContext+0×7a

fffff800`0167a34b nt!KiCommitThreadWait+0×1d2

fffff800`01973def nt!KeWaitForMultipleObjects+0×271

fffff800`019746f6 nt!ObpWaitForMultipleObjects+0×294

fffff800`01675ed3 nt!NtWaitForMultipleObjects+0xe5

00000000`77ca030a nt!KiSystemServiceCopyEnd+0×13
lkd> lm

start             end               module name

00000000`774a0000 00000000`7756d000 USER32

00000000`77570000 00000000`7769d000 kernel32

00000000`776a0000 00000000`77826000 ntdll

00000000`ffe60000 00000000`ffec0000 services

000007fe`fca90000 000007fe`fca97000 wshtcpip

000007fe`fcae0000 000007fe`fcb0c000 NTMARTA

000007fe`fcbe0000 000007fe`fcc34000 schannel

000007fe`fce10000 000007fe`fce5f000 mswsock

000007fe`fcf60000 000007fe`fcf69000 credssp

000007fe`fcf90000 000007fe`fcf97000 wship6

000007fe`fd0d0000 000007fe`fd207000 CRYPT32

000007fe`fd260000 000007fe`fd279000 MSASN1

000007fe`fd5a0000 000007fe`fd5b6000 NCObjAPI

000007fe`fd5c0000 000007fe`fd625000 SCESRV

000007fe`fd630000 000007fe`fd665000 apphelp

000007fe`fd680000 000007fe`fd6a6000 AUTHZ

000007fe`fd950000 000007fe`fd96c000 Secur32

000007fe`fd970000 000007fe`fd996000 USERENV

000007fe`fd9a0000 000007fe`fd9bc000 SAMLIB

000007fe`fdc80000 000007fe`fdce4000 GDI32

000007fe`fdd10000 000007fe`fdd1d000 LPK

000007fe`fdd20000 000007fe`fde28000 ADVAPI32

000007fe`fde30000 000007fe`fdecc000 msvcrt

000007fe`fded0000 000007fe`fdefd000 IMM32

000007fe`fdf00000 000007fe`fe0d8000 ole32

000007fe`fe0e0000 000007fe`fe0e7000 NSI

000007fe`fe190000 000007fe`fe22a000 USP10

000007fe`fe230000 000007fe`fe373000 RPCRT4

000007fe`ff340000 000007fe`ff395000 WLDAP32

000007fe`ff540000 000007fe`ff584000 WS2_32

000007fe`ff7d0000 000007fe`ff8d2000 MSCTF

fffff800`01802000 fffff800`01848000 hal

fffff800`01848000 fffff800`01d60000 nt

fffff960`000f0000 fffff960`003a1000 win32k

[…]
Synonyms:
Antonyms:
Also: virtual memory, user space, kernel space, x86, x64, 8
- Dmitry Vostokov @ DumpAnalysis.org -
Posted in 7, Crash Dump Analysis, Debugging, Dictionary of Debugging | No Comments »
Friday, November 20th, 2009
By analogy with a security researcher profession I propose the new title of a software defect researcher as a unified profession combining relevant fields of security research, testing, debugging, memory dump analysis, software reverse engineering, construction and maintenance. At least I consider myself a software defect researcher. If you think you consider yourself too please write a comment to this post. Thank you in advance.
- Dmitry Vostokov @ DumpAnalysis.org -
Posted in Announcements, Crash Dump Analysis, Debugging, Memory Dump Analysis Jobs, Security, Software Engineering, Testing | 1 Comment »
Wednesday, November 18th, 2009
A few days ago I noticed that one euro became 10 times more than its usual conversion value to Russian rouble (ruble). As shown on the picture below it was 1:430.96 instead of expected 1:43.096. At first, I thought of a sudden devaluation and rushed to financial websites for confirmation but they didn’t show any signs of it. I then wanted to announce my findings and cause panic on Wall Street (computers crash there too) but other battles with bugs set this problem aside.

This evening I noticed that it was fixed (remotely, I suppose, on a distant server):

- Dmitry Vostokov @ DumpAnalysis.org -
Posted in Computational Ghosts and Bug Hauntings, Debugging | 1 Comment »
Tuesday, November 17th, 2009
When looking at lengthy traces with thousands and millions of messages (trace statements) we can see regions of activity where statement current (Jm, msg/s) is much higher than in surrounding temporal regions. Hence the name of this pattern, Activity Region. Here is an illustration for a typical ETW/CDF trace where a middle region of activity (Jm2) signifies a system performing some response function like a user session initialization and application launch:
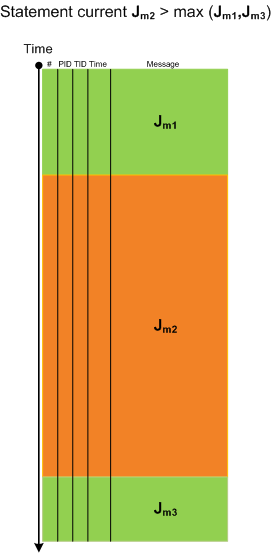
- Dmitry Vostokov @ TraceAnalysis.org -
Posted in CDF Analysis Tips and Tricks, Debugging, Software Trace Analysis, Software Trace Visualization, Trace Analysis Patterns | 8 Comments »