Live Kernel Debugging of a System Freeze: case study
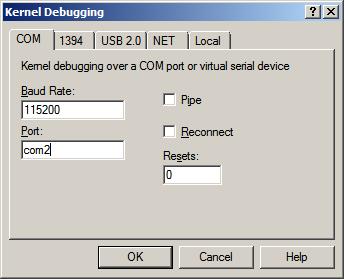
After the installation of a DVD-ROM software coming from Longman Dictionary of Contemporary English for Advanced Learners I tried to launch it and my x64 system was totally frozen. I couldn’t even generate a complete memory dump via a keyboard (during troubleshooting I also discovered that I needed to manually set CrashDumpEnabled value under HKLM \ S \ CCS \ C \ CrashControl to 1 in order to enable complete memory dumps on my W2K8 system and on the next day the arrived 16.4 issue of NT Insider explained me why it was so). Scheduling NotMyFault tool to run 1 minute later after the freeze didn’t help either. So I dug out a dusty null-modem cable and connected it to my freezing W2K8 box (target) and x64 W2K3 box (host). The kernel debugger was already enabled on the problem computer because I used to frequently do local kernel debugging: memory inspection while reading Windows Internals book. The target computer showed satisfactory boot parameters:
C:\Users\Administrator>BCDEdit /dbgsettings

debugtype               Serial

debugport               1

baudrate                115200
So I launched x64 WinDbg on the host and tried to connect to COM2 but got an error message:
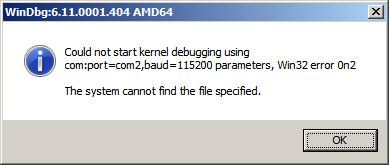
Then I tried to connect to COM1 and it was a success (attaching a cable to two COM ports is like a flip coin game):
Microsoft (R) Windows Debugger Version 6.10.0003.233 AMD64

Copyright (c) Microsoft Corporation. All rights reserved.
Opened \\.\com1

Waiting to reconnect...
When I launched the English dictionary the target system became frozen but on the host system WinDbg became connected:
Connected to Windows 7 6002 x64 target at (Wed Jan  6 20:28:57.734 2010 (GMT+0)), ptr64 TRUE

Kernel Debugger connection established.

Symbol search path is: SRV*c:\websymbols*http://msdl.microsoft.com/download/symbols

Windows 7 Kernel Version 6002 (Service Pack 2) MP (2 procs) Free x64

Product: Server, suite: Enterprise TerminalServer SingleUserTS

Built by: 6002.18082.amd64fre.vistasp2_gdr.090803-2339

Kernel base = 0xfffff800`01813000 PsLoadedModuleList = 0xfffff800`019d7dd0

Debug session time: Wed Jan  6 20:33:41.584 2010 (GMT+0)

System Uptime: 0 days 0:30:50.694

Break instruction exception - code 80000003 (first chance)
* You are seeing this message because you pressed the SysRq/PrintScreen key on your test machine's keyboard.

*

* THIS IS NOT A BUG OR A SYSTEM CRASH

*

* If you did not intend to break into the debugger, press the "g" key, then press the "Enter" key now.  This message might immediately reappear.  If it does, press "g" and "Enter" again.
nt!RtlpBreakWithStatusInstruction:

fffff800`018676f0 cc              int     3
0: kd> g

The context is partially valid. Only x86 user-mode context is available.

WOW64 single step exception - code 4000001e (first chance)

First chance exceptions are reported before any exception handling.

This exception may be expected and handled.

00000000`006661d8 812f00500000    sub     dword ptr [edi],5000h
32.1: kd:x86> !analyze -v

Connected to Windows 7 6002 x64 target at (Wed Jan  6 20:40:16.359 2010 (GMT+0)), ptr64 TRUE
FAULTING_IP:

ldoce5+2661d8

00000000`006661d8 812f00500000    sub     dword ptr [edi],5000h
EXCEPTION_RECORD:  ffffffffffffffff -- (.exr 0xffffffffffffffff)

ExceptionAddress: 00000000006661d8 (ldoce5+0x00000000002661d8)

   ExceptionCode: 4000001e (WOW64 single step exception)

  ExceptionFlags: 00000000

NumberParameters: 0
BUGCHECK_STR: 4000001e
DEFAULT_BUCKET_ID: APPLICATION_FAULT
ERROR_CODE: (NTSTATUS) 0x4000001e - Exception status code used by Win32 x86 emulation subsystem.
EXCEPTION_CODE: (Win32) 0x4000001e (1073741854) - <Unable to get error code text>
NTGLOBALFLAG: 400
FAULTING_THREAD: 0000000000000002
LAST_CONTROL_TRANSFER: from 0000000000000000 to 00000000006661d8
STACK_TEXT:

00000000 00000000 00000000 00000000 00000000 ldoce5+0x2661d8
STACK_COMMAND: kb
FOLLOWUP_IP:

ldoce5+2661d8

00000000`006661d8 812f00500000    sub     dword ptr [edi],5000h
SYMBOL_STACK_INDEX: 0
SYMBOL_NAME: ldoce5+2661d8
FOLLOWUP_NAME: MachineOwner
MODULE_NAME: ldoce5
IMAGE_NAME: ldoce5.exe
DEBUG_FLR_IMAGE_TIMESTAMP: 48b86455
BUCKET_ID: X64_4000001e_ldoce5+2661d8
PRIMARY_PROBLEM_CLASS: APPLICATION_FAULT
FAILURE_BUCKET_ID: APPLICATION_FAULT_4000001e_ldoce5.exe!Unknown
Followup: MachineOwner

---------
Unfortunately, I wasn’t able to resume the system after the first chance exception:
32.1: kd:x86> g

The context is partially valid. Only x86 user-mode context is available.

WOW64 single step exception - code 4000001e (first chance)

First chance exceptions are reported before any exception handling.

This exception may be expected and handled.

ldoce5+0x2661d8:

00000000`006661d8 812f00500000    sub     dword ptr [edi],5000h
Even the usual trick of sxd or sxi commands didn’t help either (probably because of single-step mode). The 32-bit raw stack had this fragment of exception processing residue:
00000000`0136ae8c  0136af74

00000000`0136ae90  00000001

00000000`0136ae94  0136af0c

00000000`0136ae98  77b12062 ntdll_77ad0000!RtlDispatchException+0x1b2

00000000`0136ae9c  0136af24

00000000`0136aea0  0136af74

00000000`0136aea4  00000000

00000000`0136aea8  00000000

00000000`0136aeac  00000000

00000000`0136aeb0  00000000

00000000`0136aeb4  00000000

00000000`0136aeb8  00000000

00000000`0136aebc  00000000

00000000`0136aec0  00000000

00000000`0136aec4  00000000

00000000`0136aec8  00000000

00000000`0136aecc  00000000

00000000`0136aed0  00000000

00000000`0136aed4  00000000

00000000`0136aed8  00000000

00000000`0136aedc  00000000

00000000`0136aee0  00000000

00000000`0136aee4  00000000

00000000`0136aee8  00000000

00000000`0136aeec  00000000

00000000`0136aef0  00000000

00000000`0136aef4  00000000

00000000`0136aef8  00000000

00000000`0136aefc  00000000

00000000`0136af00  01380000

00000000`0136af04  01361000

00000000`0136af08  01000000

00000000`0136af0c  0136b254

00000000`0136af10  77aee49f ntdll_77ad0000!KiUserExceptionDispatcher+0xf

00000000`0136af14  77b197ba ntdll_77ad0000!ZwContinue+0×12

00000000`0136af18  77aee4ad ntdll_77ad0000!KiUserExceptionDispatcher+0×1d

00000000`0136af1c  0136af74

00000000`0136af20  00000000

00000000`0136af24  c000001d

00000000`0136af28  00000000

00000000`0136af2c  00000000

00000000`0136af30  006661af ldoce5+0×2661af

00000000`0136af34  00000000

00000000`0136af38  00000000

00000000`0136af3c  00000000
The exception code c000001d is about illegal instruction:
32.1: kd:x86> !error c000001d

Error code: (NTSTATUS) 0xc000001d (3221225501) - {EXCEPTION}  Illegal Instruction  An attempt was made to execute an illegal instruction.
The following stack trace corresponded to the exception record:
32.1: kd:x86> .cxr 0136af74

eax=007fc400 ebx=00e1c000 ecx=00b64230 edx=00000400 esi=00000000 edi=00bc2784

eip=006661b1 esp=0136b240 ebp=0136b254 iopl=0 nv up ei pl nz na po nc

cs=0023 ss=002b ds=002b es=002b fs=0053 gs=002b efl=00010202

ldoce5+0x2661b1:

00000000`006661b1 eb07       jmp     ldoce5+0x2661ba (006661ba)
32.1: kd:x86> kv

  *** Stack trace for last set context - .thread/.cxr resets it

ChildEBP          RetAddr           Args to Child

WARNING: Stack unwind information not available. Following frames may be wrong.

0136b254 00529002 00cf43b8 00000001 00e1c000 ldoce5+0x2661b1

0136b2a8 0055d184 00000000 00000000 00000000 ldoce5+0x129002

0137f930 77b02c91 76ac4de8 00000000 77b02ae8 ldoce5+0x15d184

0137fe3c 00dbf2d0 00b52dd0 7efde000 00bb9168 ntdll_77ad0000!LdrGetDllHandleEx+0x34c

0137feac 0096eeb5 00000001 036a1498 036a14e0 ldoce5+0x9bf2d0

0137ff94 77b4d24d 7efde000 76ac4ba4 00000000 ldoce5+0x56eeb5

0137ffd4 77b4d45f 00b56c80 7efde000 ffffffff ntdll_77ad0000!__RtlUserThreadStart+0x23

0137ffec 00000000 00b56c80 7efde000 00000000 ntdll_77ad0000!_RtlUserThreadStart+0x1b
Then suddenly a lightning bolt stroke my head! Complete system freeze… May be enabled kernel debugger on the target system was activated when I was launching the English dictionary? The system was then waiting for a debugger to connect… So I rebooted the target:
32.1: kd:x86> .reboot

Shutdown occurred at (Wed Jan  6 22:26:47.828 2010 (GMT+0))...unloading all symbol tables.

Waiting to reconnect...
and quickly disabled debug mode:
C:\Users\Administrator>BCDEdit /debug OFF

The operation completed successfully.
After that I was able to launch the English dictionary! My first hypothesis was that the process somehow generated an exception in WOW64 that triggered the kernel debugger. The belief was reinforced when I attached WinDbg to a running process instance and saw the continuous stream of exceptions:
(11c0.bc4): Unknown exception - code 0eedfade (first chance)

(11c0.bc4): Unknown exception - code 0eedfade (first chance)

(11c0.bc4): Unknown exception - code 0eedfade (first chance)

(11c0.bc4): Unknown exception - code 0eedfade (first chance)

(11c0.bc4): Unknown exception - code 0eedfade (first chance)

(11c0.bc4): Unknown exception - code 0eedfade (first chance)

(11c0.bc4): Unknown exception - code 0eedfade (first chance)

(11c0.bc4): Unknown exception - code 0eedfade (first chance)

(11c0.bc4): Unknown exception - code 0eedfade (first chance)

(11c0.bc4): Unknown exception - code 0eedfade (first chance)

(11c0.bc4): Unknown exception - code 0eedfade (first chance)

(11c0.bc4): Unknown exception - code 0eedfade (first chance)

(11c0.bc4): Unknown exception - code 0eedfade (first chance)

(11c0.bc4): Unknown exception - code 0eedfade (first chance)
However, to my surprise, when I restarted the process, the following DRM dialog appeared:
CommandLine: "C:\Program Files (x86)\Longman\LDOCE5\ldoce5.exe"

Executable search path is:

ModLoad: 00000000`00400000 00000000`00e7c000   image00000000`00400000

ModLoad: 00000000`77980000 00000000`77b06000   ntdll.dll

ModLoad: 00000000`77b40000 00000000`77ca0000   ntdll32.dll

ModLoad: 00000000`75ab0000 00000000`75af5000   C:\Windows\system32\wow64.dll

ModLoad: 00000000`75a60000 00000000`75aae000   C:\Windows\system32\wow64win.dll

ModLoad: 00000000`759b0000 00000000`759b9000   C:\Windows\system32\wow64cpu.dll

(1364.da8): Break instruction exception - code 80000003 (first chance)

ntdll!DbgBreakPoint:

00000000`779c6060 cc              int     3
0:000> g

ModLoad: 00000000`77850000 00000000`7797d000   WOW64_IMAGE_SECTION

ModLoad: 00000000`77670000 00000000`77780000   WOW64_IMAGE_SECTION

ModLoad: 00000000`77850000 00000000`7797d000   NOT_AN_IMAGE

ModLoad: 00000000`77780000 00000000`7784d000   NOT_AN_IMAGE

ModLoad: 00000000`77670000 00000000`77780000   C:\Windows\syswow64\kernel32.dll

ModLoad: 00000000`30000000 00000000`30027000   C:\Program Files (x86)\Longman\LDOCE5\nspr4.dll

ModLoad: 00000000`768a0000 00000000`76966000   C:\Windows\syswow64\ADVAPI32.dll

ModLoad: 00000000`75da0000 00000000`75e90000   C:\Windows\syswow64\RPCRT4.dll

ModLoad: 00000000`75b10000 00000000`75b70000   C:\Windows\syswow64\Secur32.dll

ModLoad: 00000000`72ee0000 00000000`72ee7000   C:\Windows\SysWOW64\WSOCK32.dll

ModLoad: 00000000`75c60000 00000000`75c8d000   C:\Windows\syswow64\WS2_32.dll

ModLoad: 00000000`76140000 00000000`761ea000   C:\Windows\syswow64\msvcrt.dll

ModLoad: 00000000`767c0000 00000000`767c6000   C:\Windows\syswow64\NSI.dll

ModLoad: 00000000`75180000 00000000`751b2000   C:\Windows\SysWOW64\WINMM.dll

ModLoad: 00000000`775a0000 00000000`77670000   C:\Windows\syswow64\USER32.dll

ModLoad: 00000000`76970000 00000000`76a00000   C:\Windows\syswow64\GDI32.dll

ModLoad: 00000000`76200000 00000000`76345000   C:\Windows\syswow64\ole32.dll

ModLoad: 00000000`75d10000 00000000`75d9d000   C:\Windows\syswow64\OLEAUT32.dll

ModLoad: 00000000`74eb0000 00000000`74ee9000   C:\Windows\SysWOW64\OLEACC.dll

ModLoad: 00000000`00020000 00000000`00027000   C:\Program Files (x86)\Longman\LDOCE5\plc4.dll

ModLoad: 00000000`76a00000 00000000`77510000   C:\Windows\syswow64\SHELL32.dll

ModLoad: 00000000`76360000 00000000`763b9000   C:\Windows\syswow64\SHLWAPI.dll

ModLoad: 00000000`759a0000 00000000`759a8000   C:\Windows\SysWOW64\VERSION.dll

(1364.da8): WOW64 breakpoint - code 4000001f (first chance)

First chance exceptions are reported before any exception handling.

This exception may be expected and handled.

ntdll32!DbgBreakPoint:

77b50004 cc              int     3
0:000:x86> g

ModLoad: 766e0000 76740000   C:\Windows\SysWOW64\IMM32.DLL

ModLoad: 767d0000 76898000   C:\Windows\syswow64\MSCTF.dll

ModLoad: 76350000 76359000   C:\Windows\syswow64\LPK.DLL

ModLoad: 75c90000 75d0d000   C:\Windows\syswow64\USP10.dll

ModLoad: 755f0000 7578e000   C:\Windows\WinSxS\x86_microsoft.windows.common-controls_[ ... ]_6.0.6002.18005_none_[ ... ]\ comctl32.dll

ModLoad: 73b20000 73b39000   C:\Windows\SysWOW64\IPHLPAPI.dll

ModLoad: 73ae0000 73b15000   C:\Windows\SysWOW64\dhcpcsvc.DLL

ModLoad: 73ab0000 73adc000   C:\Windows\SysWOW64\DNSAPI.dll

ModLoad: 73aa0000 73aa7000   C:\Windows\SysWOW64\WINNSI.DLL

ModLoad: 73a70000 73a92000   C:\Windows\SysWOW64\dhcpcsvc6.DLL

ModLoad: 761f0000 761f7000   C:\Windows\syswow64\psapi.dll

ModLoad: 00000000`70860000 00000000`708d4000   C:\Windows\SysWOW64\Riched20.dll

ModLoad: 00000000`10000000 00000000`10011000   C:\Users\ADMINI~1\AppData\Local\Temp\drm_dialogs.dll

ModLoad: 00000000`73810000 00000000`73890000   C:\Windows\SysWOW64\UxTheme.dll
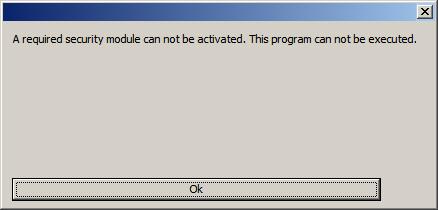
So I had to quit my debugger in order not to interfere with the all mighty Mr. DRM and possible anti-debugging techniques. At least the problem was found and resolved. I was able to use the English dictionary I purchased from Amazon UK (*).
Note: additional purchasing info is recommended to add to discource when discussing DRM issues.
- Dmitry Vostokov @ DumpAnalysis.org -
January 10th, 2010 at 10:43 am
Hello,
I had the same issue with skype:
http://pucadinga.com/2008/10/11/skype-complete-freeze-with-vista/
January 12th, 2010 at 2:01 am
Surely such software if it employs any anti-debugging or anti-reversing techniques shall check the presence of a debuuger and gracefully exit with a message box!
January 25th, 2010 at 10:33 pm
[…] is enabled (p. 348) - this is not an optimal design in my opinion - I had problems with that: http://www.dumpanalysis.org/blog/index.php/2010/01/08/live-kernel-debugging-of-a-system-freeze-case-…. The better way is to show a message box and gracefully exit and only emit AV if message box is […]