Archive for the ‘Memory Visualization’ Category
Tuesday, December 23rd, 2008
The following book is planned for publication during the 1st quarter of 2009:
Title: Reference Stack Traces: Windows Server® 2008 and Windows Vista™
ISBN-13: 978-1-906717-23-0
It features visual separation between kernel and user space in thread stack traces and useful footnotes for IRP and modules. Its publishing was delayed by a few months but fortunately my editing just got new breath by introducing thread stackprint images for kernel stacks (12Kb bitmaps):
Sample pages 13 and 96
Thread stackprints were generated from a complete memory dump using WinDbg scripts and Dump2Picture.
- Dmitry Vostokov @ DumpAnalysis.org -
Posted in Announcements, Books, Crash Dump Analysis, Crash Dump Patterns, Debugging, Fun with Crash Dumps, Memory Visualization, Publishing, Software Technical Support, Stack Trace Collection, Tools, Vista, Windows Server 2008 | No Comments »
Tuesday, December 23rd, 2008
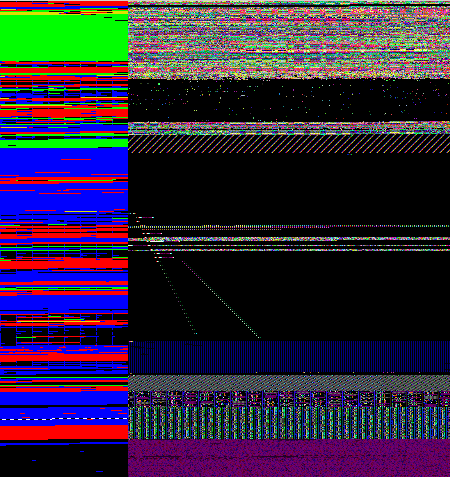
Thanks to the wonderful real-time memory visualization package from Jamie Fenton developed initially as a FreeFrame plugin for FrameLab (a general FreeFrame host adaptor for DirectShow) and now with its own real-time memory viewer GUI front-end I was able to find the evidence for cosmic rays in computer memory! You can see them on this screenshot where the left panel is a condensed virtual memory map of IE process and the right panel is specific page(s) view (I found rays on pages starting from 0×3B4000 address):
- Dmitry Vostokov @ DumpAnalysis.org -
Posted in Announcements, Fun with Crash Dumps, Memory Visualization | 9 Comments »
Sunday, December 14th, 2008
Finally previously announced full-color coffee table book is on sale:
DLL List Landscape: The Art from Computer Memory Space

Memory Dump Analysis Anthology, Volume 1 and Volume 2 have numerous articles related to computer memory visualization techniques using Dump2Picture and Microsoft debugger WinDbg.
I’m also working on Computer Memory Visualization book together with Jamie Fenton that was originally conceived as a coffee table book for general readers but now becomes more software engineering and science oriented the more I work on it. Coffee table status now comes to DLL List Landscape book.
- Dmitry Vostokov @ DumpAnalysis.org -
Posted in Announcements, Art, Books, Memory Space Art, Memory Visualization, Physicalist Art, Publishing | No Comments »
Friday, December 5th, 2008
An interesting observation on how people perceive visualized computer memory where every byte, word or double word is interpreted as a pixel. The printing company initially rejected the interior of my DLL Art book containing pictures from process memory dumps because they thought that the art images were corrupt in PDF file I submitted. They accepted the book after I told them that images were normal and not corrupt. So I hope in one or two weeks the book will be in print.
- Dmitry Vostokov @ DumpAnalysis.org -
Posted in Fun with Crash Dumps, Memory Visualization | No Comments »
Tuesday, November 25th, 2008
As one of the new initiatives for the Year of Debugging DumpAnalysis Portal will publish bimonthly full color 16 page publication called:
Debugged! MZ/PE: MagaZine for/from Practicing Engineers
The only serial publication dedicated entirely to Windows® debugging
The first issue is planned for March, 2009 and will have ISBN-13: 978-1-906717-38-4. If it goes well I’m planning to have ISSN number assigned to it too. More details will be announced soon.
- Dmitry Vostokov @ DumpAnalysis.org -
Posted in Announcements, Assembly Language, Books, Bugchecks Depicted, CDA Pattern Classification, Citrix, Common Mistakes, Crash Dump Analysis, Crash Dump Patterns, Crash Dumps for Dummies, Data Recovery, Debugged! MZ/PE, Debugging, IDA for WinDbg Users, Kernel Development, Memory Analysis Forensics and Intelligence, Memory Visualization, Minidump Analysis, Philosophy, Publishing, Security, Software Technical Support, Testing, Tools, Training and Seminars, Troubleshooting Methodology, Vista, WinDbg Scripts, WinDbg Tips and Tricks, WinDbg for GDB Users, Windows Server 2008 | 4 Comments »
Monday, November 24th, 2008
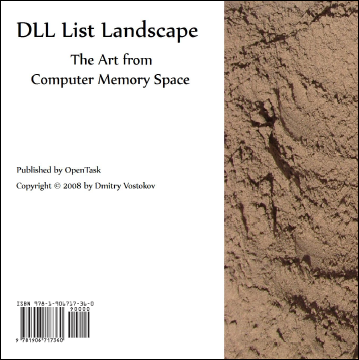
Here are product details and covers for previously announced DLL List Landscape book:
- Title: DLL List Landscape: The Art from Computer Memory Space
- Author: Dmitry Vostokov
- Publisher: Opentask (15 December 2008)
- Language: English
- Product Dimensions: 21.6 x 21.6
- ISBN-13: 978-1-906717-36-0
- Paperback: 16 pages
Front cover:
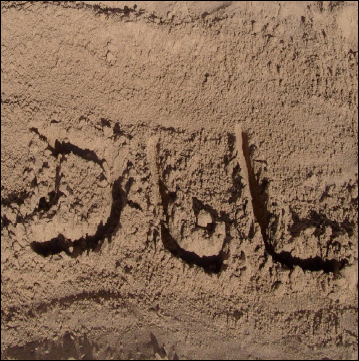
Back cover:
- Dmitry Vostokov @ DumpAnalysis.org -
Posted in Announcements, Art, Books, Memory Visualization, Publishing | 2 Comments »
Sunday, November 23rd, 2008
DLL is also a recursive acronym for DLL List Landscape. OpenTask is going to publish soon the new full color book:
Title: DLL List Landscape: The Art from Computer Memory Space
ISBN-13: 978-1-906717-36-0
More details will be announced tomorrow.
- Dmitry Vostokov @ DumpAnalysis.org -
Posted in Announcements, Books, Crash Dump Analysis, Crash Dump Patterns, Crash Dumps for Dummies, Fun with Crash Dumps, Memory Visualization, New Words, Publishing, Science of Memory Dump Analysis | 1 Comment »
Saturday, October 18th, 2008
Paperback edition of Memory Dump Analysis Anthology, Volume 2 is finally available on Amazon and Barnes & Noble. Search Inside is also available on Amazon. In addition, I updated the list of recommended books:
Listmania! Crash Dump Analysis and Debugging
Hardcover edition will be available on Amazon and B&N in 2-3 weeks.
- Dmitry Vostokov @ DumpAnalysis.org -
Posted in Announcements, Assembly Language, Books, Bugchecks Depicted, CDF Analysis Tips and Tricks, Certification, Citrix, Common Mistakes, Crash Dump Analysis, Crash Dump Patterns, Crash Dumps for Dummies, Data Recovery, DebugWare Patterns, Debugging, Fun with Crash Dumps, Hardware, Kernel Development, Memory Analysis Forensics and Intelligence, Memory Dump Analysis Jobs, Memory Visualization, Minidump Analysis, Music for Debugging, New Words, Philosophy, Publishing, Science of Memory Dump Analysis, Security, Software Architecture, Software Technical Support, Stack Trace Collection, Testing, Tools, Training and Seminars, Troubleshooting Methodology, Virtualization, Vista, WinDbg Scripts, WinDbg Tips and Tricks, WinDbg for GDB Users, Windows Server 2008 | No Comments »
Friday, October 3rd, 2008
“Everything is memory dump.”
I’m very excited to announce that Volume 2 is available in paperback, hardcover and digital editions:
Memory Dump Analysis Anthology, Volume 2
In one or two weeks paperback edition should also appear on Amazon and other bookstores. Amazon hardcover edition is planned to be available by the end of October.
I’m often asked when Volume 3 is available and I currently plan to release it in October - November, 2009. In the mean time I’m planning to concentrate on other publishing projects.
- Dmitry Vostokov @ DumpAnalysis.org -
Posted in Announcements, Assembly Language, Books, Bugchecks Depicted, CDF Analysis Tips and Tricks, Citrix, Common Mistakes, Crash Dump Analysis, Crash Dump Patterns, Crash Dumps for Dummies, Data Recovery, DebugWare Patterns, Debugging, Fun with Crash Dumps, Kernel Development, Memory Analysis Forensics and Intelligence, Memory Dump Analysis Jobs, Memory Visualization, Minidump Analysis, Music for Debugging, New Words, Philosophy, Publishing, Science of Memory Dump Analysis, Security, Software Architecture, Software Technical Support, Stack Trace Collection, Testing, Tools, Training and Seminars, Troubleshooting Methodology, Virtualization, Vista, WinDbg Scripts, WinDbg Tips and Tricks, WinDbg for GDB Users, Windows Server 2008 | No Comments »
Wednesday, October 1st, 2008
The book is nearly finished and here is the final TOC:
Memory Dump Analysis Anthology, Volume 2: Table of Contents
- Dmitry Vostokov @ DumpAnalysis.org -
Posted in Announcements, Assembly Language, Books, Bugchecks Depicted, CDF Analysis Tips and Tricks, Citrix, Common Mistakes, Crash Dump Analysis, Crash Dump Patterns, Crash Dumps for Dummies, Data Recovery, DebugWare Patterns, Debugging, Fun with Crash Dumps, Kernel Development, Memory Dump Analysis Jobs, Memory Visualization, Minidump Analysis, Music for Debugging, Publishing, Science of Memory Dump Analysis, Security, Software Technical Support, Stack Trace Collection, Tools, Troubleshooting Methodology, Virtualization, Vista, WinDbg Scripts, WinDbg Tips and Tricks, WinDbg for GDB Users, Windows Server 2008 | No Comments »
Friday, June 20th, 2008
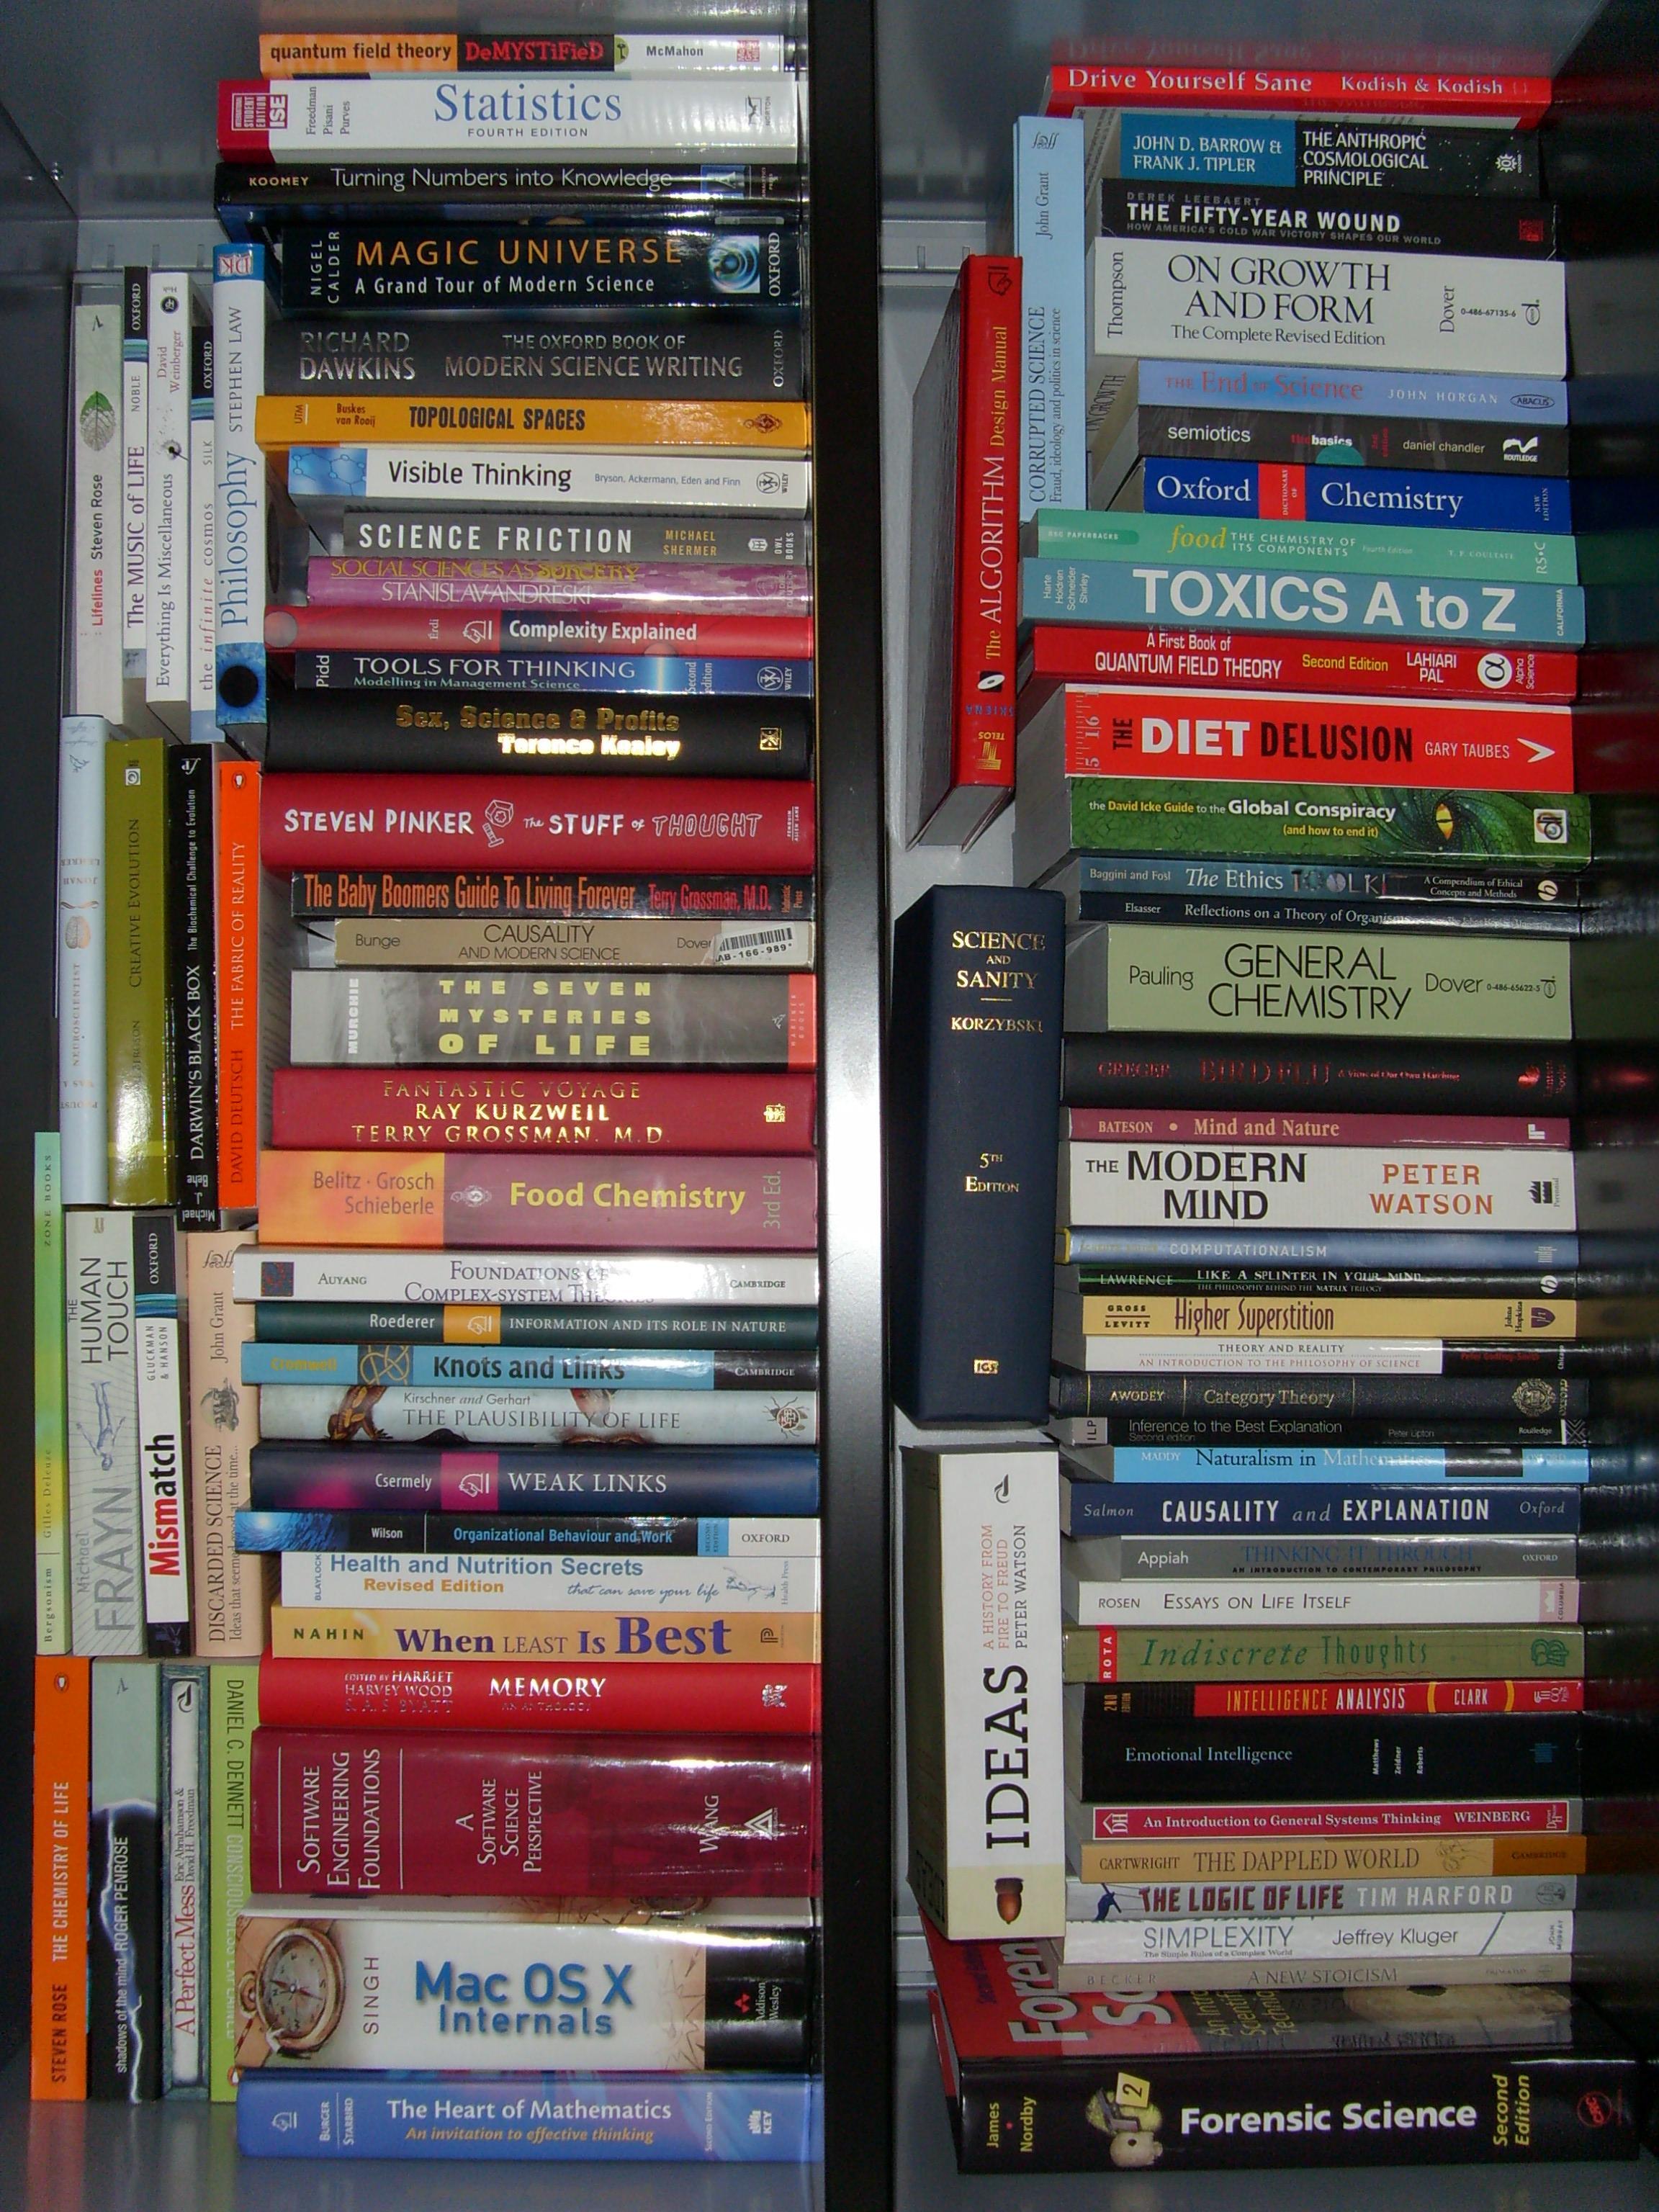
The work for Memory Dump Analysis Anthology, Volume 2 is underway and it is natural to use the modular structure of a book heap again for its front cover. Now it is the partial reading list for this year (click to enlarge):
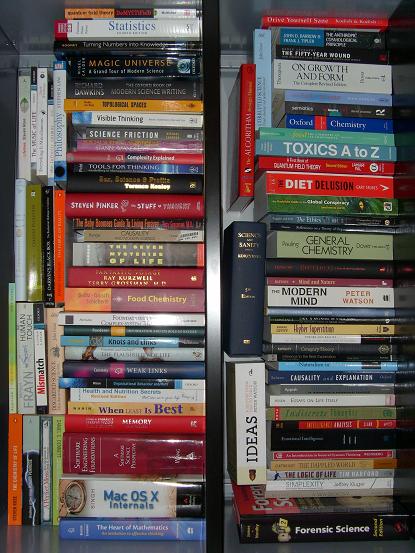
In addition to memory dump allegory the picture also symbolizes kernel / user space split of 4Gb virtual address space :-) Of course, this is just the base image and the book title will be put somewhere on it.
- Dmitry Vostokov @ DumpAnalysis.org -
Posted in Announcements, Books, Crash Dump Analysis, Debugging, Fun with Crash Dumps, Memory Visualization, Publishing | 1 Comment »
Wednesday, June 18th, 2008
Analysis of computer memory snapshots (memory dumps) and their evolution is the domain of memoretics. Computer memory semiotics (memiotics or memosemiotics) is the branch of memoretics that studies the interpretation of computer memory, its meaning, signs and symbols.
- Dmitry Vostokov @ DumpAnalysis.org -
Posted in Announcements, Crash Dump Analysis, Crash Dump Patterns, Crash Dumps for Dummies, Debugging, Fun with Crash Dumps, Memiotics (Memory Semiotics), Memory Analysis Forensics and Intelligence, Memory Visualization, Philosophy, Science of Memory Dump Analysis | 1 Comment »
Tuesday, June 17th, 2008
Looking at computer memory visual images combined with listening to the incredible nostalgic music composed by Oystein Sevag is highly recommended to relieve stress while immersing yourself in the vast depths of memory hierarchy. I really like “Painful Love” tracks. Is love and passion for programming painful?…
Visual
Link

- Dmitry Vostokov @ DumpAnalysis.org -
Posted in Crash Dump Analysis, Debugging, Fun with Crash Dumps, Memory Visualization, Music for Debugging | No Comments »
Tuesday, June 3rd, 2008
More books to come in 2009. One of them is full-color book illustrated with beautiful visual images emerging from inherent modularized structure of modern operating systems and applications. Preliminary product details:
- Title: Computer Memory Visualization
- Authors: Jamie Fenton, Dmitry Vostokov
- Publisher: Opentask (01 February 2009)
- Language: English
- Product Dimensions: 28 x 21.6
- ISBN-13: 978-1-906717-06-3
- Paperback: 64 pages
- Dmitry Vostokov @ DumpAnalysis.org -
Posted in Books, Fun with Crash Dumps, Memory Visualization, Publishing | 1 Comment »
Tuesday, June 3rd, 2008
Full-color special edition is available now. PART 6: Fun with Crash Dumps that features memory dump visualization pictures is the most impressive there. All screenshots and diagrams are color too. The book is thicker, heavier and much more expensive. Print on demand color books are very pricey. It is only available on Lulu because my Ingram distributor, Lightning Source, doesn’t print color books with more than 480 pages:
Memory Dump Analysis Anthology Collector’s Edition, Volume 1
- Dmitry Vostokov @ DumpAnalysis.org -
Posted in Announcements, Books, Fun with Crash Dumps, Memory Visualization, Publishing | No Comments »
Monday, May 12th, 2008
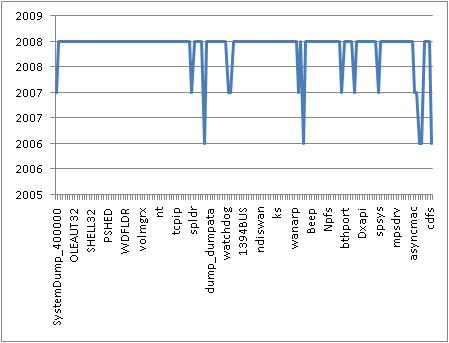
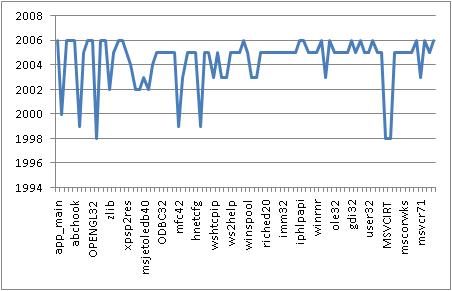
Component Age Diagram (CAD) helps to visualize and pinpoint anomalies in component timestamps. Excel helps here. We can import the output of lmt WinDbg command and get these graphs where peaks can be used to identify old modules. For example, here is a CAD from my Windows Vista SP1 running on MacMini:
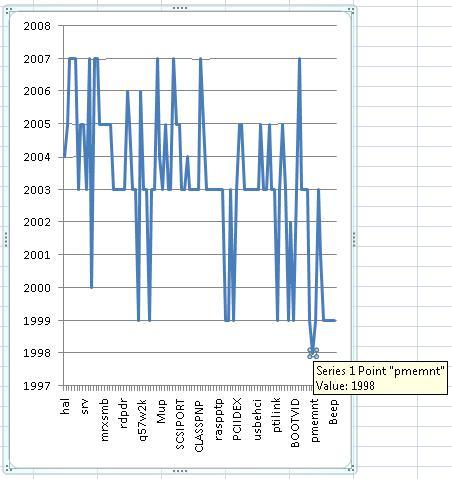
Here is another CAD from Windows 2000 server where the oldest driver is easily identified:
The following CAD diagram is created from lmt output in Module Variety pattern example:
- Dmitry Vostokov @ DumpAnalysis.org -
Posted in Crash Dump Analysis, Crash Dump Patterns, Memory Visualization | 1 Comment »
Friday, April 25th, 2008
Due to demand from people that prefer ebooks I published Memory Dump Analysis Anthology, Volume 1 in a digital format that can be purchased in Crash Dump Analysis Store. This format has color pictures inside.
- Dmitry Vostokov @ DumpAnalysis.org -
Posted in Announcements, Assembly Language, Books, Bugchecks Depicted, Citrix, Crash Dump Analysis, Crash Dump Patterns, Crash Dumps for Dummies, Debugging, Fun with Crash Dumps, GDB for WinDbg Users, Hardware, Kernel Development, Memory Dump Analysis Jobs, Memory Visualization, Minidump Analysis, Publishing, Science of Memory Dump Analysis, Security, Software Architecture, Software Technical Support, Stack Trace Collection, Tools, Troubleshooting Methodology, Vista, WinDbg Scripts, WinDbg Tips and Tricks, WinDbg for GDB Users, Windows Server 2008 | No Comments »
Wednesday, April 16th, 2008
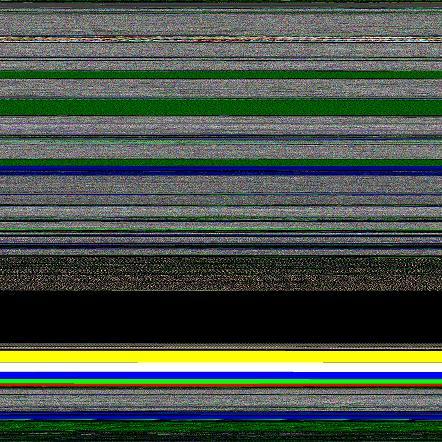
Similar to radiometric dating using isotopes we can use memory visualization techniques to see distribution of allocated buffers and their retention over time. The key is to allocate colored memory. For example, to append a red buffer that contains RGBA values 0xFF000000 to specific allocations. I call these colored memory marks isomemotopes.
We can either inject a different isomemotope for a different data or change the isomemotope over time to mark specific allocation times. I created a test program that allocates buffers marked by a different amount of different isomemotopes every time:
#include "stdafx.h"

#include <stdlib.h>

#include <memory.h>

#include <windows.h>
typedef unsigned int ISOMEMOTOPE;
void *alloc_and_mark_with_isomemotope(size_t size,

                                     ISOMEMOTOPE color,

                                     size_t amount)

{

  char *p = (char *)malloc(size+amount);
  for (char *isop = p+size;

       p && isop  < p+size+amount;

       isop+=sizeof(ISOMEMOTOPE))

  {

    *(ISOMEMOTOPE *)isop=color;

  }
  return p;

}
int _tmain(int argc, _TCHAR* argv[])

{

  alloc_and_mark_with_isomemotope(0x1000,

                                 0xFF000000, // red

                                 0x10000);

  alloc_and_mark_with_isomemotope(0x1000,

                                 0x00FF0000, // green

                                 0x20000);

  alloc_and_mark_with_isomemotope(0x1000,

                                 0x0000FF00, // blue

                                 0x30000);

  alloc_and_mark_with_isomemotope(0x1000,

                                 0xFFFFFF00, // white

                                 0x40000);

  alloc_and_mark_with_isomemotope(0x1000,

                                 0xFFFF0000, // yellow

                                 0x50000);
DebugBreak();
  return 0;

}
Corresponding Dump2Picture image is this (0×00000000 address is at the bottom):

- Dmitry Vostokov @ DumpAnalysis.org -
Posted in Crash Dump Analysis, Debugging, Fun with Crash Dumps, Memory Visualization, New Words, Science of Memory Dump Analysis | 2 Comments »
Tuesday, April 15th, 2008
I’m very proud to announce that it is finally available in both paperback and hardback. Why have I made available both editions? Because I personally prefer hardcover books. You can order the book today and it will be printed in 3-5 days (paperback) or 5-10 days (hardcover) and sent to you:
Memory Dump Analysis Anthology, Volume 1
Note: although listed on Amazon and other online bookstores it is not immediately available at these stores at the moment due to the late submission. I apologize for this. However, I expect that in a few weeks pre-orders taken there will be eventually fulfilled. In the mean time, if you want the book now, you can use the link above.
- Dmitry Vostokov @ DumpAnalysis.org -
Posted in Announcements, Assembly Language, Books, Bugchecks Depicted, CDF Analysis Tips and Tricks, Citrix, Crash Dump Analysis, Crash Dump Patterns, Crash Dumps for Dummies, Debugging, Fun with Crash Dumps, GDB for WinDbg Users, Hardware, Kernel Development, Memory Dump Analysis Jobs, Memory Visualization, Minidump Analysis, Publishing, Science of Memory Dump Analysis, Security, Software Architecture, Software Technical Support, Stack Trace Collection, Tools, Troubleshooting Methodology, Vista, WinDbg Scripts, WinDbg Tips and Tricks, WinDbg for GDB Users, Windows Server 2008 | 3 Comments »
Wednesday, April 2nd, 2008
Born out of 2008 April Fool’s joke (although I was thinking about it long before) the idea is to have a general framework and associated IDE for analysis activities for various tools that produce logs. Similar to planned GUI Monitor integrating WindowHistory, MesageHistory and ScreenHistory tools but also including Debugger Log Analyzer, Debugging Notebooks, various memory and trace log visualization subsystems. It also has the working title UTF (Unified Tools Framework).
Seems I’m very easy on inceptions All this will be covered in great detail in the forthcoming book which I tirelessly advertise:
DebugWare: The Art and Craft of Writing Troubleshooting Tools
- Dmitry Vostokov @ DumpAnalysis.org -
Posted in Announcements, Crash Dump Analysis, Crash Dump Patterns, Debugging, Memory Visualization, Minidump Analysis, Software Architecture, Software Technical Support, Stack Trace Collection, Tools, Troubleshooting Methodology | 2 Comments »