Archive for the ‘Memory Visualization’ Category

Memory Dump Analysis Anthology, Volume 2

Tuesday, March 25th, 2008

Although the first volume has not been published yet (scheduled for 15th of April, 2008) the planning for the second volume has already begun. Preliminary information is:

  • Title: Memory Dump Analysis Anthology, Volume 2
  • Paperback: 512 pages (*)
  • ISBN-13: 978-0-9558328-7-1
  • Author: Dmitry Vostokov
  • Publisher: Opentask (01 Oct 2008)
  • Language: English
  • Product Dimensions: 22.86 x 15.24

Hardcover version is also planned. PDF version will be available for download too.

(*) subject to change

- Dmitry Vostokov @ DumpAnalysis.org -

Dump2Wave v1.2.1 source code

Friday, February 8th, 2008

Since the first release of Dump2Wave I was under pressure to publish its source code and today I released it under GPL. I have to apologize that it doesn’t always use secure string manipulation functions, error handling is copy/pasted several times and there are no comments. I promise better code in the next version. :-)

If you plan to make changes and improvements please let me know so I could enjoy your versions of memory sounds too. I used ancient Visual C++ 6.0 to compile and build the project.

// Dump2Wave version 1.2.1 (c) Dmitry Vostokov
// GNU GENERAL PUBLIC LICENSE
// http://www.gnu.org/licenses/gpl-3.0.txt

#include <iostream>
#include <process.h>
#include <windows.h>

#pragma pack(1)

typedef struct {

 unsigned int   riff;   // 'RIFF'
 unsigned int   length; // dump size + sizeof(WAVEFILEHDR) - 8
 unsigned int   wave;   // 'WAVE' 
 unsigned int   fmt;    // 'fmt '
 unsigned int   fmtlen; // 16  
 unsigned short code;   // 1
 unsigned short channels;  // 2
 unsigned int   sps;    // 44100
 unsigned int   avgbps; // sps*channels*(sbits/8)
 unsigned short alignment; // 4
 unsigned short sbits;  // 16
 unsigned int   data;   // 'data'
 unsigned int   datalen;  

} WAVEFILEHDR;

#pragma pack()

WAVEFILEHDR hdr = {'FFIR', sizeof(WAVEFILEHDR) - 8, 'EVAW',
  ' tmf', 16, 1, 2, 44100, 44100*4, 4, 16, 'atad', 0};

void DisplayError (LPCSTR szPrefix)
{
 LPSTR errMsg;
 CHAR  szMsg[256];
 strncpy(szMsg, szPrefix, 128);
 DWORD gle = GetLastError();
 if (gle && FormatMessage(FORMAT_MESSAGE_ALLOCATE_BUFFER|
  FORMAT_MESSAGE_FROM_SYSTEM, NULL, gle, 0,
  (LPSTR)&errMsg, 0, NULL))
 {
  strcat(szMsg, ": ");
  strncat(szMsg, errMsg, 120);
 }  
 std::cout << szMsg << std::endl; 
 LocalFree(errMsg);
}

int main(int argc, char* argv[])
{
 std::cout << std::endl << "Dump2Wave version 1.2.1" <<
    std::endl << "Written by Dmitry Vostokov, 2006" <<
    std::endl << std::endl;
 if (argc < 3)
 {
  std::cout << "Usage: Dump2Wave dumpfile wavefile [44100|22050|11025|8000 16|8 2|1]" << std::endl;
  return -1;
 }

 HANDLE hFile = CreateFile(argv[1],
  GENERIC_READ, FILE_SHARE_READ, NULL,
  OPEN_EXISTING, FILE_ATTRIBUTE_NORMAL, NULL);
 if (hFile == INVALID_HANDLE_VALUE)
 {
  DisplayError("Cannot read dump file"); 
  return -1;
 }

 DWORD dwDumpSizeHigh = 0;
 DWORD dwDumpSizeLow = GetFileSize(hFile, &dwDumpSizeHigh);
 CloseHandle(hFile);

 if (dwDumpSizeHigh)
 {
  std::cout << "The dump file must be less than 4Gb" <<
  std::endl;
  return -1;
 }

 if (argc == 6)
 {
  hdr.channels = atoi(argv[5]);
  hdr.sps = atoi(argv[3]);
  hdr.sbits = atoi(argv[4]);
  hdr.avgbps = hdr.sps*hdr.channels*(hdr.sbits/8);
  hdr.alignment = hdr.channels*(hdr.sbits/8);
 }

 dwDumpSizeLow = (dwDumpSizeLow/hdr.alignment)*(hdr.alignment);

 hdr.length += dwDumpSizeLow;
 hdr.datalen = dwDumpSizeLow;

 hFile = CreateFile(argv[2], GENERIC_WRITE, 0, 
  NULL, CREATE_ALWAYS, FILE_ATTRIBUTE_NORMAL, NULL);
 if (hFile == INVALID_HANDLE_VALUE)
 {
  DisplayError("Cannot create wave header file"); 
  return -1;
 }

 DWORD dwWritten;
 if (!WriteFile(hFile, &hdr, sizeof(hdr), &dwWritten, NULL))
 {
  DisplayError("Cannot write wave header file"); 
  CloseHandle(hFile);
  return -1;
 }

 
 CloseHandle(hFile);

 std::string str = "copy \"";
 str += argv[2];
 str += "\" /B + \"";
 str += argv[1];
 str += "\" /B \"";
 str += argv[2];
 str += "\" /B";

 system(str.c_str());
 
 return 0;
}

- Dmitry Vostokov @ DumpAnalysis.org -

Memory Dump Analysis Anthology, Volume 1

Thursday, February 7th, 2008

It is very easy to become a publisher nowadays. Much easier than I thought. I registered myself as a publisher under the name of OpenTask which is my registered business name in Ireland. I also got the list of ISBN numbers and therefore can announce product details for the first volume of Memory Dump Analysis Anthology series:

Memory Dump Analysis Anthology, Volume 1

  • Paperback: 720 pages (*)
  • ISBN-13: 978-0-9558328-0-2
  • Hardcover: 720 pages (*)
  • ISBN-13: 978-0-9558328-1-9
  • Author: Dmitry Vostokov
  • Publisher: Opentask (15 Apr 2008)
  • Language: English
  • Product Dimensions: 22.86 x 15.24

(*) subject to change 

PDF file will be available for download too.

- Dmitry Vostokov @ DumpAnalysis.org -

Dump2Picture v1.1 source code

Tuesday, February 5th, 2008

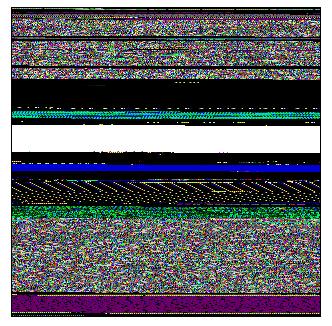
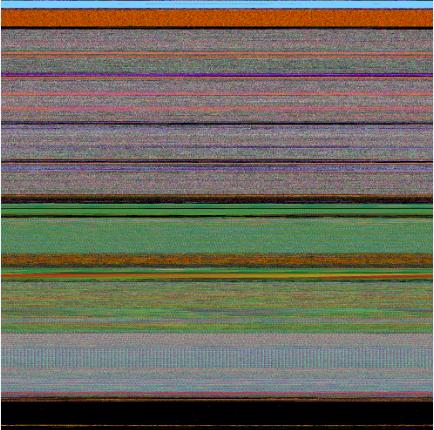
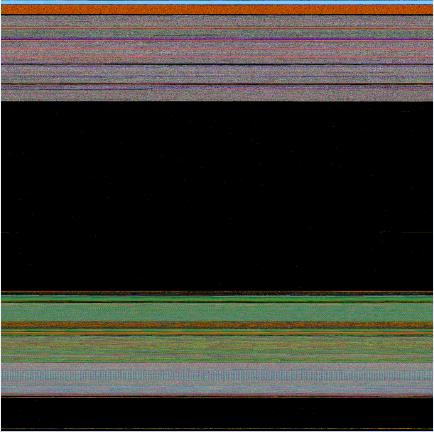
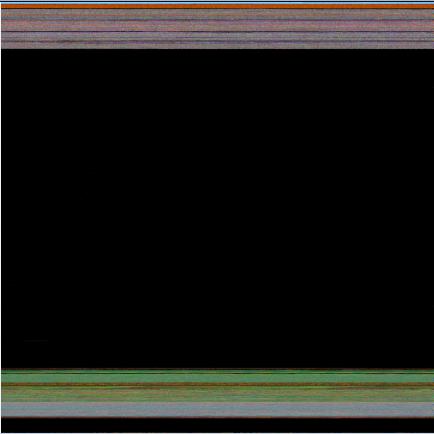
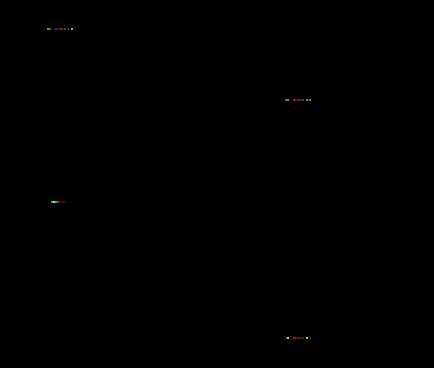
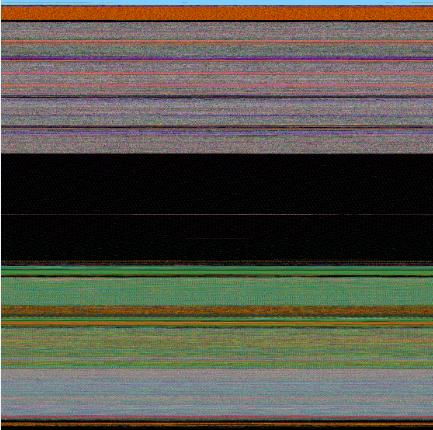
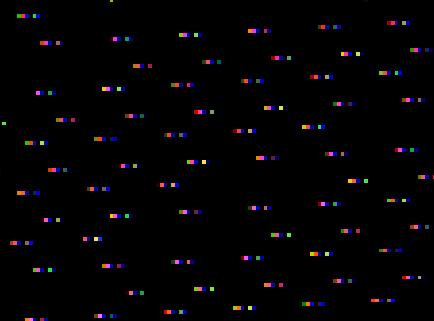
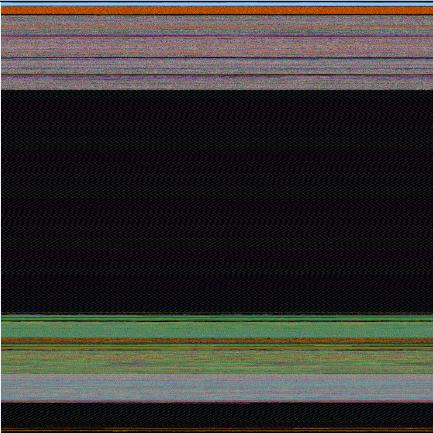
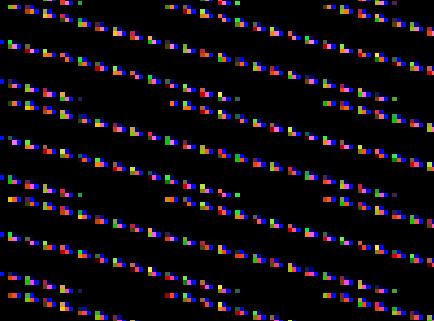
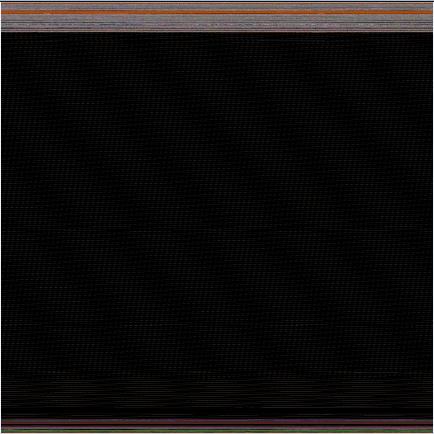
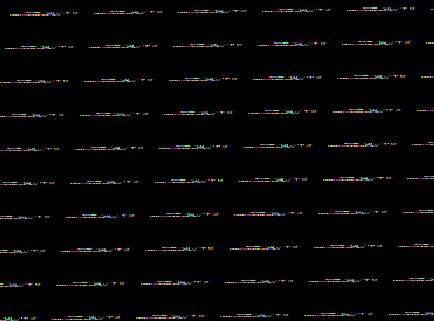
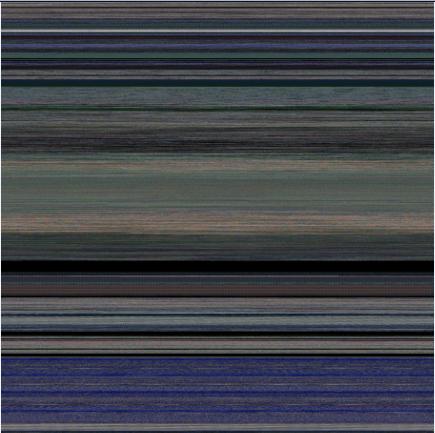
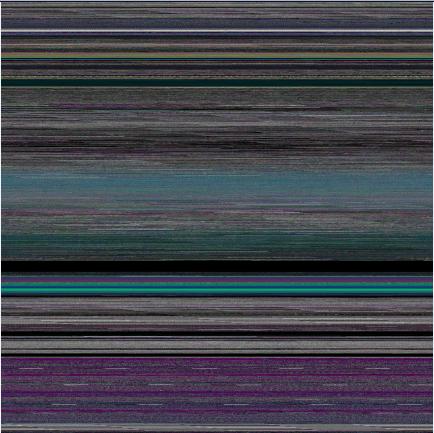
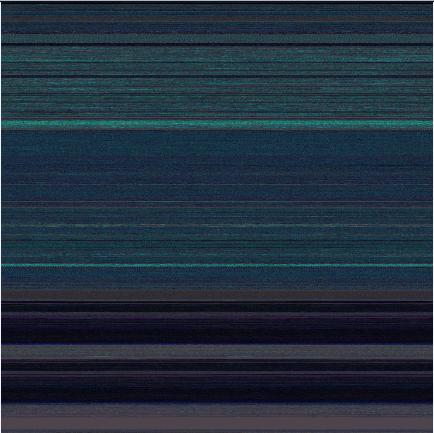
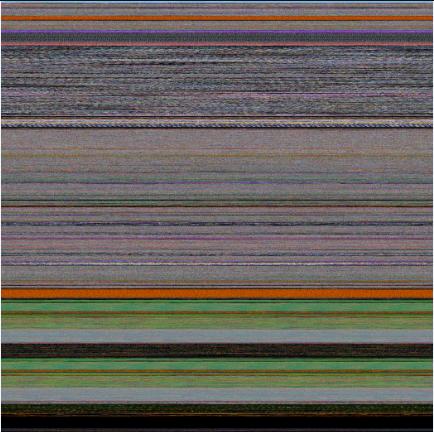
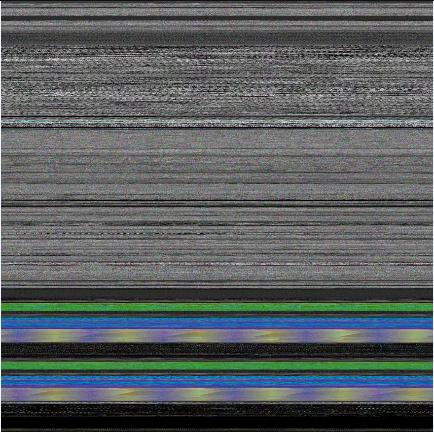
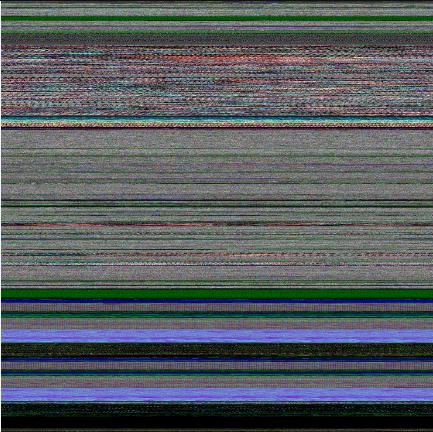
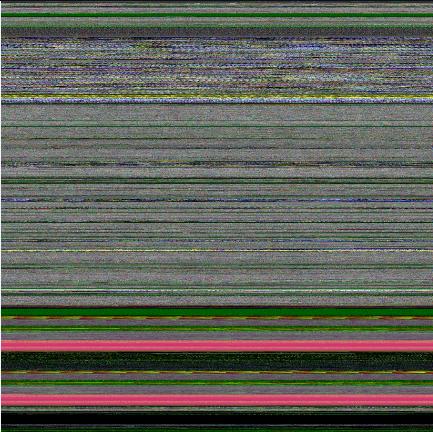
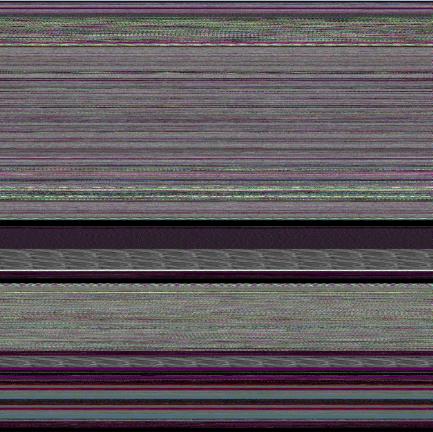
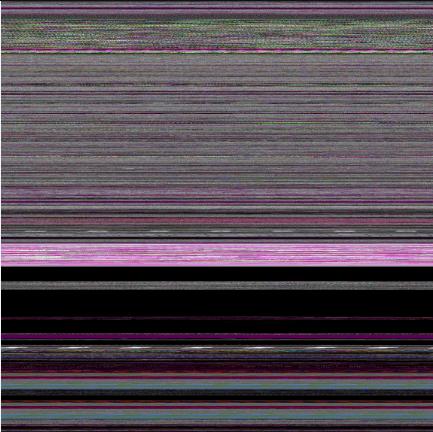
Since the first release of Dump2Picture I was under pressure to publish its source code and today I released it under GPL. I have to apologize that it doesn’t always use secure string manipulation functions, error handling is copy/pasted several times and there are no comments. I promise better code in the next version. :-)

If you plan to make changes and improvements please let me know so I could enjoy your versions of memory visuals too. I used ancient Visual C++ 6.0 to compile and build the project.

// Dump2Picture version 1.1 (c) Dmitry Vostokov
// GNU GENERAL PUBLIC LICENSE
// http://www.gnu.org/licenses/gpl-3.0.txt

#include <math.h>
#include <iostream>
#include <process.h>
#include <windows.h>

BITMAPFILEHEADER bmfh = { 'MB', 0, 0, 0,
   sizeof(BITMAPFILEHEADER) + sizeof(BITMAPINFOHEADER) };
BITMAPINFOHEADER bmih = { sizeof(BITMAPINFOHEADER), 0, 0, 1, 32,
   0, 0, 0, 0, 0, 0 };
RGBQUAD rgb[256];

void DisplayError (LPCSTR szPrefix)
{
 LPSTR errMsg;
 CHAR  szMsg[256];
 strncpy(szMsg, szPrefix, 128);
 DWORD gle = GetLastError();
 if (gle && FormatMessage(
    FORMAT_MESSAGE_ALLOCATE_BUFFER|FORMAT_MESSAGE_FROM_SYSTEM,
    NULL, gle, 0, (LPSTR)&errMsg, 0, NULL))
 {
  strcat(szMsg, ": ");
  strncat(szMsg, errMsg, 120);
 }  
 std::cout << szMsg << std::endl;
 LocalFree(errMsg);
}

int main(int argc, char* argv[])
{
 std::cout << std::endl << "Dump2Picture version 1.1"
    << std::endl << "Written by Dmitry Vostokov, 2007"
    << std::endl << std::endl;
 if (argc < 3)
 {
  std::cout << "Usage: Dump2Picture dumpfile bmpfile [8|16|24|32]" << std::endl;
  return -1;
 }

 HANDLE hFile = CreateFile(argv[1], GENERIC_READ,
    FILE_SHARE_READ, NULL, OPEN_EXISTING,
    FILE_ATTRIBUTE_NORMAL, NULL);
 if (hFile == INVALID_HANDLE_VALUE)
 {
  DisplayError("Cannot read dump file"); 
  return -1;
 }

 DWORD dwDumpSizeHigh = 0;
 DWORD dwDumpSizeLow = GetFileSize(hFile, &dwDumpSizeHigh);
 CloseHandle(hFile);

 if (dwDumpSizeHigh)
 {
  std::cout << "The dump file must be less than 4Gb"
     << std::endl;
  return -1;
 }

 if (argc == 4)
 {
  if (!strcmp(argv[argc-1],"8"))
  {
   bmih.biBitCount = 8;
   for (int i = 0; i < 256; ++i)
   {
    rgb[i].rgbBlue = rgb[i].rgbGreen = rgb[i].rgbRed = i;
    rgb[i].rgbReserved = 0;
   }
  }
  else if (!strcmp(argv[argc-1],"16"))
  {
   bmih.biBitCount = 16;
  }
  else if (!strcmp(argv[argc-1],"24"))
  {
   bmih.biBitCount = 24;
  }
  else
  {
   bmih.biBitCount = 32;
  }
 }

 bmih.biWidth = bmih.biHeight = sqrt((double)(dwDumpSizeLow/
    (bmih.biBitCount/8)));
 bmih.biWidth -= bmih.biWidth%2;
 if (bmih.biBitCount == 8 )
 {
  bmih.biWidth -= bmih.biWidth%8;
 }
 bmih.biHeight -= bmih.biHeight%2;
 bmih.biSizeImage = bmih.biWidth*bmih.biHeight*
    (bmih.biBitCount/8);
 if (bmih.biBitCount == 8 )
 {
  bmfh.bfOffBits += sizeof(rgb);
 }
 bmfh.bfSize = bmfh.bfOffBits + bmih.biSizeImage;

 hFile = CreateFile(argv[2], GENERIC_WRITE, 0, NULL,
    CREATE_ALWAYS, FILE_ATTRIBUTE_NORMAL, NULL);
 if (hFile == INVALID_HANDLE_VALUE)
 {
  DisplayError("Cannot create bitmap header file"); 
  return -1;
 }

 DWORD dwWritten;
 if (!WriteFile(hFile, &bmfh, sizeof(bmfh), &dwWritten, NULL))
 {
  DisplayError("Cannot write bitmap header file"); 
  CloseHandle(hFile);
  return -1;
 }

 if (!WriteFile(hFile, &bmih, sizeof(bmih), &dwWritten, NULL))
 {
  DisplayError("Cannot write bitmap header file"); 
  CloseHandle(hFile);
  return -1;
 }

 if (bmih.biBitCount == 8 )
 {
  if (!WriteFile(hFile, &rgb, sizeof(rgb), &dwWritten, NULL))
  {
   DisplayError("Cannot write bitmap header file"); 
   CloseHandle(hFile);
   return -1;
  }
 }
 
 CloseHandle(hFile);

 std::string str = "copy \"";
 str += argv[2];
 str += "\" /B + \"";
 str += argv[1];
 str += "\" /B \"";
 str += argv[2];
 str += "\" /B";

 system(str.c_str());
 
 return 0;
}

- Dmitry Vostokov @ DumpAnalysis.org -

Crash Dump Analysis Patterns (Part 35)

Monday, November 12th, 2007

In kernel or complete memory dumps coming from hanging or slow workstations and servers !irpfind WinDbg command may show IRP Distribution Anomaly pattern when certain drivers have excessive count of active IRPs not observed under normal circumstances. I created two IRP distribution graphs from two problem kernel dumps by preprocessing command output using Visual Studio keyboard macros to eliminate completed IRPs and then using Excel. In one case it was a big number of I/O request packets from 3rd-party antivirus filter driver:

\Driver\3rdPartyAvFilter

In the second case it was the huge number of active IRPs targeted to kernel socket ancillary function driver:

\Driver\AFD

Two other peaks on both graphs are related to NTPS and NTFS, pipes and file system and usually normal. Here is IRP distribution graph from my Vista workstation captured while I was writing this post:

- Dmitry Vostokov @ DumpAnalysis.org -

Memory Dump Analysis using Excel

Friday, November 9th, 2007

Some WinDbg commands output data in tabular format so it is possible to save their output to a text file, import it to Excel and do sorting, filtering, and graph visualization, etc. Some commands from WinDbg include:

!stacks 1

Lists all threads with Ticks column so you can sort and filter threads that had been waiting no more than 100 ticks, for
example.

!irpfind

Here we can create various histograms, for example, IRP distribution based on [Driver] column.

I’ll show more examples later but now the graph depicting thread distribution in PID - TID coordinates on a busy multiprocessor
system with 25 user sessions and more than 3,000 threads:

WinDbg scripts offer possibility to output various tabulated data via .printf:

0:000> .printf "a\tb\tc"
a       b       c

- Dmitry Vostokov @ DumpAnalysis.org -

Memory Visualization and Security

Wednesday, August 15th, 2007

This security warning is related to sound files and pictures produced by Dump2Wave, Dump2Picture and WinDbg scripts based on them.

These tools do not change computer memory data and it is present in resulting WAV and BMP files unmodified. Do not publish these files on Internet, otherwise you might expose your private or sensitive data.

If you use lossy compression afterwards, like MP3 or JPEG, all original computer memory content is lost and becomes non-recoverable.

Therefore, if you create a piece of modern art using Dump2Picture and want to publish it electronically always transform it into JPEG, for example.

- Dmitry Vostokov @ DumpAnalysis.org -

Picturing Computer Memory

Wednesday, August 15th, 2007

An alternative to converting memory dumps to picture files is to save a memory range to a binary file and then convert it to a BMP file. Thus you can view the particular DLL or driver mapped into address space, heap or pool region, etc.

To save a memory range to a file use WinDbg .writemem command:

.writemem d2p-range.bin 00800000 0085e000

or

.writemem d2p-range.bin 00400000 L20000

I wrote a WinDbg script that saves a specified memory range and then calls a shell script which automatically converts saved binary file to a BMP file and then runs whatever picture viewer is registered for .bmp extension.

The WinDbg script code (mempicture.txt):

.writemem d2p-range.bin ${$arg1} ${$arg2}
.if (${/d:$arg3})
{
  .shell -i- mempicture.cmd d2p-range ${$arg3}
}
.else
{
  .shell -i- mempicture.cmd d2p-range
}

The shell script (mempicture.cmd):

dump2picture %1.bin %1.bmp %2
%1.bmp

Because WinDbg installation folder is assumed to be the default directory for both scripts and Dump2Picture.exe they should be copied to the same folder where windbg.exe is located. On my system it is

C:\Program Files\Debugging Tools for Windows

Both scripts are now included in Dump2Picture package available for free download:

Dump2Picture package

To call the script from WinDbg use the following command:

$$>a< mempicture.txt Range [bits-per-pixel]

where Range can be in Address1 Address2 or Address Lxxx format, bits-per-pixel can be 8, 16, 24 or 32. By default it is 32.

For example, I loaded a complete Windows x64 memory dump and visualized HAL (hardware abstraction layer) module:

kd> lm
start             end                 module name
fffff800`00800000 fffff800`0085e000   hal
fffff800`01000000 fffff800`0147b000   nt
fffff97f`ff000000 fffff97f`ff45d000   win32k
...
...
...

kd> $$>a< mempicture.txt fffff800`00800000 fffff800`0085e000
Writing 5e001 bytes...

C:\Program Files\Debugging Tools for Windows>dump2picture d2p-range.bin d2p-range.bmp

Dump2Picture version 1.1
Written by Dmitry Vostokov, 2007

d2p-range.bmp
d2p-range.bin
        1 file(s) copied.

C:\Program Files\Debugging Tools for Windows>d2p-range.bmp
<.shell waiting 10 second(s) for process>
.shell: Process exited
kd>

and Windows Picture and Fax Viewer application was launched and displayed the following picture:

Enjoy :-)

- Dmitry Vostokov @ DumpAnalysis.org -

Unicode Illuminated

Tuesday, August 14th, 2007

I generated a memory dump with plenty of Unicode and ASCII strings “Hello World!” to see how they look on a picture. I assume you know the difference between Unicode (UTF-16) and ASCII encodings: wide characters from the former occupy two bytes:

0:000> db 008c7420 l20
008c7420  48 00 65 00 6c 00 6c 00-6f 00 20 00 57 00 6f 00  H.e.l.l.o. .W.o.
008c7430  72 00 6c 00 64 00 21 00-00 00 00 00 00 00 00 00  r.l.d.!.........

and characters from the latter occupy one byte of memory:

0:000> db 008c72b4 l10
008c72b4  48 65 6c 6c 6f 20 57 6f-72 6c 64 21 00 00 00 00  Hello World!....

You can see that the second byte for Unicode English characters is zero. I converted that memory dump into 8 bits-per-pixel bitmap using Dump2Picture and after zooming it sufficiently in Vista Photo Viewer until pixels become squares I got the following picture that illustrates the difference between Unicode and ASCII strings:

Incidentally the same memory dump converted to 32 bits-per-pixel bitmap shows Unicode “Hello World!” strings in green colors :-)

- Dmitry Vostokov @ DumpAnalysis.org -

Dump2Picture update (version 1.1)

Monday, August 13th, 2007

Previously announced Dump2Picture has been updated to version 1.1 with the following improvements to handle 8 bits-per-pixel images correctly:

- Saves grey scale palette

- Calculates right bitmap width and file size

The update can be downloaded from the same link:

Download Dump2Picture

Now 8 bits-per-pixel Vista kernel dump looks much better:

- Dmitry Vostokov @ DumpAnalysis.org -

Visualizing Memory Leaks

Sunday, August 12th, 2007

Dump2Picture can be used to explore memory leaks visually. I created the following small program in Visual C++ that leaks 64Kb every second:

#include "stdafx.h"
#include <windows.h>

int _tmain(int argc, _TCHAR* argv[])
{
  while (true)
  {
    printf("%x\n", (UINT_PTR)malloc(0xFFFF));
    Sleep(1000);
  }

  return 0;
}

Then I sampled 3 dumps at 7Mb, 17Mb and 32Mb process virtual memory size and converted them as 16 bits-per-pixel bitmaps. On the pictures below we can see that the middle black memory area grows significantly. Obviously malloc function allocates zeroed memory and therefore we see black color.

7Mb process memory dump:

17Mb process memory dump:

32Mb process memory dump:

If we zoom in the black area we would see the following pattern:


Colored lines inside are heap control structures that are created for every allocated block of memory. If this is correct then allocating smaller memory blocks would create a hatched pattern. And this is true indeed. The following program leaks 256 byte memory blocks:

#include "stdafx.h"
#include <windows.h>

int _tmain(int argc, _TCHAR* argv[])
{
  while (true)
  {
    printf("%x\n", (UINT_PTR)malloc(0xFF));
    Sleep(1000/0xFF);
  }

  return 0;
}

The corresponding process memory picture and zoomed heap area are the following:

Making allocations 4 times smaller makes heap area to look hatched and zoomed picture is more densely packed by heap control structures:

#include "stdafx.h"
#include <windows.h>

int _tmain(int argc, _TCHAR* argv[])
{
  while (true)
  {
    printf("%x\n", (UINT_PTR)malloc(0xFF/4));
    Sleep((1000/0xFF)/4);
  }

  return 0;
}


Here is another example. One service was increasing its memory constantly. The crash dump picture shows huge hatched dark region in the middle:


and if we zoom in this region:

Because the pattern and allocation size look uniform it could be the true heap memory leak for some operation that allocates constant size buffers. After opening the dump and looking at heap segments that had grown the most we see the same allocation size indeed:

0:000> !.\w2kfre\ntsdexts.heap -h 5
HEAPEXT: Unable to get address of NTDLL!NtGlobalFlag.
Index   Address  Name      Debugging options enabled
  1:   00140000
  2:   00240000
  3:   00310000
  4:   00330000
  5:   00370000
    Segment at 00370000 to 00380000 (00010000 bytes committed)
    Segment at 01680000 to 01780000 (00100000 bytes committed)
    Segment at 019C0000 to 01BC0000 (00200000 bytes committed)
    Segment at 01BC0000 to 01FC0000 (00400000 bytes committed)
    Segment at 01FC0000 to 027C0000 (00800000 bytes committed)
    Segment at 027C0000 to 037C0000 (01000000 bytes committed)
    Segment at 037C0000 to 057C0000 (02000000 bytes committed)

    Segment at 057C0000 to 097C0000 (00155000 bytes committed)


    057B96E0: 01048 . 01048 [07] - busy (1030), tail fill
    057BA728: 01048 . 01048 [07] - busy (1030), tail fill
    057BB770: 01048 . 01048 [07] - busy (1030), tail fill
    057BC7B8: 01048 . 01048 [07] - busy (1030), tail fill
    057BD800: 01048 . 01048 [07] - busy (1030), tail fill
    057BE848: 01048 . 01048 [07] - busy (1030), tail fill
    057BF890: 01048 . 00770 [14] free fill
  Heap entries for Segment07 in Heap 370000
    057C0040: 00040 . 01048 [07] - busy (1030), tail fill
    057C1088: 01048 . 01048 [07] - busy (1030), tail fill
    057C20D0: 01048 . 01048 [07] - busy (1030), tail fill
    057C3118: 01048 . 01048 [07] - busy (1030), tail fill
    057C4160: 01048 . 01048 [07] - busy (1030), tail fill
    057C51A8: 01048 . 01048 [07] - busy (1030), tail fill


- Dmitry Vostokov @ DumpAnalysis.org -

Visualizing Memory Dumps

Saturday, August 4th, 2007

As the first step towards Memory Dump Tomography I created a small program that interprets a memory dump as a picture. You can visualize crash dumps with it. The tool is available for free download:

Download Dump2Picture

Simply run it from the command prompt and specify full paths to a dump file and an output BMP file. The memory dump file will be converted by default into true color, 32 bits-per-pixel bitmap. You can specify other values: 8, 16 and 24.

C:\Dump2Picture>Dump2Picture.exe

Dump2Picture version 1.0
Written by Dmitry Vostokov, 2007

Usage: Dump2Picture dumpfile bmpfile [8|16|24|32]

For example:

C:\Dump2Picture>Dump2Picture.exe MEMORY.DMP MEMORY.BMP 8

Dump2Picture version 1.0
Written by Dmitry Vostokov, 2007

MEMORY.BMP
MEMORY.DMP
        1 file(s) copied.

Below are some screenshots of bitmap files created by the tool. Think about them as visualized kernel or user address spaces. 

Vista kernel memory dump (8 bits-per-pixel):

Vista kernel memory dump (16 bits-per-pixel):

Vista kernel memory dump (24 bits-per-pixel):

Vista kernel memory dump (32 bits-per-pixel):

Notepad process user memory dump (8 bits-per-pixel):

Notepad process user memory dump (16 bits-per-pixel):

Notepad process user memory dump (24 bits-per-pixel):

Notepad process user memory dump (32 bits-per-pixel):

Mspaint process user memory dump (32 bits-per-pixel):

Mspaint process user memory dump after loading “Toco Toucan.jpg” from Vista Sample Pictures folder (32 bits-per-pixel):

Citrix ICA client process (wfica32.exe) user memory dump (32 bits-per-pixel):

Enjoy :-)

- Dmitry Vostokov @ DumpAnalysis.org -

Listening to Computer Memory

Sunday, July 29th, 2007

An alternative to converting memory dumps to sound files is to save a memory range to a binary file and then convert it to a wave file. The latter is better for complete memory dumps which can be several Gb in size.

To save a memory range to a file use WinDbg .writemem command:

.writemem d2w-range.bin 00400000 00433000

or

.writemem d2w-range.bin 00400000 L200

I wrote a WinDbg script that saves a specified memory range and then calls a shell script which automatically converts saved binary file to a wave file and then runs whatever sound program is registered for .wav extension. On many systems it is Microsoft Media Player unless you installed any other third-party player.

The WinDbg script code (memsounds.txt):

.writemem d2w-range.bin ${$arg1} ${$arg2}
.if (${/d:$arg5})
{
  .shell -i- memsounds.cmd d2w-range ${$arg3} ${$arg4} ${$arg5}
}
.elsif (${/d:$arg4})
{
  .shell -i- memsounds.cmd d2w-range ${$arg3} ${$arg4}
}
.elsif (${/d:$arg3})
{
  .shell -i- memsounds.cmd d2w-range ${$arg3}
}
.else
{
  .shell -i- memsounds.cmd d2w-range
}

The shell script (memsounds.cmd):

dump2wave %1.bin %1.wav %2 %3 %4
%1.wav

Because WinDbg installation folder is assumed to be the default directory for both scripts and Dump2Wave.exe they should be copied to the same folder where windbg.exe is located. On my system it is

C:\Program Files\Debugging Tools for Windows

Both scripts are included in Dump2Wave package available for free download:

Dump2Wave package

To call the script from WinDbg use the following command:

$$>a< memsounds.txt Range [Freq] [Bits] [Channels]

where Range can be in Address1 Address2 or Address Lxxx format, Freq can be 44100, 22050, 11025 or 8000, Bits can be 8 or 16, Channels can be 1 or 2. By default it is 44100, 16, 2.

If you have a live debugging session or loaded a crash dump you can listen to a memory range immediately. For example, the range of memory from 00400000 to 00433000 interpreted as 44.1KHz 16bit stereo:

0:000> $$>a< memsounds.txt 00400000 00433000
Writing 33001 bytes...

C:\Program Files\Debugging Tools for Windows>dump2wave d2w-range.bin d2w-range.wav

Dump2Wave version 1.2.1
Written by Dmitry Vostokov, 2006

d2w-range.wav
d2w-range.bin
        1 file(s) copied.

C:\Program Files\Debugging Tools for Windows>d2w-range.wav
.shell: Process exited
0:000>

or the same range interpreted as 8KHz 8bit mono:

0:000> $$>a< memsounds.txt 00400000 00433000 8000 8 1
Writing 33001 bytes...

C:\Program Files\Debugging Tools for Windows>dump2wave d2w-range.bin d2w-range.wav 8000 8 1

Dump2Wave version 1.2.1
Written by Dmitry Vostokov, 2006

d2w-range.wav
d2w-range.bin
        1 file(s) copied.

C:\Program Files\Debugging Tools for Windows>d2w-range.wav
.shell: Process exited
0:000>

The script starts Windows Media Player on my system and I only need to push the play button to start listening.

Enjoy :-)

- Dmitry Vostokov @ DumpAnalysis.org -

Voices from Process Space

Sunday, November 19th, 2006

Following the release of Dump2Wave tool some members of Citrix community have been asking me to provide some interesting sound fragments from dump files. I was also particularly interested in catching voices from the past: embedded fragments of human voice. So I recorded my “Hello” message, played it by Media Player and then saved a process dump. Then I converted the dump to CD-quality wave file and saved interesting sound fragments from it (to conserve space - the original wave file was 76Mb).

To listen to these fragments you can download wave files from the following location:

DumpSounds.zip (8Mb)

Here is the description of what I heard in these wave files:

- dump1.wav

  • violin
  • aliens
  • train sound
  • Hello

- dump2.wav

  • electric guitar
  • signals from cosmos

- dump3.wav

  • Morse code alphabet

- dump4.wav

  • helicopter

- dump5.wav

  • horn
  • some interesting noise and fragments of electronic music

 Enjoy :-)

Of course, you can convert kernel memory dumps to wave files and hear voices from kernel space too…

- Dmitry Vostokov -

Dump2Wave update

Sunday, October 29th, 2006

Dump2Wave has been updated and can be downloaded from the same link as before:

Download Dump2Wave version 1.2.1

What’s new and corrections list:

  • Dumps with file size not divisible by the product of bytes-per-sample and channels (sample alignment) are converted into correct wave files now
  • Sample alignment is calculated correctly for non-CD quality wave
  • File paths with spaces are allowed now (you need to include them in double quotes)
  • Added diagnostic and error messages

- Dmitry Vostokov -

Dump Tomography

Sunday, October 22nd, 2006

There is an idea to interpret a process or a system dump as a picture (similar to interpreting it as a giant wave file: Dump2Wave). I would like to extend this idea and present it as a Dump Tomography - a combination of images taken from a dump when looking at it from different perspectives - memory, resources, subsystem hierarchy, etc. I’m going to include some simple pictorial interpretations and representations in forthcoming DumpPlayer.

Dump Analysis becomes both Medicine and Art. You can finally hear how corruption sounds and how it looks :-)

- Dmitry Vostokov -

Musical Dumps: Dump2Wave

Sunday, October 22nd, 2006

Dump2Wave command line tool is available for free download:

Download Dump2Wave

Simply run it from the command prompt and specify full paths to dump file and output WAV file. Dump file will be converted by default into 44.1KHz 16bit stereo WAV file (CD quality). You can specify you own conversion parameters like samples per second (22050, 11025, etc), bits per sample (8 or 16) and the number of channels (1 - mono, 2 - stereo):

For example, I converted sndrec32.dmp to sndrec32.wav:

The dump was taken after sndrec32.exe played “Windows XP Logon Sound.wav” file from \Windows\Media folder and that wave file was originally sampled as 22050Hz 16bits stereo. By listening to sndrec32.dmp I was able to hear a fragment from that logon sound because it was stored in a buffer inside sndrec32.exe process.

Note: Dump2Wave will not convert a dump file which is greater than 4Gb. Forthcoming DumpPlayer will be able to play large complete memory dumps in real-time without conversion and you could graphically choose a region to play.

Just a reminder on how you can save a dump manually (unless you have a dump from application crash or BSOD):

Dumping Processes Without Breaking Them

Microsoft User Mode Process Dumper

How to Attach NTSD to a Process and Save a Dump

How to Attach WinDbg to a Process

- Dmitry Vostokov -