Archive for the ‘Memory Visualization’ Category
Monday, July 13th, 2009
In this part we see how we can load memory dumps into ParaView data analysis and visualization system. First we need to download the latest version from here. If we have a memory dump we need first to calculate its dimensions and for a square we can use this simple formula: (int)sqrt(file_size/4). For example, the dump file I use here has the size of 1,746,853 bytes, therefore we have 660×660.
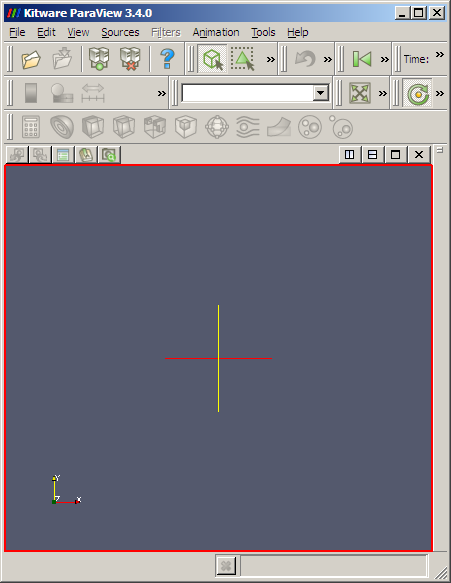
1. Launch ParaView:
2. Go to File \ Open and select All Files (*.*) and choose your .dmp file. The following dialog appears:
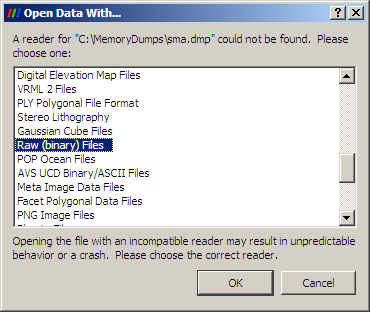
Choose Raw (binary) Files option.
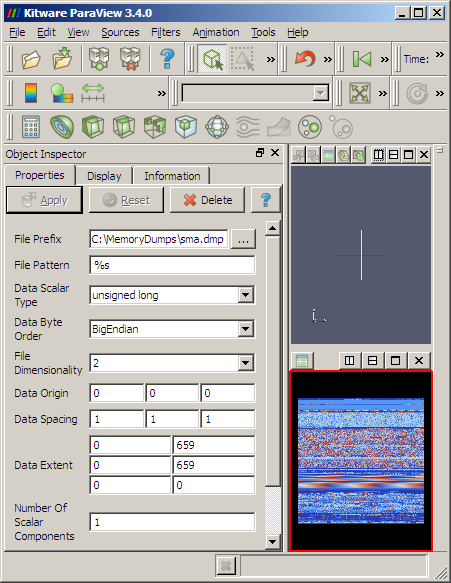
3. If nothing changes on the screen go to View menu and select Object Inspector. The following panel should appear:
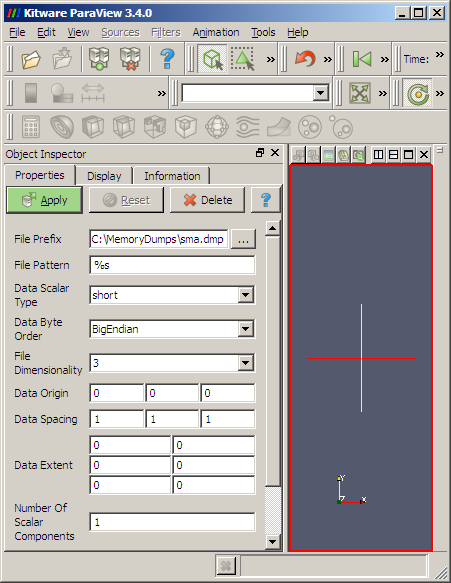
4. Here we should carefully specify parameters for our dump file:
Data Scalar Type: unsigned long
File Dimensionality: 2
Data Extent:
0 659
0 659
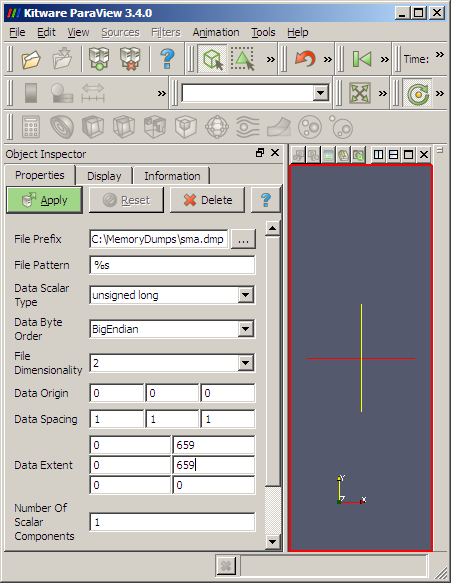
5. We then Apply and get the dump loaded:
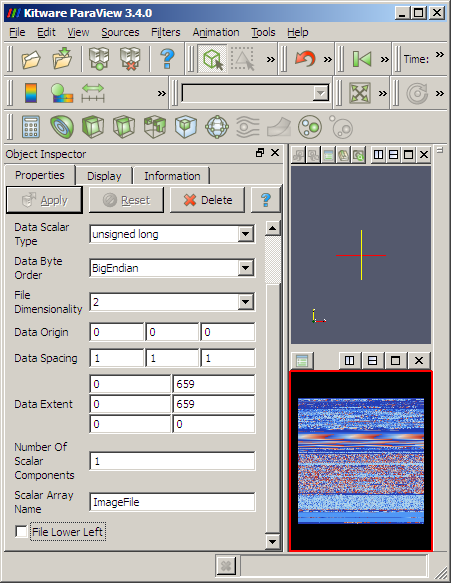
6. We might want to uncheck File Lower Left at the bottom of the Object Inspector properties to get lower memory addresses start from the left-top corner of the image:
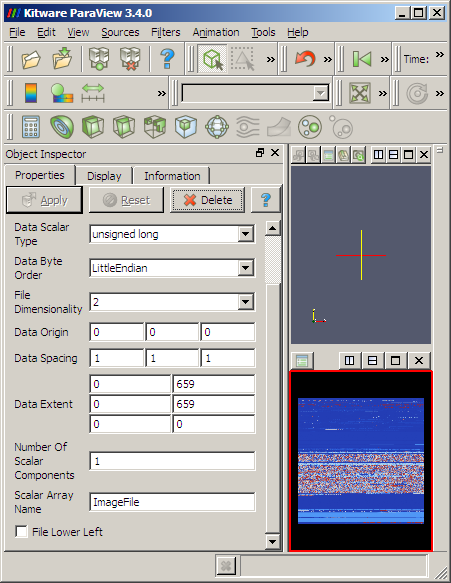
7. Also Data Byte Order LittleEndian obviously changes the color of RGB triplets or RGBA quadruplets but the large scale structure remains the same:
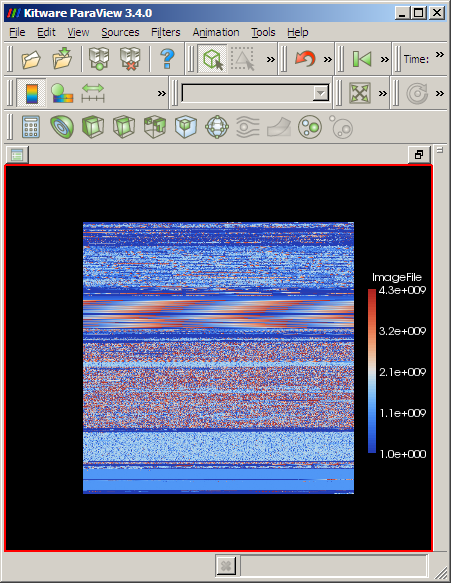
8. We can select View \ Show Color Legend to see how unsigned long values from the dump file are mapped continuously to colors:
I prefer to choose BigEndian because we get similar layout as we get from ImageMagick RGBA conversion or from Dump2Picture:

9. ParaView can even load large dumps, for example, this is a screenshot of 1.5Gb dump in big endian and little endian byte orderings respectively:
- Dmitry Vostokov @ DumpAnalysis.org -
Posted in Fun with Crash Dumps, Memory Visualization, Tools | 3 Comments »
Thursday, July 9th, 2009
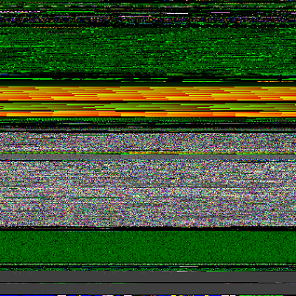
There are many books and articles titled “Large-scale Structure of X”, where X can be Space-Time, Cosmos or Universe. Here is the large-scale structure of 12Gb complete memory dump:
The image was generated with the help of ImageMagick. The dump file was interpreted as a raw RGBA image with 8-bits per color:
C:\MemoryDumps>convert -size 56751x56751 -depth 8

-resize 450x450 rgba:complete.dmp dump_12Gb_rgba_8_sq.jpg
The width and height were calculated as sqrt(filesize/4).
Complete memory dumps are physical memory dumps where modularized structure of virtual space of kernel and process memory is not expected but we see some structure nevertheless.
I’ve also created two pages with dump slices. Some viewers do not handle files with more that 32767 pixels in one dimension so I split 450×56751 slice into two:
Complete Memory Dump Slice Part 1 (11Mb JPEG)
Complete Memory Dump Slice Part 2 (10Mb JPEG)
- Dmitry Vostokov @ DumpAnalysis.org -
Posted in Art, Fun with Crash Dumps, Memory Visualization, Philosophy, Science of Memory Dump Analysis | No Comments »
Wednesday, July 8th, 2009
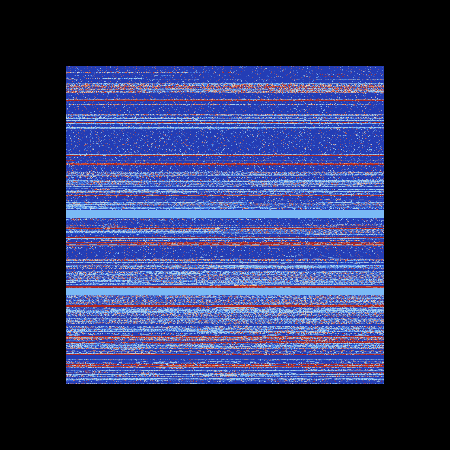
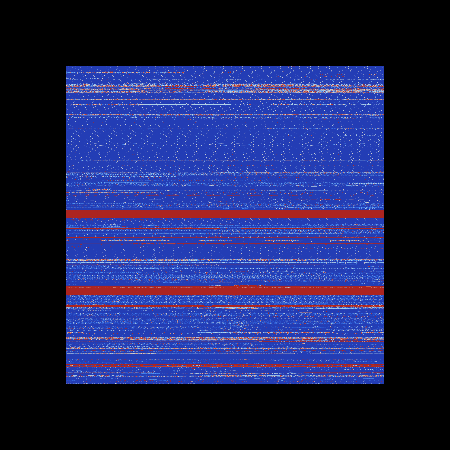
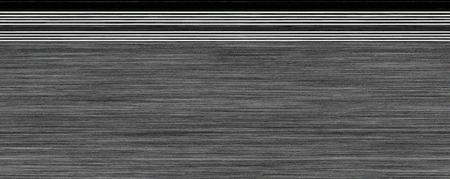
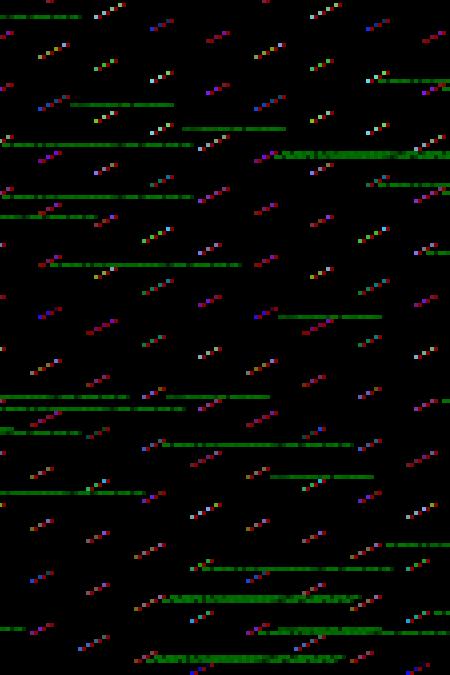
Recently I discovered Quantum Levels on top of a continuum in one kernel memory dump:
- Dmitry Vostokov @ DumpAnalysis.org -
Posted in Art, Fun with Crash Dumps, Memory Visualization | No Comments »
Friday, May 29th, 2009
Now some pictures from Citrix CDF traces.
Deep waters of The Sea of Traces:
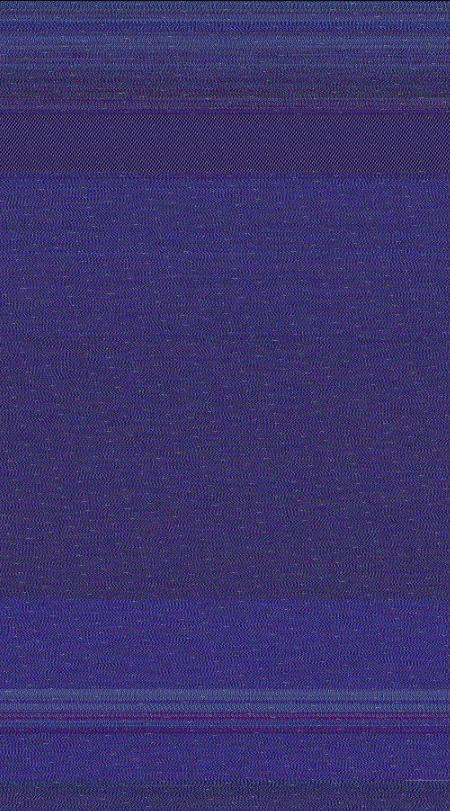
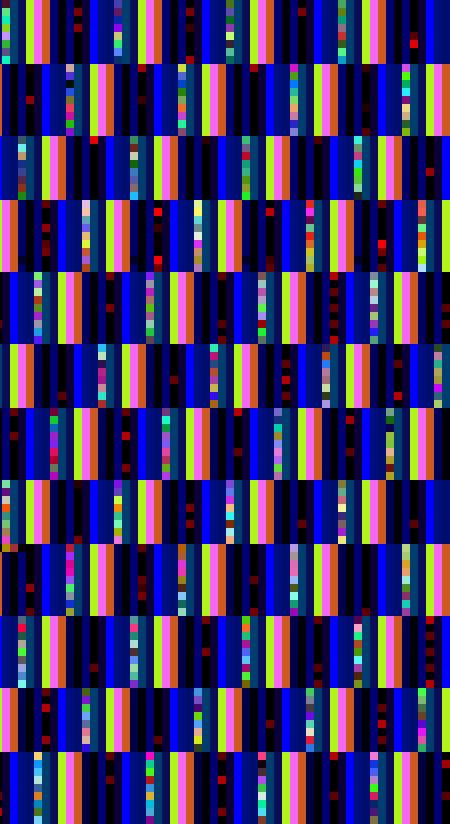
Considering software tracing as narrative no wonder one day I discovered the vast Library of Software Logs in the sea above:
- Dmitry Vostokov @ DumpAnalysis.org -
Posted in Art, Citrix, Fun with Crash Dumps, Memory Space Art, Memory Visualization, Software Trace Analysis, Software Trace Visualization | No Comments »
Saturday, May 23rd, 2009
Inspired by Penrose tensor notation encountered in The Road to Reality book and Feynman diagrams I’d like to introduce Visual Dump Objects (VDO) graphical notation to depict and communicate memory dump analysis patterns, their combinations and analysis results. Let’s look at some basic visual objects (shown in handwriting).
1. A thread:
 or
or 
2. A function:

3. A module:

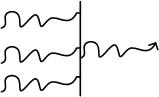
4. A thread running through functions, modules or both (stack trace). Optional arrowhead can indicate stack trace direction:
 or
or 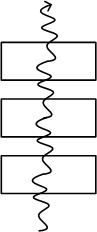 or
or 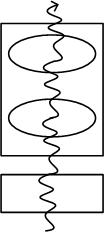
Threads running through modules depict collapsed stack traces.
5. A blocked thread:

An example of 3 threads blocked by another thread (an arrowhead can disambiguate the direction of the waiting chain):
6. A spiking thread (colors are encouraged in VDO notation):
 or
or 
7. Space boundary between user land and kernel land:

Here is an example of the thread spiking in kernel space:
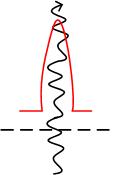
or with modules from stack trace:
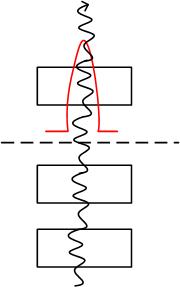
More notation to come very soon.
- Dmitry Vostokov @ DumpAnalysis.org -
Posted in Announcements, Crash Dump Analysis, Crash Dump Patterns, Crash Dumps for Dummies, Debugging, Memory Visualization, Multithreading, Tools, Visual Dump Analysis | 3 Comments »
Tuesday, May 19th, 2009
Here are some artistic images found in process memory dumps of VLC media player and IE. The latter was freezing after memory leaking, the size of its memory dump file is more than 1.5Gb.
Needle (VLC)

The tip of the same Needle magnified by x8:

The Image of Heap (from IE):
Red Zones (from IE):

- Dmitry Vostokov @ DumpAnalysis.org -
Posted in Art, Fun with Crash Dumps, Memory Visualization | 1 Comment »
Monday, May 18th, 2009
Last weekend I came across this book in a local bookshop:
Patterns Of The Earth

I immediately recalled all beautiful patterns I have seen and collected from visualized computer memory maps. I plan to include many images in a full-color book this summer:
Patterns of Computer Memory (ISBN: 978-1906717711)
This book should be essential for creative computer engineers and inquiring debugging minds!
- Dmitry Vostokov @ DumpAnalysis.org -
Posted in Announcements, Art, Books, Fun with Crash Dumps, Memory Visualization, Publishing, Reviewed on Amazon | No Comments »
Thursday, May 7th, 2009
This is the enhanced version of Dump2Wave technology that allows to transform computational operations into audible artifacts.
Computational processes and threads are fiber bundled with native memory visualization techniques to create audio and visual images of powerful memory topoi. This opens the new era in music. The closure of analog -> digital -> analog enables visualization and auralization of finite and infinite (transfinite) digital data.
Stay tuned! More on this later…
- Dmitry Vostokov @ DumpAnalysis.org -
Posted in Announcements, Fun with Crash Dumps, Memory Auralization, Memory Visualization, Music for Debugging, Poetry | No Comments »
Sunday, March 29th, 2009
Previously announced Memory Analysis and Debugging Institute was registered in the Republic of Ireland (No. 382026) last week.
- Dmitry Vostokov @ DumpAnalysis.org -
Posted in Announcements, Crash Dump Analysis, Debugging, Education and Research, History, Memory Analysis Forensics and Intelligence, Memory Visualization, Philosophy, Riemann Programming Language, Science of Memory Dump Analysis, Security, Software Technical Support, Testing, Training and Seminars | No Comments »
Tuesday, February 10th, 2009
Most of (if not all) debugging is arithmetical. Here I would like to introduce a new kind of debugging and troubleshooting approach that interprets observables as objects in their own spaces, for example, the possible space of various GUI forms. These spaces are not necessarily rational-valued spaces of simulation output or discreet arithmetic spaces of memory locations and values.
This geometrical approach applies modeling and systems theory to debugging and troubleshooting by treating them as mappings (or functions in the case of one-to-one or many-to-one mappings) from the space of all possible software environment states (SE) to the space(s) of observables. Here we have a family of mappings to different spaces:
fi: SE → SOi
Some observables can be found fixed like the list of components and the number of mappings can be reduced (i < j):
fj: SEa,b,c,d,… → SOj
In every system and its environment we have something fixed as parameters (a, b, c, d, …) and this could be the list of components as high level ”genotype” or it could be just specific code (low-level “genotype”), specific data or hardware specification. The whole family of mappings become parametrized. If we want, we can reduce mappings even more to treat them as many-valued (one-to-many or many-to-many) if several observables belong to the same kind of space.
Let me illustrate this by an analogy with modeling of a natural system. The system to be modeled is a falling ball together with its environment (Earth). The system obviously has some internal structure (abstract space of states, E) but we don’t know it. Fortunately, we can observe some measurable values like the ball position at any time (Q). So we have these mappings for balls with different masses:
fm: E → Q
We also find that for any individual ball its mass doesn’t change so we abstract it as a parameter:
f: Em → Q
The same modeling approach can be applied to a software system be it an application or a service running inside an operating system or a software system itself running inside a hardware. The case of pure software system abstracted from hardware is simple. In such a case SE space theoretically could be the space of abstract memory dumps. Practically we deal with the space of observables (universal memory dumps) that approximate SE and spaces of software “phenotypes”, observable behaviour, like distorted GUI, for example, or measured values of memory and CPU consumption or disk I/O throughput.
- Dmitry Vostokov @ DumpAnalysis.org -
Posted in Announcements, Crash Dump Analysis, Debugging, Mathematics of Debugging, Memory Visualization, Science of Memory Dump Analysis | No Comments »
Sunday, February 8th, 2009
Andrzej Dyjak features Linux application core dumps converted to bitmap images:
Dumb Gallery
- Dmitry Vostokov @ DumpAnalysis.org -
Posted in Announcements, Fun with Crash Dumps, Memory Visualization | No Comments »
Monday, January 26th, 2009
What if you are given a universal memory dump and want to find some intelligence artifacts in it? I think the problem is similar to searching for software artifacts in a computer memory dump out of quadrimemorillion of them in the absence of symbol files and suitable memory dump reader. Perhaps memory visualization techniques provide a direction to solving extraterrestrial problems too. This SETI association probably came to my mind when one of the readers of my memory religion post recalled his job application to SETI institute.
- Dmitry Vostokov @ DumpAnalysis.org -
Posted in Fun with Crash Dumps, Memory Visualization, Philosophy, Science of Memory Dump Analysis | No Comments »
Wednesday, January 21st, 2009
DumpAnalysis.org team starts working on the next generation multi-monitor memory visualization framework utilizing DirectShow, Direct2D, Direct3D and DXGI technologies. Full system architecture and sample code for memory viewers using DirectShow technology will be featured in the forthcoming Computer Memory Visualization book.
- Dmitry Vostokov @ DumpAnalysis.org -
Posted in Announcements, Crash Dump Analysis, Debugging, Fun with Crash Dumps, Memory Visualization, Windows 7 | No Comments »
Friday, January 16th, 2009
DumpAnalysis.org accepts hardware such as laptops for reviewing in relation to their suitability for extreme debugging, computer forensics, crash dump analysis and memory visualization. If you work for a H/W company like HP, Apple, Dell, Acer, Sony or any other respectable manufacturer please don’t hesitate to forward this post to your management: it could be your company brand or laptop model that debugging and software technical support community chooses next time of upgrade or for T&D / R&D! H/W reviews will be posted on the main portal page which currently has an audience of more than a hundred thousand unique visitors per year from more than 20,000 network locations (*).
If your company is interested please don’t hesitate to use this contact form:
http://www.dumpanalysis.org/contact
(*) From Google Analytics report.
- Dmitry Vostokov @ DumpAnalysis.org -
Posted in Announcements, Crash Dump Analysis, Debugging, Hardware, Memory Analysis Forensics and Intelligence, Memory Visualization, Vista, Windows Server 2008 | No Comments »
Thursday, January 15th, 2009
Last weekend I spent a few hours devising a cover for the forthcoming computer memory visualization book and finally created this one piece cover featuring a journey to the center of pagefile theme and the discovery of cosmic rays in memory:
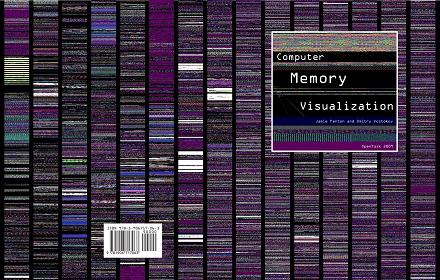
Coincidentally the whole 100 x 18400 centered slice of pagefile.sys image fit on the cover and nothing was left!
- Dmitry Vostokov @ DumpAnalysis.org -
Posted in Announcements, Books, Memory Visualization, Publishing | No Comments »
Wednesday, January 7th, 2009
While working on “Computer Memory Visualization” book I noticed this recent title and immediately bought it:
Core Memory: A Visual Survey of Vintage Computers
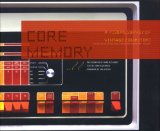
This is not only a wonderful hardcover coffee table book with stunning photographs of old computers and their memory hardware but also has numerous historical notes. It nicely complements my own DLL List Landscape: The Art from Computer Memory Space book that features virtual memory visual images.
- Dmitry Vostokov @ DumpAnalysis.org -
Posted in Books, Hardware, Memory Visualization | No Comments »
Monday, January 5th, 2009
I made a beautiful 100 x 18400 slice of pagefile.bmp generated by Dump2Picture using ImageMagick (1.5Mb JPEG image):

Wider 450 x 18400 slice (7Mb JPEG image) is available for viewing here:
Page File Image Slice (7Mb JPEG)
- Dmitry Vostokov @ DumpAnalysis.org -
Posted in Fun with Crash Dumps, Memory Visualization | 1 Comment »
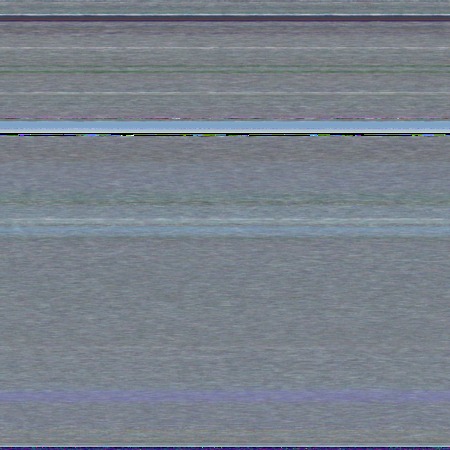
Sunday, January 4th, 2009
I was curious about how page file looks like when represented as a bitmap picture image like I previously did with memory dumps and I expected it to look like a picture of a complete memory dump due to its purpose as a backup to physical memory. It looks similar indeed. Here is a picture of a 1.3Gb pagefile.sys from my home computer after running Vista for last 2 weeks, generated by Dump2Picture tool and resized from 18400 x 18400 32-bit bitmap by ImageMagick:

- Dmitry Vostokov @ DumpAnalysis.org -
Posted in Fun with Crash Dumps, Memory Visualization | 1 Comment »
Saturday, December 27th, 2008
It had always been my dream since I left Moscow State University to be associated with a research institute. Until yesterday it became a reality with the announcement of
Memory Analysis & Debugging Institute (MA&DI).
From: http://www.dumpanalysis.org/madinstitute-announcement
- Dmitry Vostokov @ DumpAnalysis.org -
Posted in Announcements, Crash Dump Analysis, Debugging, Education and Research, History, Memory Analysis Forensics and Intelligence, Memory Visualization, Philosophy, Science of Memory Dump Analysis, Security, Software Technical Support, Testing, Training and Seminars | 1 Comment »
Friday, December 26th, 2008
OpenTask publisher plans to expand its offering of computer memory visualization titles:
http://www.opentask.com/memory-visualization-titles
More details will be announced soon.
- Dmitry Vostokov @ DumpAnalysis.org -
Posted in Announcements, Books, Memory Visualization, Publishing | No Comments »